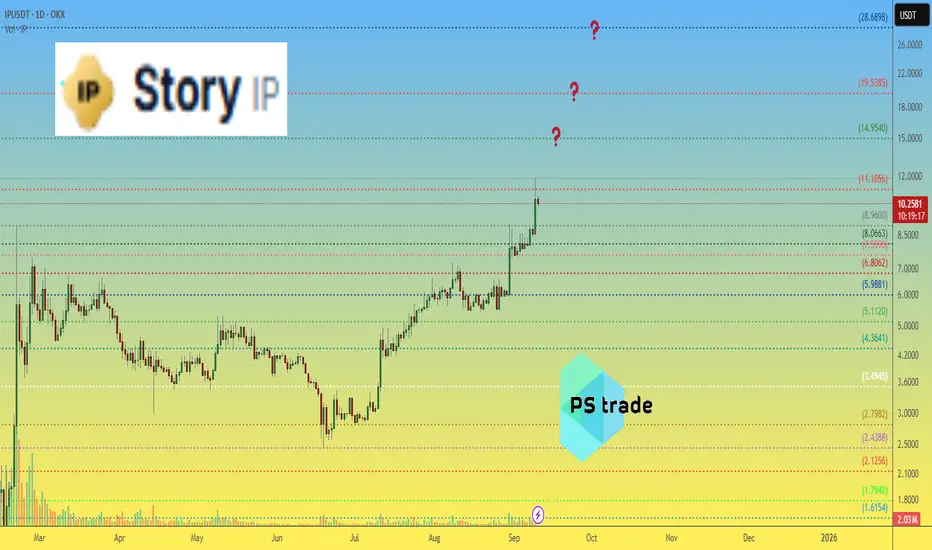
Story IP price analysisThe price action of #IP suggests there may be room for another upward leg 🚀
Key question for OKX:IPUSDT :
▪️ Is momentum strong enough to push toward $15, $20, or even $28?
Market context: at a current price slightly above $10, the Story project is already valued at $3.1B market cap.
❓ Where do
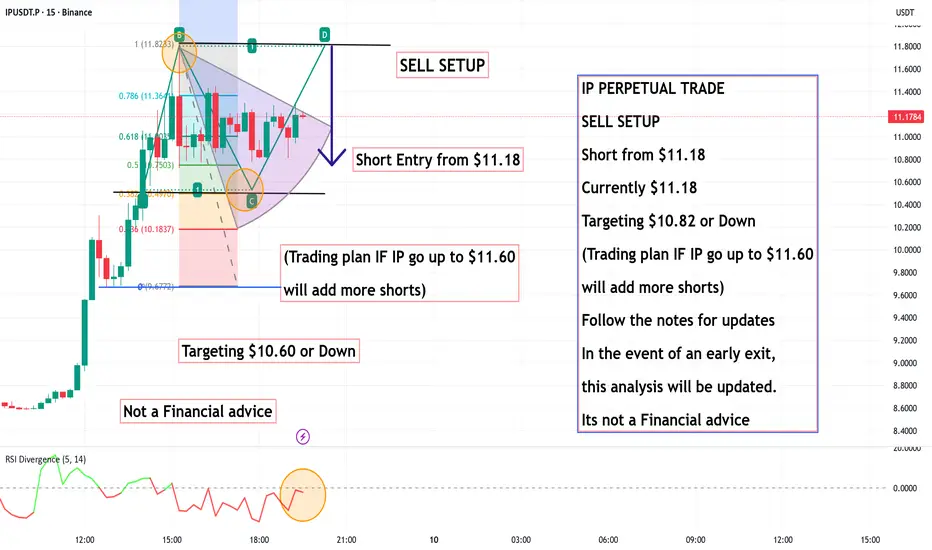
IP PERPETUAL TRADE SELL SETUP Short from $11.18IP PERPETUAL TRADE
SELL SETUP
Short from $11.18
Currently $11.18
Targeting $10.82 or Down
(Trading plan IF IP go up to $11.60
will add more shorts)
Follow the notes for updates
In the event of an early exit,
this analysis will be updated.
Its not a Financial advice
IP Market Update📊 NYSE:IP Market Update
If you want to enter or re-enter, best to wait for retracement into the green zone around $7.9698 🟢
👉 Potential bounce area for long entry 🚀
⚡ Trade smarter, not hope 🔑

IPUSDT, Podjatiya, Proboy model bilan Long pozitsiya1. On the D1 chart, a zone formed from the Paranormal Bar!
2. Relative to the 8.5320 zone, an LP has appeared, but the price has not moved downward.
3. Relative to the zone, price lows are rising, while the highs are being squeezed into one price point.
4. If, on the local TF, the price breaks above

IP Market Update📉 NYSE:IP Market Update
NYSE:IP appears to have formed a Head & Shoulders pattern ❌
Currently, price is testing the blue support level 🔵
The potential play:
🔹 If this support breaks down, it could open a short opportunity.
🔹 The first target would be the green line level 🎯
⚠️ Always wait for

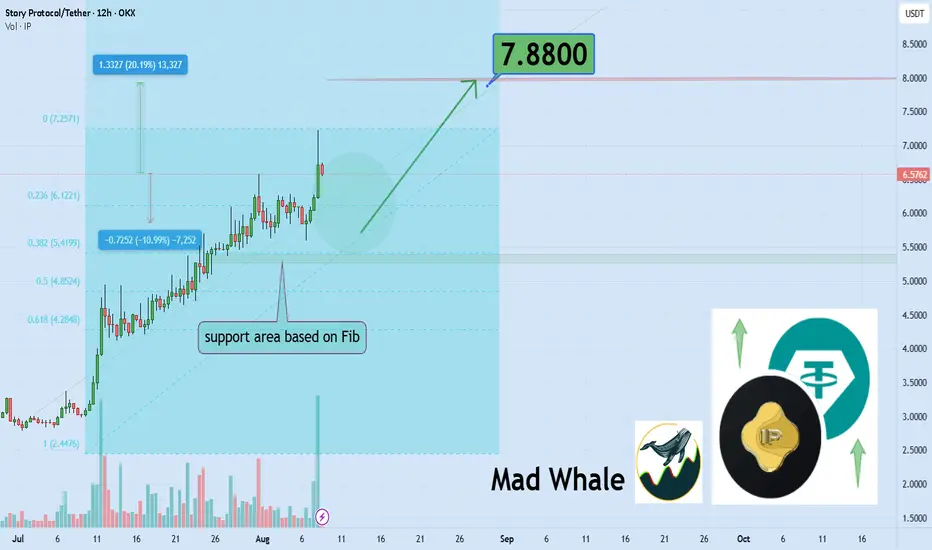
Story Protocol Holds Strong, Targeting Explosive 20% Rally to $7Hello✌️
Let’s analyze Story Protocol’s price action both technically and fundamentally 📈.
🔍Fundamental analysis:
Story is working on tokenizing real-world data for AI, teaming up with big projects to tap into the $80T IP market. But on-chain activity is still low, so hype could fade if adoption i
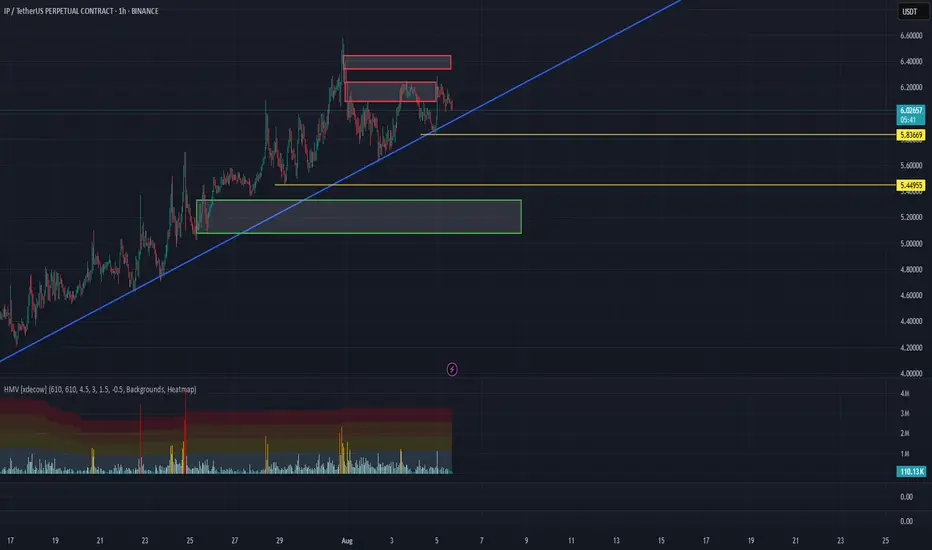
IP/USDT Analysis – High Probability of a Trendline Breakout
Currently, volatility is decreasing. At the same time, a clear imbalance is observed in cumulative delta — delta is dropping while price continues to rise. This could indicate hidden weakness from the buyer’s side. A sharp breakout of the descending trendline is likely in the near future, potentia
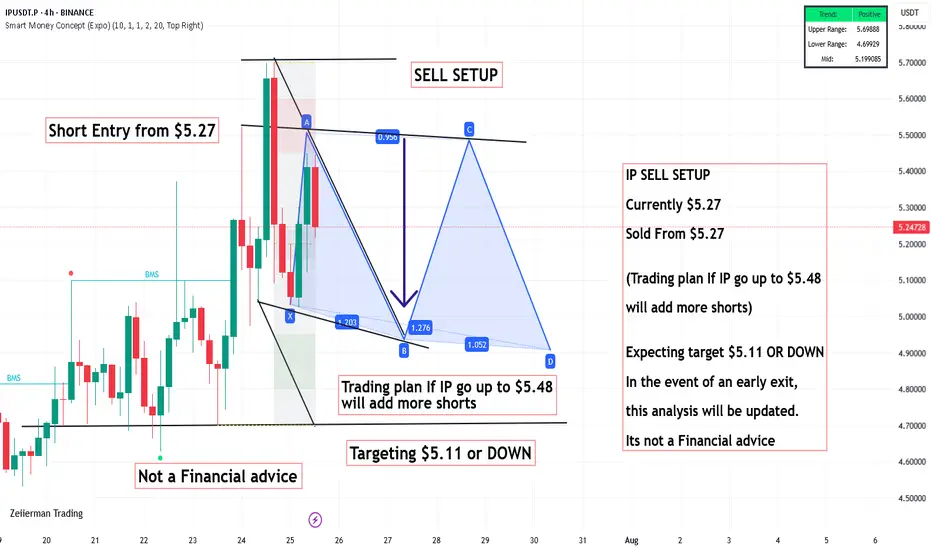
IP SELL SETUP ,Sold From $5.27IP SELL SETUP
Currently $5.27
Sold From $5.27
(Trading plan If IP go up to $5.48
will add more shorts)
Expecting target $5.11 OR DOWN
In the event of an early exit,
this analysis will be updated.
Its not a Financial advice
IP/USDT - Continuation P/USDT has formed a solid base support in the $2.60–$2.80 zone over the 20 days, showing strong accumulation. Recently, it broke out of the key $3.30 resistance with significant buying pressure and volume, signaling bullish intent. More importantly, it also broke above a 140 day descending trendlin
IP/USDTKey Level Zone: 2.8900 - 2.9400
LMT v2.0 detected.
The setup looks promising—price previously trended upward with rising volume and momentum, then retested this zone cleanly. This presents an excellent reward-to-risk opportunity if momentum continues to align.
Introducing LMT (Levels & Momentum Tr

See all ideas
Summarizing what the indicators are suggesting.
Oscillators
Neutral
SellBuy
Strong sellStrong buy
Strong sellSellNeutralBuyStrong buy
Oscillators
Neutral
SellBuy
Strong sellStrong buy
Strong sellSellNeutralBuyStrong buy
Summary
Neutral
SellBuy
Strong sellStrong buy
Strong sellSellNeutralBuyStrong buy
Summary
Neutral
SellBuy
Strong sellStrong buy
Strong sellSellNeutralBuyStrong buy
Summary
Neutral
SellBuy
Strong sellStrong buy
Strong sellSellNeutralBuyStrong buy
Moving Averages
Neutral
SellBuy
Strong sellStrong buy
Strong sellSellNeutralBuyStrong buy
Moving Averages
Neutral
SellBuy
Strong sellStrong buy
Strong sellSellNeutralBuyStrong buy