
KAVA/USDT - Bullish Breakout Set to Accelerate Gains!🚀 Trade Setup Details:
🕯 #KAVA/USDT 🔼 Buy | Long 🔼
⌛️ TimeFrame: 1D
--------------------
🛡 Risk Management (Example):
🛡 Based on $1000 Balance
🛡 Loss-Limit: 1% (Conservative)
🛡 Then Your Signal Margin: $30.81
--------------------
☄️ En1: 0.4285 (Amount: $3.08)
☄️ En2: 0.3757 (Amount: $10.78)
☄️ En

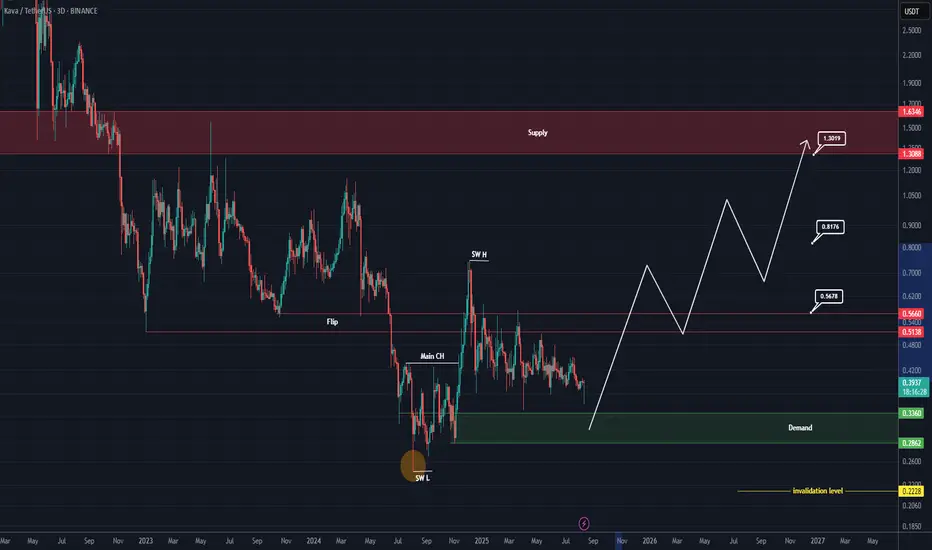
KAVA is ready to take off (3D)After a strong bullish wave, KAVA has entered a time correction phase. Despite the altcoin market being very volatile, KAVA has not experienced a significant price correction and is approaching a strong support zone. It is expected that upon touching this area, a bullish move will form in higher tim
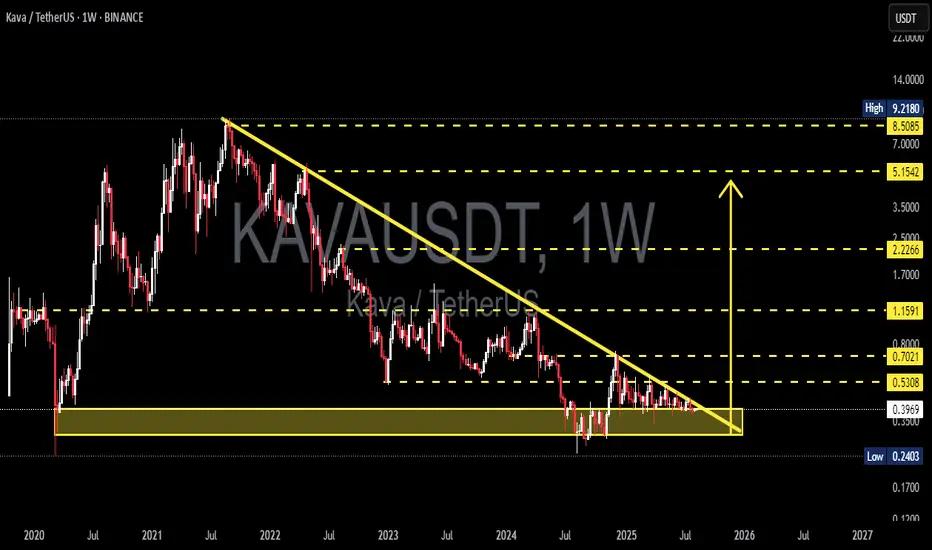
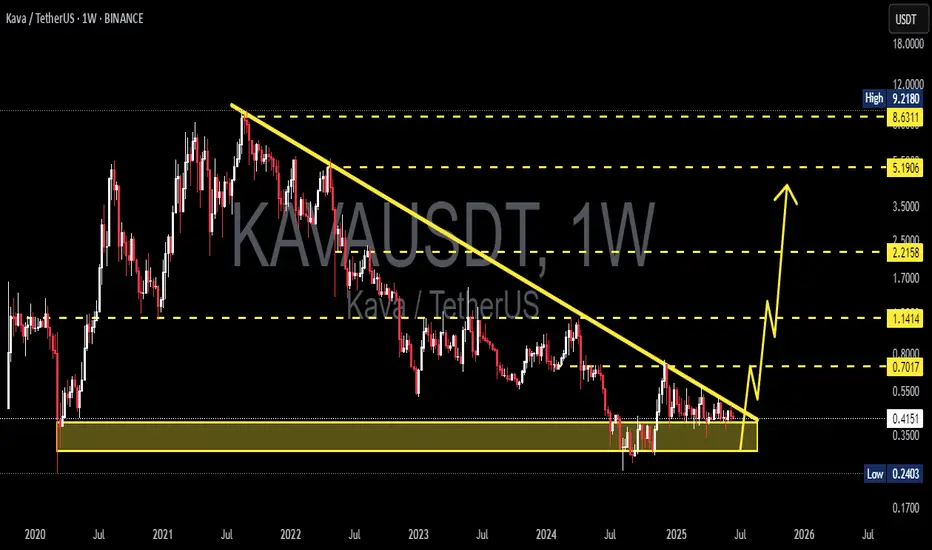
KAVA at Make-or-Break Point — Breakout or Breakdown Ahead?KAVA price is forming a descending triangle on the weekly timeframe, with a long-term downtrend resistance line from the 2021 peak converging toward a horizontal support zone (~0.24–0.40). Price action is compressing near the apex — suggesting that a strong move (either breakout or breakdown) could
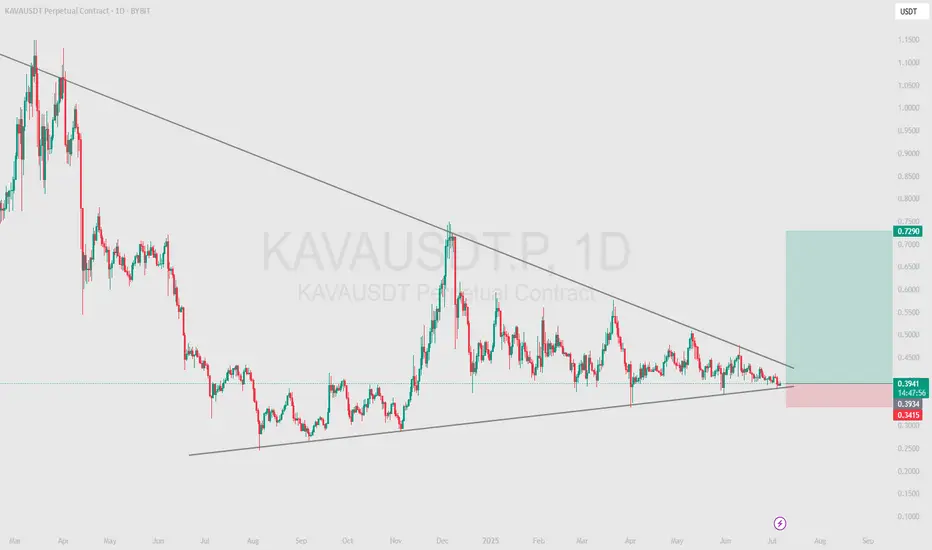
baby baby KAVAlook how lovely this triangle is! I longed the dip near the trendline! lets see whats gonna happen! big gainssssss

Kava: 5 Strong Bullish Signals, Cup & Handle, High Volume & MoreThe cup & handle pattern doesn't work at resistance. You cannot use this pattern in any meaningful way at the top of a rising trend. For the C&H to be valid, it needs to happen at the end of a downtrend, near the market bottom because this is a bullish reversal pattern.
Here we have KAVAUSDT weekly

$KAVA breaking out of its defending phase to 4$ I would like to notice as the market picks up for Monday I think this is a great risk to take here.
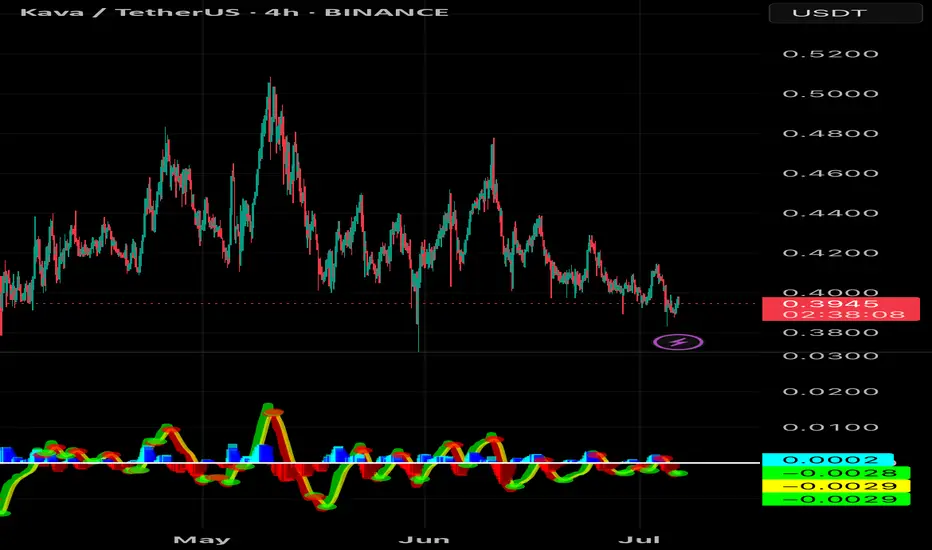
KAVA LONG on a .039 - .038 entry leading into a breakout above its previous drawback.
4hr chart looks depressing but MACD shows sign of health. Holding a 20x leverage position here and hoping we c
KAVA - We are expecting the rocket at 80%The KAVAUSDT chart shows a clear downward channel, indicating a bearish trend. However, the price is currently consolidating around the middle of the channel, creating uncertainty about the immediate direction.
Recommended signal: wait for confirmation of a breakout above the upper boundary for lon
Is KAVA/USDT About to Explode? Major Breakout Incoming!Technical Analysis (Timeframe: 1W - Weekly)
1. Descending Triangle Breakout Setup
KAVA has been in a prolonged downtrend since 2021, forming a large descending triangle pattern. Currently, the price is nearing the apex of this formation, signaling a potential breakout in the near term.
2. Strong A

KAVAUSDT 1W AnalysisKAVA ~ 1W Analysis
#KAVA This is the lowest support block for now. Buy from here if you still have faith in this coin with a short term target of at least 15%++
See all ideas
Summarizing what the indicators are suggesting.
Oscillators
Neutral
SellBuy
Strong sellStrong buy
Strong sellSellNeutralBuyStrong buy
Oscillators
Neutral
SellBuy
Strong sellStrong buy
Strong sellSellNeutralBuyStrong buy
Summary
Neutral
SellBuy
Strong sellStrong buy
Strong sellSellNeutralBuyStrong buy
Summary
Neutral
SellBuy
Strong sellStrong buy
Strong sellSellNeutralBuyStrong buy
Summary
Neutral
SellBuy
Strong sellStrong buy
Strong sellSellNeutralBuyStrong buy
Moving Averages
Neutral
SellBuy
Strong sellStrong buy
Strong sellSellNeutralBuyStrong buy
Moving Averages
Neutral
SellBuy
Strong sellStrong buy
Strong sellSellNeutralBuyStrong buy
Displays a symbol's price movements over previous years to identify recurring trends.