Kava. io forming a bullish BAT for upto 34.50% pumpHi dear friends, hope you are well and welcome to the new trade setup of Kava. io (KAVA) token with US Dollar pair.
Our last trade for KAVA was as below:
Now on a 4-hour time frame, KAVA is about to complete a bullish BAT move for another price reversal.
Note: Above idea is for educational purpose only. It is advised to diversify and strictly follow the stop loss, and don't get stuck with trade.
Trade ideas

KAVA turns Bearish as HnS pattern formsReached $1.26...not exactly the 1.30 I was hoping for, but now a head and shoulders is forming and that is a tell tale sign of a bearish reversal. Expect this to trade down to the lower support of the wedge that is forming. Likely to go below 0.80 cents before changing direction back up.

a good TRthe price is top off TR and hunt the Lq up the Tr we can get a short position when BTC start to correction
do you agree with me?

KAVA going upKAVA completed cup and handle pattern in 4H timeframe and is about to go up. Target of 1.5 is achievable in 3-4 days

KAVA/USDT Bullish Pattern! Hey traders 👋
Another one that caught our attention is KAVA coin with a nice potential for a bullish movement here. We see a nice Cup&Handle pattern which seems to be ready for a breakout! Looking here for that last confirmation of breaking from that last resistance and we good to go!
If you like ideas provided by our team you can show us your support by liking and commenting.
Yours Sincerely,
Swallow Team
Disclamer:
We are not financial advisors. The content that we share on this website are for educational purposes and are our own personal opinions.

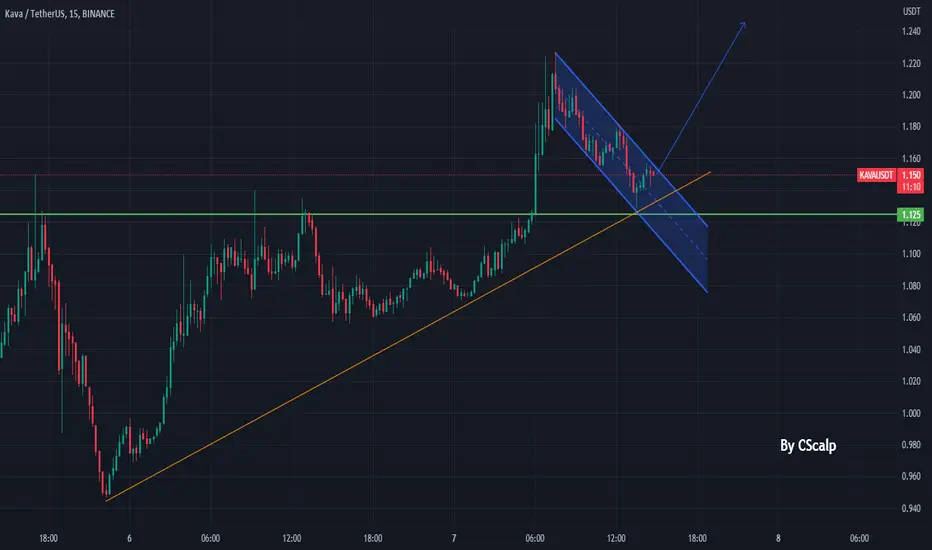
kava going to break the trendlinehello guys
The resistance of the trend line has weakened. It is possible to break the trend line. If the trend line breaks, the possibility of the channel breaking is also very high. You can get good profit from this position
The information provided on this Page does not constitute investment advice, financial advice, trading advice, or any other sort of advice and you should not treat any of the website's content as such. this page does not recommend that any cryptocurrency should be bought, sold, or held by you. Do conduct your own due diligence and consult your financial advisor before making any investment decisio

KAVAUSD ❕ volumes declinedTrading volumes declined on the correction.
The price broke through 50EMA at 30m TF.
The RSI chart is moving in a bullish zone (4H, 1H and 30m TFs)
I believe the asset can bounce if it holds the current support level.
kavausdtkava time frame 1D
thiiiiiiiiiiiiiiiiiiiiiiiiis issssssssssssssssssssssssssssssssssssssssss kavaaaaaaaaaaaaaaaaaa futuuuuuuuuuureeeeeeeeeeeee

3 times a charm...KAVA primed to hit $1.30 rangeAn ascending triangle in a downtrend is usually a bearish continuation, however, with KAVA having recently hit above $1.20 a few times, and the recent dip SEC induced... I am predicting this to be a reversal.

#kava long RR 9Saturday and Sunday can remain still or with these movements that we are having.
it is a low risk
kava can be good.

kavausdtupdateeeeeeeeeeeeeeeeeeeeeeeeeeeeeeeeeeeeeeeeeeeee
kavaaaaaaaaaaaaaaaaaaaaaaaaaaaaausddddddddddddddddddddddddt

kavausdtkavaaaaaaaaaaaaaaaaaaaaaaaaaaaaaaaaaaaaaaaaausdddddddddddddddddddddddddddddddddttttttttttttttttttttttttttttttttt
loooooooooooooooooooong

kavaIf the green range is touched, we will expect to move towards higher numbers. And if the channel breaks, I can examine the green box and the lower green line.


kavaI expect an upward movement and a correction in the green lines to buy spots with a red stop loss

SPA on 30M chart kavausdtlooking for spa just to wait reached previous high and wait for rejected exact level, than you will short and target LL..

KAVA bullish momentum kava has been rising since the dropoff it came back to a daily support that was valid only 30 days ago but since then igt rose 90% to 1.50s and came back down to 1.00 before the market crash. So IMO Kava is one to watch

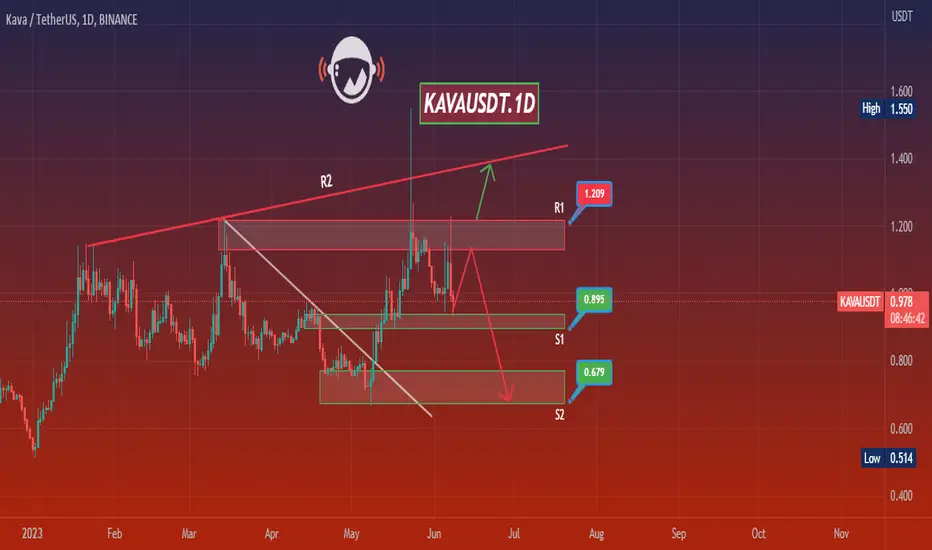
KAVAUSDT.1DMars Signals Team wishes you high profits*
This is a daily time frame analysis for KAVAUSDT.1D
We are in the daily time frame. As you can see, the price has hit our first support area and we expect the price to support and start moving towards our first resistance line. But if it cannot support the price and stabilizes below our support line, we expect further decline.
Warning: This is just a suggestion and we do not guarantee profits. We advise you to analyze the chart before opening any positions.
Take care
buy kava here easy profit 3 bottoms around buy kava here 3 bottoms break out confirmed bullish momentum on all time frame i expect all targets in less than aweek .... if you get profit please support me with my address

KAVA with possible hidden bullish divergenceKAVA 2hr time frame 3x - 5x Leverage ( also available on regular spot trade )
with possible hidden bullish divergence ( price action needs to pivot )
Plan A ( LONG ) tp 1.0524 / 1.1071 / 1.1844
Plan B ( SHORT ) tp 0.9089 / 0.8520 / 0.8133
Stop Loss ( sl ) about 3% - 5 % from entry
Not Financial Advice
This is for Entertainment Only

KAVA: Resistance BreakoutKava (KAVA) technical analysis:
Trade setup : Kava has traded completely against the market in recent week. This is bullish as it shows that there’s demand for the asset regardless of the overall bearish market sentiment. Price broke above 200-day moving average and $1.00 resistance which are signs of Uptrend. It retested those levels and bounced back up, which should confirm the bullish breakout. Upside potential to $1.40.
Trend : Uptrend across all time horizons (Short- Medium- and Long-Term).
Momentum is Mixed as MACD Line is below MACD Signal Line (Bearish) but RSI > 55 (Bullish). MACD Histogram bars are rising, which suggests that momentum could be nearing another upswing.
Support and Resistance : Nearest Support Zone is $1.00 (previous resistance), then $0.76. The nearest Resistance Zone is $1.15, which it broke, then $1.40.

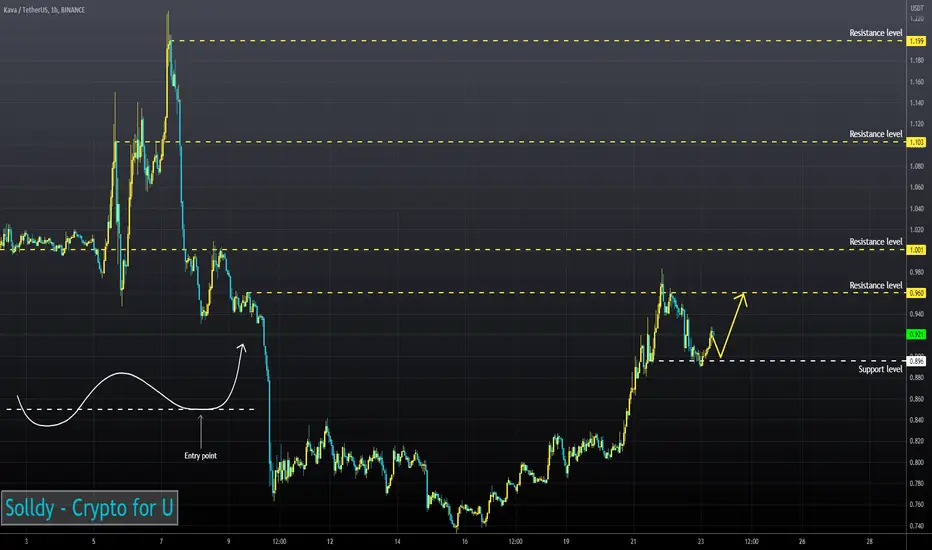
KAVA prepair for longAfter updating the last maximum, the coin went to a local correction, a downward wedge shape is formed, which serves as a trend continuation figure, I expect at the moment to exit up from the figure, with a retest and consolidation, and I will enter a long position.
The volume is also increased for purchase, which serves as confirmation that the trend will continue.
KAVA LOOKS BULLISHHi, dear traders. how are you ? Today we have a viewpoint to BUY/LONG the KAVA symbol.
For risk management, please don't forget stop loss and capital management
When we reach the first target, save some profit and then change the stop to entry
Comment if you have any questions
Thank You
