KAVAUSDTHey traders, here is the analysi.
If you guys like my analysis please hit like👍 and follow.
Thanks.
DISCLAIMER- This is not financial advice.
SMART MONEY CONCEPT
Trade ideas

Kava short positionIn a strong bear market day, KAVA goes long without any fandumental news. As you see it is in strong resistance point in its chanel. In my oponion this is best position for SHORT.
First R/A ---> 0.836
2nd R/A ---> 0.771
GOOD LUCK

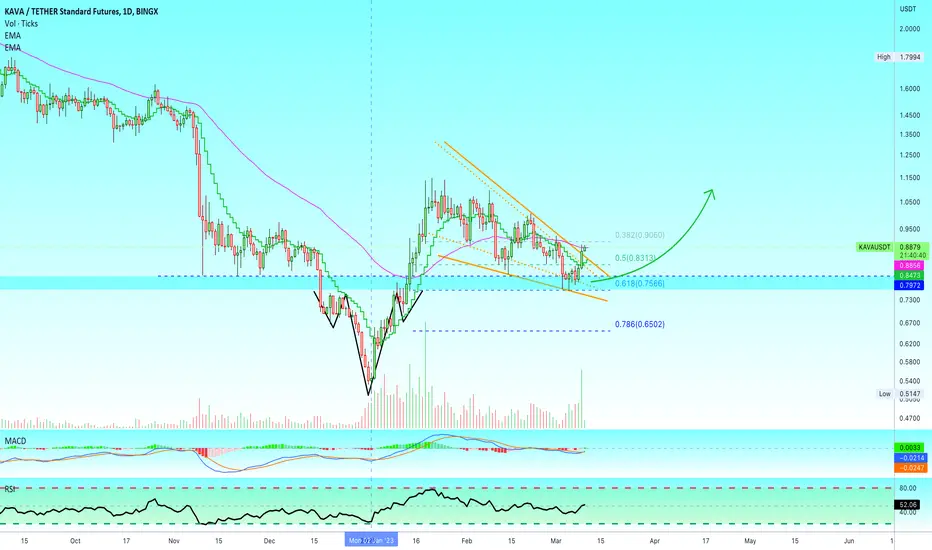
✴️ Kava Goes First Correction End Confirmed? Marketwide AnalysisKAVAUSDT hit a low in early January, like most of the Cryptocurrency market.
Many pairs hit their low in late December, just a few days before January which technically counts as the same.
From this low we get a strong bullish wave, January 2023, this is also true for most of the Cryptocurrency market.
After this wave we get a correction and here the correction hit bottom 3-5 March. This is also a theme that is repeating across the market.
Now, the important part.
KAVAUSDT is recovering, correction ends.
This is confirmed as its price moves above the moving averages including EMA50 and the really high volume yesterday.
If KAVA dropped with the rest of the market, recovered with the rest of the market and went into a correction together with the rest of the market, it will also produce the next leg up with the rest of the market.
That's the conclusion.
KAVAUSDT is already going bullish, moving first compared to the pairs that everybody is already looking at.
This is normal, the market movers will move first those that are least active/bought.
While everybody is always looking at Bitcoin, Shiba Inu, Cardano and the rest. If Bitcoin starts growing it would reveal that the correction is over and everybody would rush to buy and that's not something that is appealing to the whales.
And thus they move the least popular ones first... But what one does the rest follows.
If KAVAUSDT recovers, we know what the rest of the market will experience as well. This includes Bitcoin which looks shaky right now... Patience and a plan would remove all doubt while you wait.
Namaste.
Go KAVA! 1.14 and Beyond!We can see that KAVA broke the white trendline and 50 EMA Daily
This scenario may bting KAVA to 1.14 USD
My analysis will be invalid if KAVA dumps to below 0.737 USD

KAVA confirm bullishKAVAUSD reach to the base line according to price action principle and the reverse head and shoulder already formed the price is completely bullish in my opinion maybe you will see the price above 2 rupees

KAVA LOOKS BULLISHHi, dear traders. how are you ? Today we have a viewpoint to BUY/LONG the KAVA symbol.
For risk management, please don't forget stop loss and capital management
When we reach the first target, save some profit and then change the stop to entry
Comment if you have any questions
Thank You

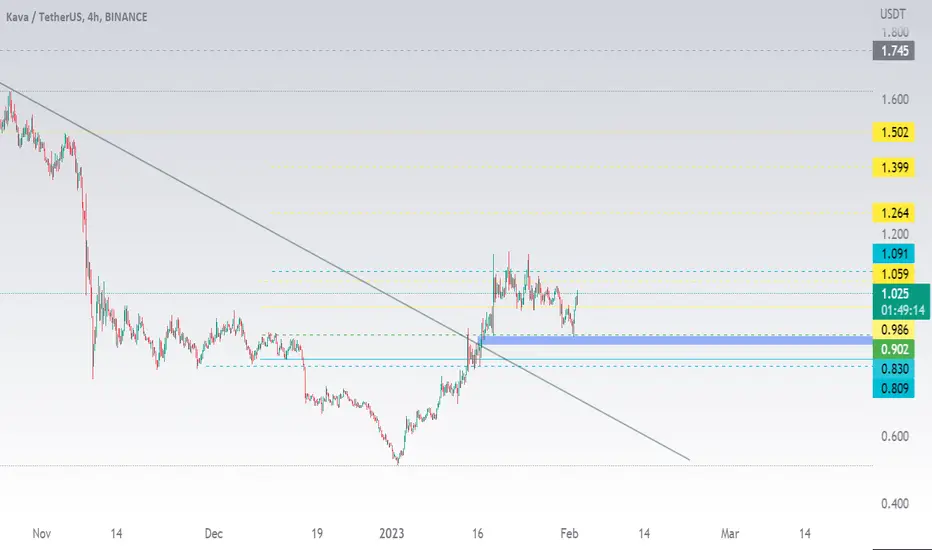
RLinda ! KAVAUSDT-> Hidden Confidence. Chance for a breakdownWhile the cryptocurrency market is falling, KAVAUSDT looks quite confident and even has a chance to break through the resistance zone
Rare moments, when in times of the main decrease such coins stand out, which go against the market - obviously, we can assume about a separate interest from strong investors. Someone is interested, has accumulated the necessary liquidity within the consolidation and now they need to snatch the jackpot.
At the resistance of the descending wedge a pre-breakdown consolidation is formed and the moment of the resistance breakout. If the price consolidates above the line, there is a high probability of reaching the resistance at 1.140, which is, presumably, the base of the pattern H&S.
I expect a breakout of the resistance and formation of a bullish counter-trend impulse. I pursue the following targets: 1.140, 1.405, 1.600
Regards R. Linda!

KAVAUSDTThese two scenarios are possible for the KAVA . The start of an upward wave or corrective wave c from B, then the continuation of the price correction

KAVE on the move Hello Dear Traders,
According to technical analysis, KAVA monthly RSI has been showing movement, with the monthly cycle completing to P9. Currently, the weekly Pivot is at 0.805 (0.8037 KAVA/USDT pep) and is above the Pivot.
If the candle opens above the orange dotted line with good volume,
the incoming target is expected to be towards the 1.833 area ✔️
The 4D TF cycle is up, with a target as 1.916 area.✔️
On Monday, October 17, 2022, there was a bullish OB targeting 2.111 ✔️ but the price flipped bearish. If we are going towards the 1.833 area, in my opinion, the price action would trigger this OB as well.
Meanwhile, in the short term, the 3-hour timeframe is showing an incoming target of 9680. 🤓
P.S I'm not certain about the patterns as shown, 🤑
Lets see how price action and time unfolds to determine the direction of the market.
Not a Financial Advice, Always DYOR ✔️
Trade well my Friends, stay SAFU (Secure Asset Fund for Users), and be patient while the market moves. Let that Sink in.

Kava Buying areaBuy some Kava here, kava is at good support level....Buy at support and sell at resistance simple as that...nothing complicated.

KAVA start of wave 3 - longKAVA start of wave 3 - long
KAVA - Long rough Idea
This is an update for KAVA -
This is my expected price action for the coming days. I WILL FOLLOW FOR THE NEXT BIG POTENTIAL PUMP.
Let's see how it plays out,
Thanks for your comments.
Always use stop loss/Risk Management.

support level will be 0.93 to 0.91.The kava coin is positioned within a descending channel within the four-hour time frame. And if you take a look you will see that it is trying to break out the descending channel for the seventh time since last January 18th. It is currently positioned within support which is approximately 0.97. If the counter is able to breakout within this four hour time frame then we can definitely see 1.08 to 1.148. Another thing is the RSI indicator. This indicator shows that every time this coin has taken the support of 70, it has taken a downward correction, so our next support level will be 0.93 to 0.91.

Kava getting ready For another bounce forming descending Channel In h4 Timeframe
Incase Of breakout Expecting another Bulish Impulse
Incase Of breakout expecting 35 to 40% bulish Move

KAVA is going to the bottom! Short it!AI forecasts going to $0,5.
According to the forecast you can short KAVA.
Have a nice day!

#KAVA - thoughts out loud #1Good afternoon , dear colleagues!
I'm happy to welcome everyone who wants to get acquainted with my vision of the current situation on this instrument.
What are your thoughts on this asset?
Dear colleagues, I sincerely thank you all for your attention and wish you all success!
And remember one thing:
"sometimes you win , sometimes you learn ".

KAVAUSDT is inside the bullflagKAVA recently bounced from its monthly support at the 0.66 dollar level, which is indicated by a purple line.
The market is currently forming a bull flag pattern below the daily resistance.
Traders are eagerly anticipating a breakout from this pattern with high volume, in accordance with Plancton's Rules.
This could signal further upward movement for the asset.
–––––
Follow the Shrimp 🦐
Keep in mind.
🟣 Purple structure -> Monthly structure.
🔴 Red structure -> Weekly structure.
🔵 Blue structure -> Daily structure.
🟡 Yellow structure -> 4h structure.
⚫️ Black structure -> <= 1h structure.
Follow the Shrimp 🦐

Kava/usdt LongKava Broke out frim a triangle and retested it very well.
Targets and stop loss is mentioned on the chart lets crush it.

Kavausdt Forming Bulish flag Seems Like Kave Getting ready for Another Bulish Impulse
Forming Bulish Flag In h4 timeframe
Incase Of breakout Expecting Another 30 to 35% bulish Move

Kava nearing price agreement and is ready to move soonI'm noting the triangle on kava demonstrating towards 1.02.
Watch for dropping volatility and volume, then swings either way, and you'll see it move likely from there.
This is probably long but who knows.
Good luck.

#KAVAUSDT 4H Chart
Price left an area of equal highs where it got rejected from. MACD is showing bullish weakness, RSI and EMAs are neutral. I expect price to retest the support at $0.99 before moving up again towards the resistance at $1.12.


KAVA S&R in short time>>>>>>>>>Hello EveryOne
I Have Tried My Best to Bring the best Possible outcome in this Chart.
KAVA break out from long term down trend line's,
and completed pullback from support area.
dou to the more support market We can set buy position in daily correction.
Short term Support & resistance's marked on the chart.please buy in correction and set your stoploss.
SPOT trade.
Market can be so tuff if we don't becareful.
It's just an analyze,
Not a financial advise.
PLZ DYOR
With hopping success>>>>>>>>>
Alt Coin Season high potentials kavaGreat montly close, with some pullbacks (bottom building in progress and possible) and we can see a good R:R opportunity to the target price with 233% profit.
Vailid unitil TA failed.
