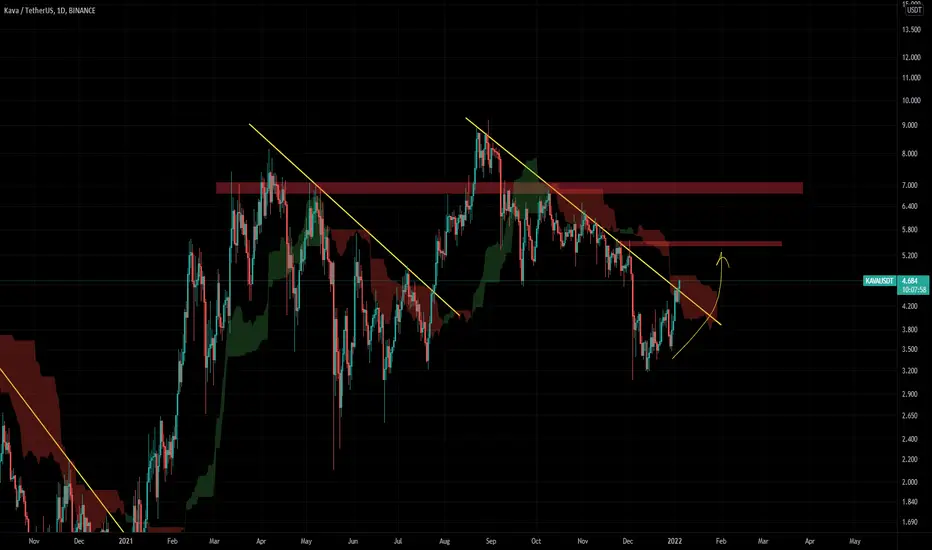
KAVAUSDT Analysis (HUGE RISK/REWARD 1 to 10)Hello friends.
Please support my work by clicking the LIKE button(If you liked).Thank you!
Everything on the chart.
Entry: market and lower
TP: 4.5 - 5.5 - 7
after first target reached move ur stop to breakeven
Stop: ~3 (depending of ur risk). ALWAYS follow ur RM .
Risk/Reward 1 to 10
risk is justified
Good luck everyone!
Follow me on TRADINGView, if you don't want to miss my next analysis or signals.
It's not financial advice.
Dont Forget, always make your own research before to trade my ideas!
Open to any questions and suggestions.
Trade ideas

KAVAUSDT - SHORTBased on technical factors there is a short position in KAVAUSDT Kava
KAVAUSDT Kava
Score 2️⃣
🔴Short Now or set on Key Level 4.330
🟢Target 1 4.030
🟢Target 2 3.730
❌Stop loss 4.450
#K_Level
Every signal has a score from 1 to 5, so accordingly adjust your risk for each signal. The signals with the score of 5 are the most probable ones.
Please support our activity with your likes and comments.


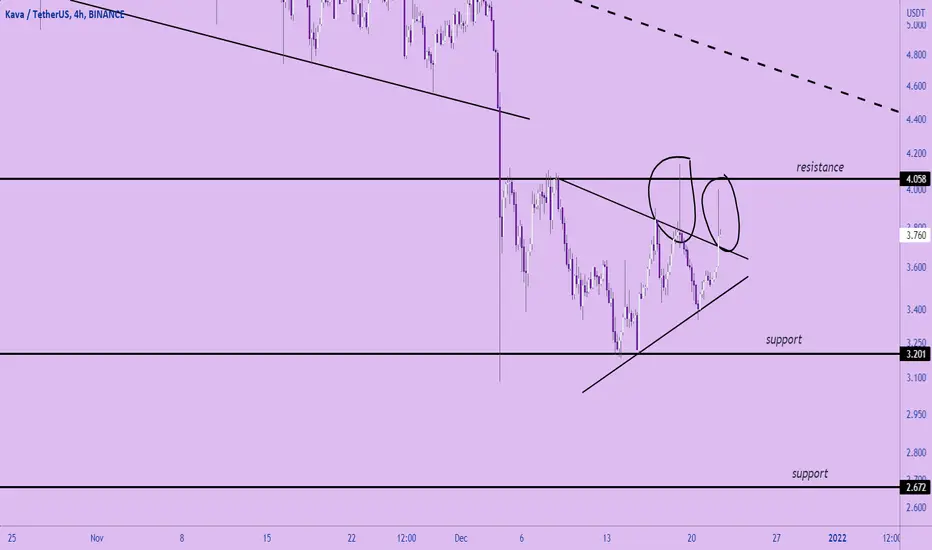
KAVA/USDT 1D TRADE SETUPWelcome to this quick Update, everyone.
If you are reading my updates for the first time do follow me to get more complex charts in a very simplified way.
I also post altcoin setups on Spot, Margin, and Futures.
I have tried my best to bring the best possible outcome in this chart.
KAVA/USDT broke out of descending channel now, coming back to retest the channel.o
Entry: $4.67to $4.40 but don't yous high leverage max up to5x only.
Targets: 60% to 90%
Stop Loss: $ 4
What's your thought on this?
Do hit the like button if you like this update and share your views in the comment section.
Thank you
#PEACE

Crypto KAVA breaks above resistance trend lineKAVA has broken above the resistance trend which has been holding it down since September 2021.
After dipping lower from September thru December, support was found just below the 61.8% retracement level. Since then, KAVA has been rallying and has eventually broken above this resistance trend line.
This recent break opens the door for higher pricing as the break indicates the mood of the market is changing.
KAVA may go on to test $6.50 and possibly $9.
So long as KAVA holds above $4.25 keep your sights set on higher levels.
Good luck!

KAVA long setup ( short term )Kava breakout, just use a decent stoploss and enjoy the ride. dont try to hodl till dear life. sell and take profits
wagmi
KAVA | Breaking out of Descending Channel..!!
#KAVA (Update)
Pay Attention to KAVA..
In Daily timeframe Chart, Breaking out of Descending Channel After Long consolidation..
Volume has been Increasing..
Expecting +80% Bullish Wave so don't miss the Ride..
Please like the idea for Support & Subscribe for More ideas like this and share your ideas and charts in Comments Section..!!
Thanks for Your Love & Support..!!


KAVA Token Is Going To Set A New All Time HighHi dear friends, hope you are well, and welcome to the new update on Kava. io (KAVA) token.
Big Broadening wedge:
On a weekly time frame, the priceline of KAVA is bounced from the support of a huge broadening wedge pattern. Stochastic has turned bullish from the oversold zone. There is also a hidden bullish divergence as the priceline is forming higher lows and stochastic is setting higher lows.
Daily channel:
On a daily time frame, KAVA has reached the resistance of a down channel, and in case of breakout, it can start a big move at least to the resistance of the big broadening wedge that is formed on the weekly chart to set a new all-time high.
Note: Above idea is for educational purpose only. It is advised to diversify and strictly follow the stop loss, and don't get stuck with trade

KAVAUSDT Daily TA : 01.01.22 : $KAVAAll supports and resistances are marked on the chart. As we can see, the price is in an important range and recommended to keep an eye on it ...
Follow our other analysis & Feel free to ask any questions you have, we are here to help.
⚠️ This Analysis will be updated ...
👤 Arman Shaban : @ArmanShabanTrading
📅 01 . 01 .2022
⚠️(DYOR)
❤️ If you apperciate my work , Please like and comment , It Keeps me motivated to do better ❤️

KAVA looking scary this time!!!$4.5 is a very happening figure for KAVA!
Till the time we stay below it, sell on rise can be initiated!
Targets are mentioned on the presentation!

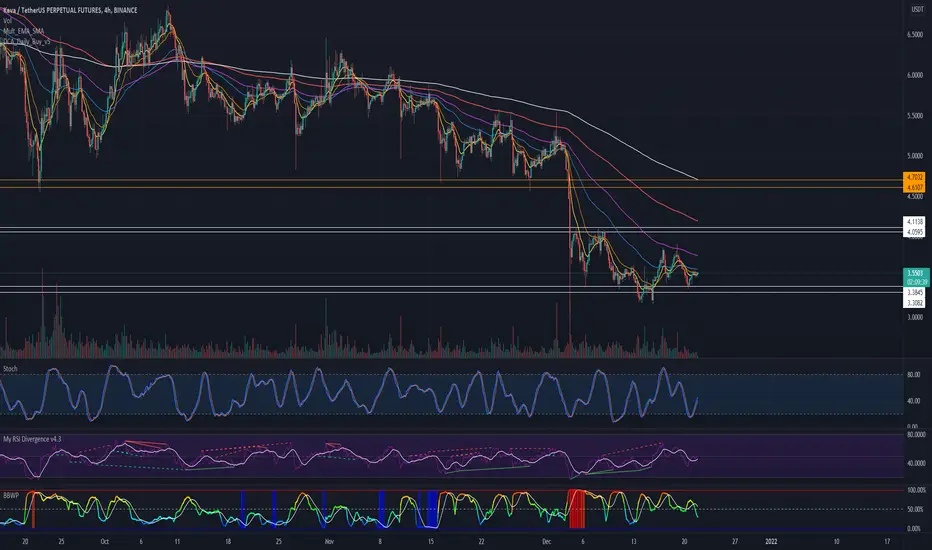
🆓Kava (KAVA) Jan-1 #KAVA $KAVA
.
📈RED PLAN
♻️Condition : If 1-Day closes ABOVE 3.5$ zone
🔴Buy : 3.8 - 3.5
🔴Sell : 5 - 6 - 7
📈BLUE PLAN
♻️Condition : If 1-Day closes BELOW 3.5$ zone
🔵Sell : 3.5
🔵Buy : 3.2 - 2.8
❓Details
🚫Stoploss for Long : 10%
🚫Stoploss for Short : 5%
📈Red Arrow : Main Direction as RED PLAN
📉Blue Arrow : Back-Up Direction as BLUE PLAN
🟩Green zone : Support zone as BUY section
🟥Red zone : Resistance zone as SELL section

KAVA/USDT Buy step by step in support. Or if the market does not fall, buy after the resistance breaks.
Like and comment please❤

longI think in the range are the best places to returneth and breaking the range and continue the process is very important. This analysis is only for your better perspective

Kava.io (KAVA) formed bullish Gartley for upto 216% massive moveHi dear friends, hope you are well and welcome to the new trade setup of Kava. io (KAVA) token
Previously we had a nice trade of KAVA:
Now on a weekly time frame chart, KAVA has formed bullish Garltey move. There is also 100 simple moving average support in buying zone.

KAVAUSDTPREP LONG FOR 20% PROFITbroken bearish trendline in 4h
and pullback to that
and broken strong resistance
good luck.
i have an a position on kava .

KAVA strange shadowsWhat are the two shadows on the latest tops talking about? Someone pushed the price up several times, but the bots realized that it was too expensive and started selling, which means that the price is not ready to go higher.
KAVA usdt - set to pump back up to $5 areaKava defi platform saw considerable loss on the mid December dump.
Expect to see a play to the high $4 - low $5 range over the next two weeks.

Kava bullish like LinkHi
Here another one similar to Link
Stochastic crossed up from a low point : 15 ,and is moving up above 20
RSI look like bullish to, near the 50 zone
I think this one can move up to 4.08$ ~
The 0.5 fib level from middle top (at 6.85$) to current low at 3.19$ is at 4.9$
Let see what will append.
Kava Bullish potential Kava broke down from a bullish channel.. this is a bear trap.. strong support @ 3.5 to 3.2.. bullish confirmation once price close inside to 4.618.. we can easily see 7.8 to $8 Levels

KAVA Token target buy/sell prices and possible trendlinesThe recent, larger sell-off on large cap crypto catalyzed by news events influences sell-offs on smaller cryptocurrencies, including the Cosmos network DeFi derivative, KAVA. The appeal KAVA holds to me personally is its high yield API (20% annually, distributed twice a week). This combined with its beautifully abundant swings and dedicated long term staked investors makes for plenty of profitable opportunities.
With a red line I highlight what I perceive as the recent bear trend (which more or less is a bear cliff as of the ATH which was defined in September, 2021 as 9.218). This sell-off was met with resistance a few days ago at the support price of 3.081, and one of the more large scale bull trend (Bull Trend 1, in blue). A break above this short term bear trend may validate my designated bull trend, implying a continuation of KAVA's macro bullish directionality with the possibility of another eventual retest of the ATH. A break below the bull trend, and continuation of the bear trend may be met with demand with another candidate bull trend which I have marked with a green line on the chart (Bull Trend 2).
In either case, at the moment, I plan to hold and continue purchasing KAVA, picking more up at my designated supply/demand prices, and taking profit at my designated supply/resistance price targets.
My buy targets for KAVA are:
$3.081
$2.109
$1.123
Sell targets are:
$5.534
$8.157
$9.218
The price targets and trends I provide are my own anecdotal opinions and I observe them making room for error.


KAVAUSDT AnalysisHello friends.
Please support my work by clicking the LIKE button(If you liked).Thank you!
Everything on the chart.
open pos: market and lower
target: 6.2 - 8 - 9.3
after first target reached move ur stop to breakeven
stop: ~under 4.4 (depending of ur risk). ALWAYS follow ur RM .
risk/reward 1 to 6
risk is justified
Good luck everyone!
Follow me on TRADINGView, if you don't want to miss my next analysis or signals.
It's not financial advice.
Dont Forget, always make your own research before to trade my ideas!
Open to your questions or suggestions.
