LDO/USDT –> Double Top Formation Signals Bearish PressureHello guys!
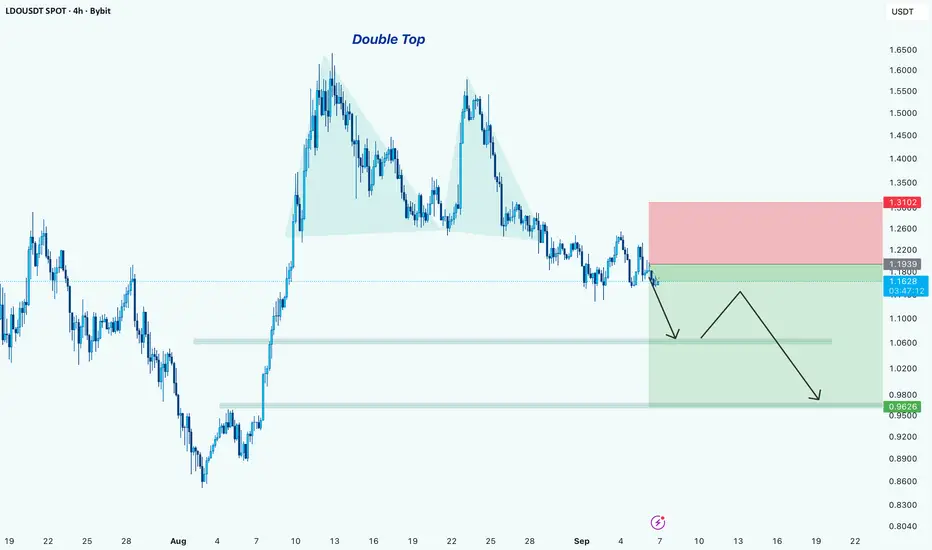
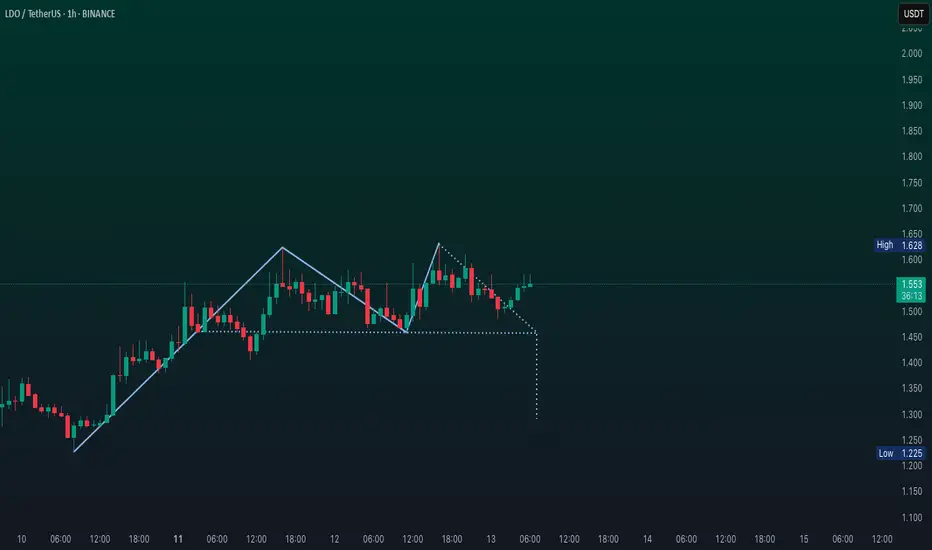
Lido DAO (LDO) has printed a clear double top pattern on the 4H chart.
After failing to break above the $1.65 area twice, price is now trading below the neckline zone and struggling to regain bullish strength.
If sellers remain in control, the next major support lies around $1.05 – $1.07 , followed by a deeper downside target near $0.95 – $0.98 . These levels align with previous demand zones and could act as take-profit areas for shorts.
On the flip side, invalidation comes if price reclaims $1.31 – $1.32 (stop zone), which would weaken the double top structure and potentially reopen bullish momentum.
For now, the structure favors bears, and continuation lower seems likely unless bulls step in with strong volume.
LDOUST trade ideas
TradeCityPro | LDOUSDT The Best Spot Entry Point👋 Welcome to TradeCityPro Channel!
Let's move on to the LDO analysis, which has the most Ethereum possible in this staking network, and its job is to form nodes and structure transactions, and it has solved the problem of having 32 Ethereum to be a validator.
🌐 Overview of Bitcoin
Before starting the analysis, let me remind you again that we moved the Bitcoin analysis section out of this part and made it a separate daily analysis as per your request, so we can discuss Bitcoin’s condition in more detail and analyze its charts and dominance separately.
This is the general Bitcoin dominance analysis that we promised to cover separately and analyze in longer time frames:
🔗
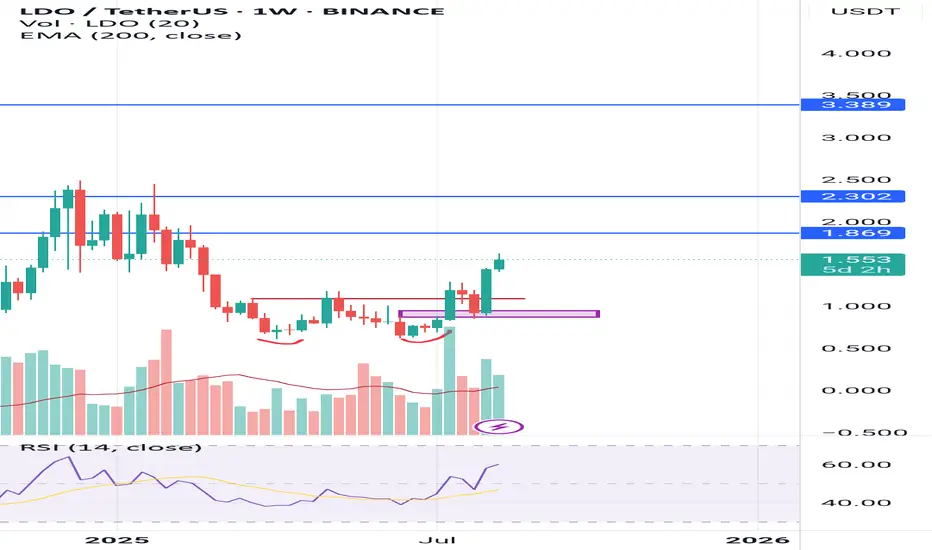
📊 Weekly Timeframe
After the previous decline, LDO reached the important weekly support at 0.647 and showed a reaction.
With buyer presence, the price moved upward and is now sitting right under a resistance that once acted as a strong support. After breaking that level in the past, the price made a sharp move which makes this an important zone to watch.
🔗
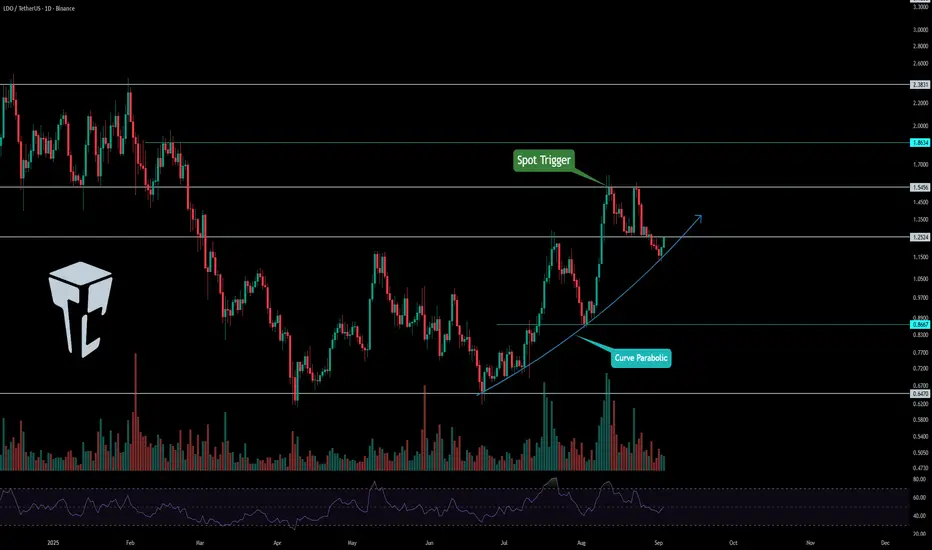
📊 Daily Timeframe
On the daily chart, after bouncing from the 0.647 support area, LDO built a new structure.
Gradually, this move formed into a parabolic curve where every bounce from it triggered sharp upward movements.
For a spot buy entry, a risky strategy would be to buy on this curve reaction with a wide stop-loss (e.g., 0.8667).
However, I personally prefer waiting for the breakout of 1.5450, since that will allow me to set a tighter stop-loss and manage my capital more effectively, enabling me to take on higher risk within my risk management rules.
📝 Final Thoughts
Stay calm, trade wisely, and let's capture the market's best opportunities!
This analysis reflects our opinions and is not financial advice.
Share your thoughts in the comments, and don’t forget to share this analysis with your friends! ❤️
LDO over sold and still sellingsame situation with LDO with the same set up
publishing these ideas to show how market specially alt coins move in the same range

LDOUSDT UPDATE#LDO
UPDATE
LDO Technical Setup
Pattern : Falling Wedge Pattern
Current Price: $1.236
Target Price: $1.99
Target % Gain: 68.22%
Technical Analysis: LDO has broken out of a falling wedge on the 1D chart and is retesting the breakout zone with support from the purple demand area. Volume shows strength, and if price holds above $1.20, continuation toward $1.99 is likely.
Time Frame: 1D
Risk Management Tip: Always use proper risk management.

#LDO/USDT#LDO
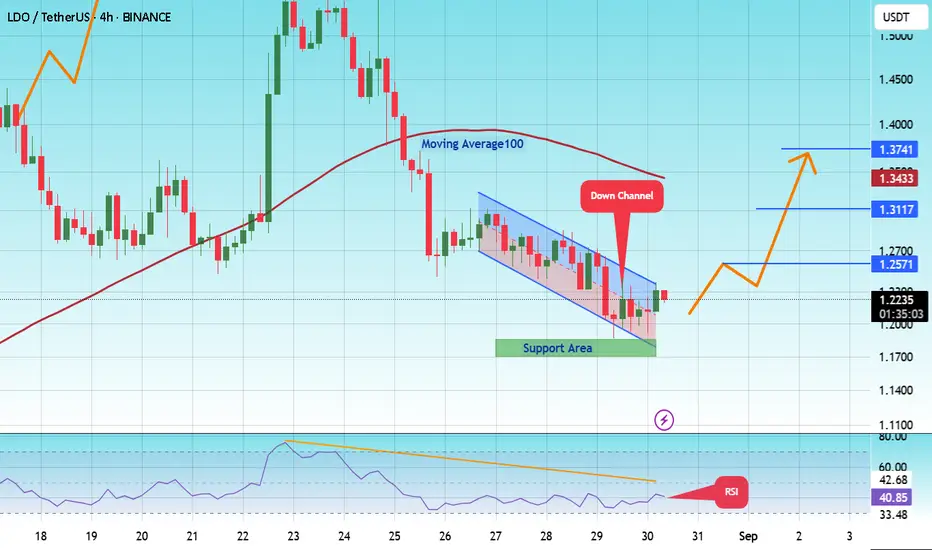
The price is moving within a descending channel on the 1-hour frame and is expected to break and continue upward.
We have a trend to stabilize above the 100 moving average once again.
We have a downtrend on the RSI indicator that supports the upward move with a breakout.
We have a support area at the lower boundary of the channel at 1.18, acting as strong support from which the price can rebound.
We have a major support area in green that pushed the price upward at 1.17.
Entry price: 1.22.
First target: 1.57.
Second target: 1.31.
Third target: 1.37.
To manage risk, don't forget stop loss and capital management.
When you reach the first target, save some profits and then change the stop order to an entry order.
For inquiries, please comment.
Thank you.
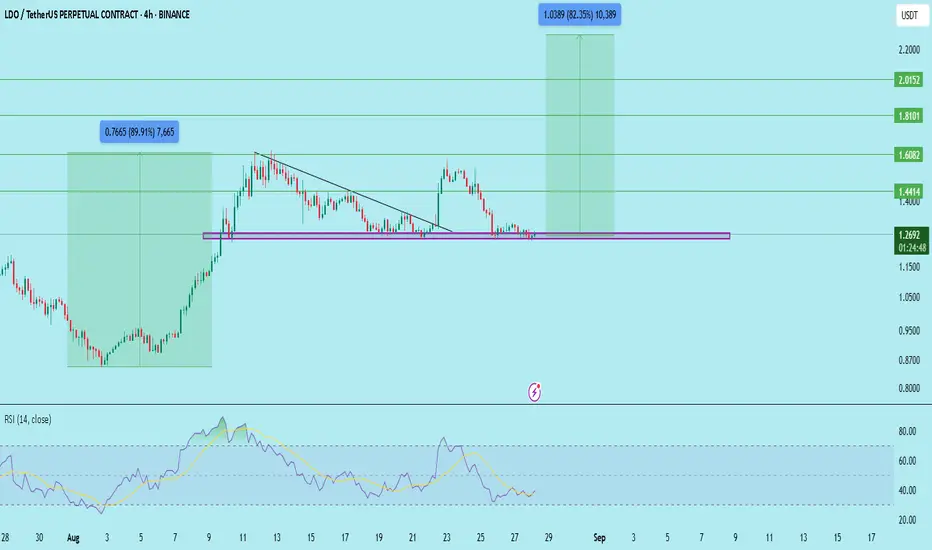
LDO/USDT – Key Support Retest & Possible Reversal SetupLDO has come back to retest the 1.25–1.27 demand zone, which acted as a strong support level in the past. This zone has historically triggered bullish momentum whenever defended successfully.
Analysis & Structure
Price recently retraced from its highs and is now testing the previous accumulation zone.
Buyers seem to be defending the 1.25–1.27 support (purple rectangle).
If this support holds, LDO could bounce towards higher resistance levels.
A breakdown below 1.25, however, would invalidate this setup and open the path to further downside.
Trade Plan
Entry Zone: 1.25–1.27 (support retest)
Stop Loss: Below 1.25 (invalidates the bullish structure)
Targets: 1.44, 1.60, 1.81, 2.01
Trading Insight
This is a risk-reward favorable setup if the support zone holds. Patience is key here – confirmation on higher timeframes is recommended before entering.
DYOR | Not Financial Advice
LDO/USDT — Breakout, Retest, and the Critical Demand Zone!🔎 Market Structure
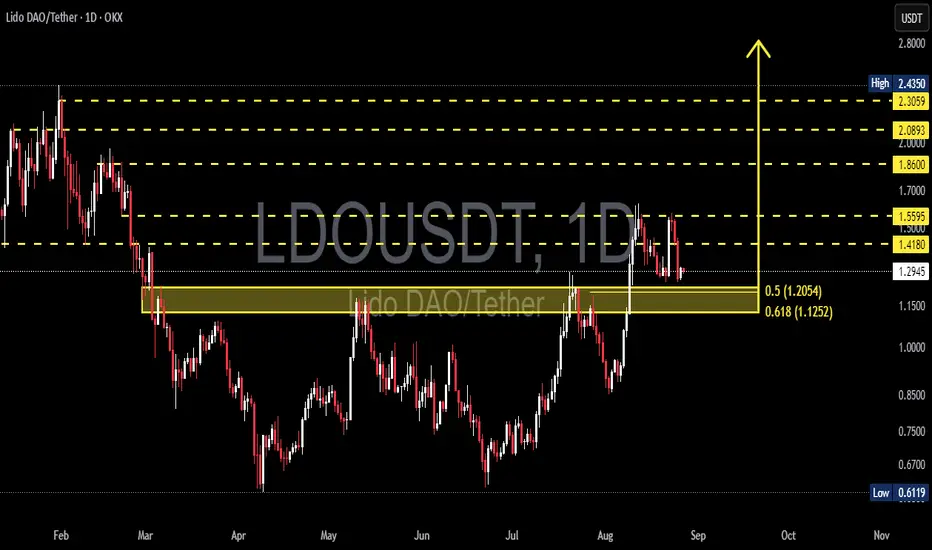
LDO price is currently hovering around 1.29 USDT after breaking out of a long accumulation phase from the 0.61 low. Technically, the market has just made a significant breakout, but is now undergoing a healthy pullback to retest a key demand zone.
The 1.205 – 1.125 zone is the main focus because:
It aligns with the Fibonacci retracement 0.5 & 0.618, also known as the “golden zone.”
Acts as a flip zone (previous resistance → potential support/demand).
If this zone holds, LDO may continue its bullish momentum with higher upside targets.
---
🟢 Bullish Scenario
As long as price holds above 1.205 – 1.125, bullish momentum remains valid.
Long lower wicks at this demand area may indicate buyer absorption/accumulation.
Upside targets if demand holds:
1.418 → 1.5595 → 1.86 → 2.0893 → 2.3059 → 2.4350 (high from the chart).
A confirmed daily close above 1.418 would strengthen the bullish outlook.
📌 Strategy: Accumulate around 1.20–1.12 or wait for breakout confirmation above 1.418. Stop-loss below 1.10. Mid-term targets 1.55–1.86; long-term extension up to 2.30–2.43.
---
🔴 Bearish Scenario
If price closes daily below 1.125, the demand zone fails to hold.
This could trigger a deeper correction towards 0.85, and in extension, back to the 0.61 low.
A breakdown of such a strong demand zone usually accelerates selling pressure.
📌 Strategy: Short entries only valid if daily close confirms below 1.125 with strong volume. Downside targets: 0.85 → 0.61. Stop-loss above 1.25.
---
📈 Pattern & Sentiment
Key pattern: Breakout from accumulation + retest of golden zone.
Sentiment: Neutral–bullish as long as demand zone holds. Watch out for liquidity sweeps below 1.125.
Volume: Bullish confirmation requires increasing buy volume on rebounds.
---
✅ Conclusion
Bullish case: Holding the 1.205–1.125 golden zone → continuation towards 1.418–1.5595 and higher levels.
Bearish case: Daily close below 1.125 → deeper correction to 0.85–0.61.
LDO is at a critical decision point: continuation of the uptrend or rejection into a broader correction.
#LDO #LDOUSDT #Lido #CryptoAnalysis #Altcoin #Fibonacci #Breakout #SwingTrade #CryptoSignals
LDO Market Update📉 MIL:LDO Market Update
Today, MIL:LDO is under selling pressure ❌
Price has broken down the blue support level 🔵, showing sellers are in control.
The potential play:
🔹 Next, watch the green support zone 🟢 — this is where price could potentially bounce back up if buyers step in.
🔹 Always wait for confirmation before entering long — catching a falling price without support validation is risky.

LDO Market Update📈 MIL:LDO Market Update
MIL:LDO has broken out of the red resistance zone, which has now turned into support 🔴➡️🟢
Currently, price is showing signs of retracing.
The potential play:
🔹 If price pulls back to the green zone, this area could provide a potential long entry, since previous strong buyers accumulated there.
🔹 With confirmation, this level may trigger the next bullish push upward 🎯
⚠️ Always wait for confirmation before entering — patience equals profits.

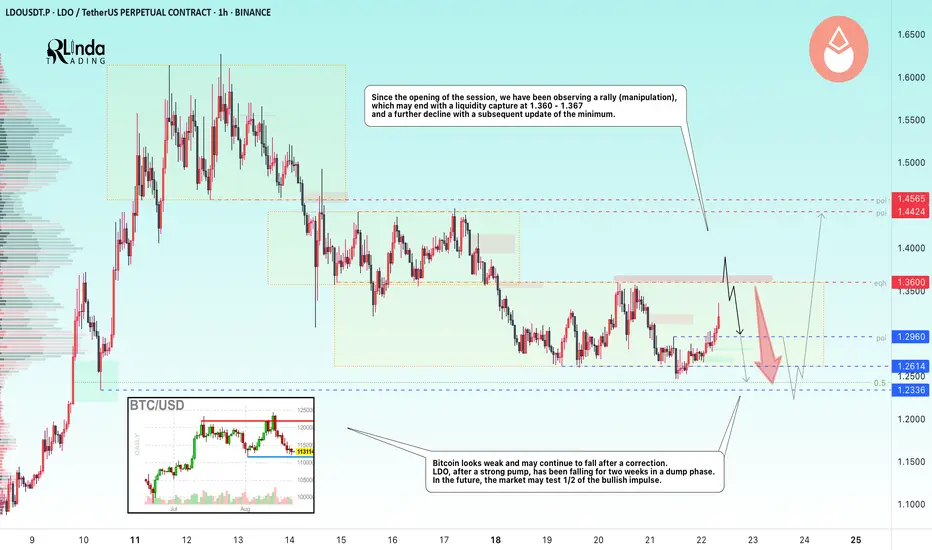
LDOUSDT → Hunting for liquidity ahead of a declineBINANCE:LDOUSDT.P , having failed to reach the zone of interest 1.250 - 1.233, has entered a phase of local rally or manipulation before a possible decline aimed at consolidating potential before long-term growth.
Bitcoin looks weak and, after a correction, may continue to fall to the coveted target of 112 - 110K. After a strong pump, LDO has been falling for two weeks in a dump phase. In the long term, the market may test 1/2 of the bullish momentum and the strong support level of 1.179 before resuming the pump to 1.62 - 1.97.
Since the opening of the session, we have been observing manipulation, the goal of which is most likely the liquidity zone of 1.36 - 1.36. The situation may end with a liquidity grab, a false breakout, and a further decline with a subsequent update of the low.
Resistance levels: 1.36, 1.37, 1.44
Support levels: 1.296, 1.2614, 1.2336
Technically, the price is still consolidating and intrarange trading is likely to continue. A false breakout of resistance could trigger a decline, in which case 1.26 - 1.23 could be considered a target, while a false break of 1.17 - 1.23 could trigger a global rise.
Best regards, R. Linda!
#LDO/USDT | Flipped Longe Term Resistance#LDO
The price is moving within an ascending channel on the 1-hour frame, adhering well to it, and is on its way to breaking strongly upwards and retesting it.
We have support from the lower boundary of the ascending channel, at 1.31.
We have a downtrend on the RSI that is about to be broken and retested, supporting the upside.
There is a major support area in green at 1.28, which represents a strong basis for the upside.
Don't forget a simple thing: ease and capital.
When you reach the first target, save some money and then change your stop-loss order to an entry order.
For inquiries, please leave a comment.
We have a trend to hold above the 100 Moving Average.
Entry price: 1.42.
First target: 1.48.
Second target: 1.55.
Third target: 1.63.
Don't forget a simple thing: ease and capital.
When you reach your first target, save some money and then change your stop-loss order to an entry order.
For inquiries, please leave a comment.
Thank you.

LDOUSDT LongHi everyone, here is a tradeable opportunity , this pair broke through the trendline and is trading above it, should it consolidate above it, look to long it.
Lido DAO ($LDO) hourly chart shows a TD Sequential sell signal. Lido DAO ( MIL:LDO ) hourly chart shows a TD Sequential sell signal.
Monitor $1.45 support; a drop below could target $1.30 or $1.20.
LDO gained 4.27% in the last 24 hours, surpassing the crypto market’s 2.22% rise, after a 70% weekly jump.
Key factors:
Record TVL & Holding: Lido’s TVL reached $38.17B, with $1.71M net outflows reflecting strong accumulation.
Ethereum’s Surge: CRYPTOCAP:ETH approaching $4,500 boosts MIL:LDO , the top liquid staking protocol. .
LDO Coin | Swing Long IdeaLDO | Swing Long Idea
📊 Market Sentiment
Overall sentiment remains bullish, supported by expectations of a 0.25% rate cut in the upcoming FOMC meeting. A weakening USD and increased risk appetite across global markets continue to create favorable conditions for further upside in crypto assets.
LDO is closely correlated with Ethereum’s price action. As ETH approaches all-time highs, fueled by a $1B single-day ETF inflow, LDO is also showing strong upside potential.
Additionally, market rumors suggest that the SEC may approve Ethereum staking policy soon — a move that would directly increase the utility of LDO in the future. This adds strong conviction to a long bias.
📈 Technical Analysis
Price has gained strong momentum alongside Ethereum’s bullish run.
We are approaching a HTF bearish trendline that has capped price for a while.
A breakout and close above this level would be a significant bullish signal.
📌 Game Plan
Wait for a clean break and close above the HTF bearish trendline.
Look for long entries on a retest of the breakout level.
🎯 Setup Trigger
After retest, wait for a 4H break of structure to confirm bullish continuation.
📋 Trade Management
Stoploss: 4H swing low that caused the break of structure
Targets:
TP1: $1.95
TP2: $2.43
Trail stops to secure profits as price moves in favor.
💬 Like, follow, and comment if you find this setup valuable!

LDOUSDT Daily Chart Analysis | Strong Momentum BuildingLDOUSDT Daily Chart Analysis | Strong Momentum Building
🔍 Let’s dive into the LDO/USDT perpetual contract and analyze the latest price action, highlighting a powerful bullish setup and key technical signals on the daily chart.
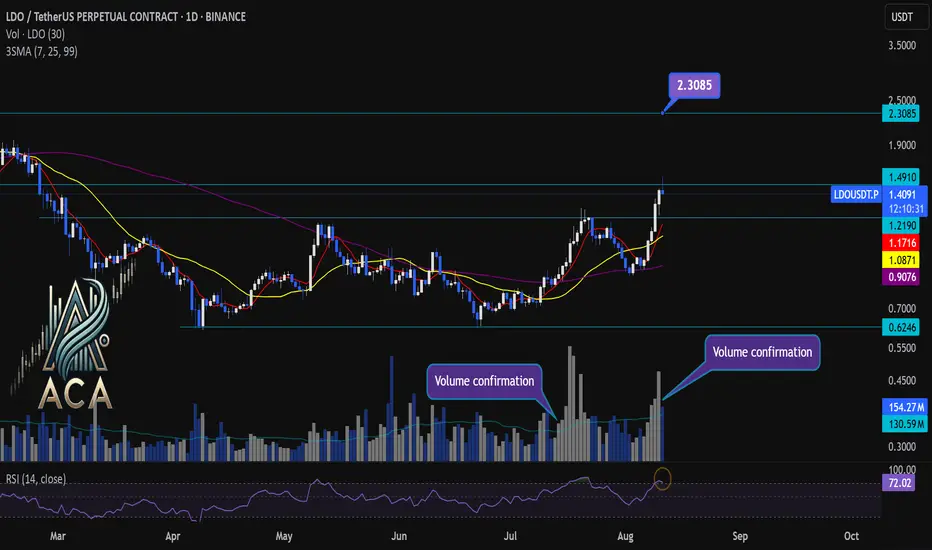
⏳ Daily Overview
The daily chart reveals a strong surge in momentum as the price breaks out of its recent range, accompanied by a decisive uptick in trading volume. The 3SMA setup (short-term, mid-term, and long-term moving averages) is aligning bullishly, marking the beginning of a strong uptrend.
📊 Key Highlights:
- RSI (14) is entering the overbought zone (currently at 73.39), reflecting surging buyer demand and intensifying momentum.
- Price has broken out of the range box with elevated volume, confirming the move.
- Multiple volume confirmation spikes signal conviction behind the breakout.
- Immediate resistance is being challenged; the next key target to watch is $2.3085.
- For continued upside, we must see a daily candle close with solid volume above the current resistance level.
🚨 Conclusion:
Momentum is clearly accelerating on LDOUSDT, supported by volume and moving average bullish alignment. If price closes above resistance with strong volume, a continued rally toward the $2.3085 target is likely. Keep an eye on RSI levels and volume for further confirmations as this trend builds!
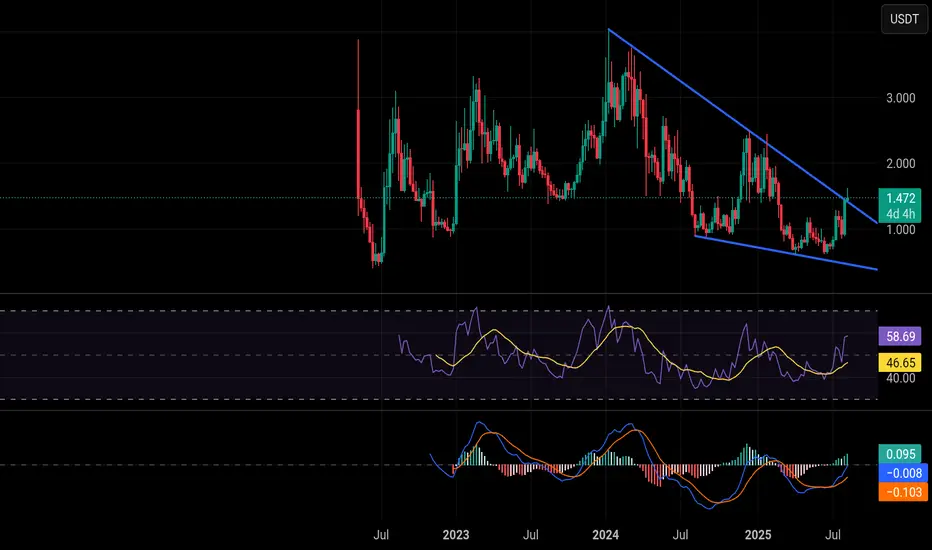
LDO | Flipped Longe Term ResistanceLDO has achieved a significant technical milestone by breaking above its long-term descending resistance trendline that has been in place since early 2024. This breakout represents a major shift in market structure from bearish to potentially bullish sentiment.
Key Technical Points:
• Price successfully flipped the major resistance around $1.485 into support
• The breakout occurred with strong momentum after months of consolidation
• RSI is trending upward, confirming the bullish momentum shift
Price Targets:
• First resistance: $2.00 (previous consolidation high)
• Major target: $3.50+ resistance zone (red box area)
Risk Considerations:
The projected path suggests a strong upward trajectory, but traders should watch for any rejection at the $2.00 level as a potential pause point.

LDO T1 Incoming
MIL:LDO just broke out of a Massive Falling Wedge on the weekly 📈
Bulls are charging, momentum building fast 🐂💨
🎯 Targets:
T1 – $1.774 (almost there 👀)
T2 – $2.441
T3 – $2.963
Structure looks solid for continuation – dips are for loading 🚀

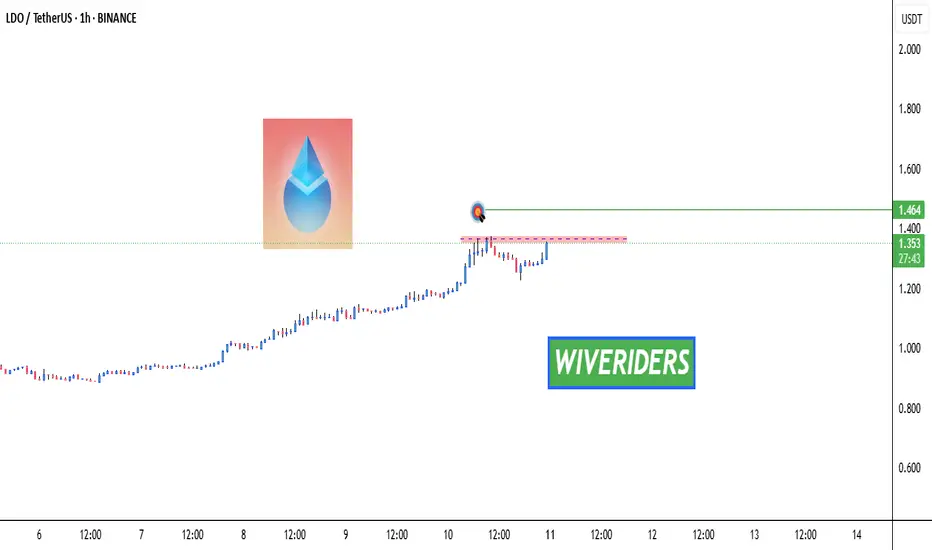
LDO Breakout Watch – Red Resistance Being Tested! 🚨 MIL:LDO Breakout Watch – Red Resistance Being Tested! 🔴⏳
MIL:LDO is testing the red resistance zone.
📊 If breakout confirms, next move could target:
🎯 First Target → Green line level
A breakout could trigger bullish continuation and upside momentum.
Buy Trade Strategy for LDO: Leveraging Liquid Staking Adoption GDescription:
This trading idea highlights LDO, the governance token of Lido Finance, the leading liquid staking protocol in the crypto industry. LDO enables holders to participate in governance decisions that shape the platform’s development, while Lido itself allows users to stake assets like Ethereum and receive liquid tokens in return, unlocking liquidity and yield opportunities simultaneously. As Ethereum staking adoption grows post-merge and more networks integrate with Lido, the demand for its services and governance relevance of LDO are expected to strengthen. Backed by strong partnerships, continuous protocol upgrades, and dominant market share in liquid staking, LDO stands out as a key player in the evolving DeFi landscape.
Still, investors should be aware that cryptocurrency markets are highly volatile and subject to risks from regulatory changes, market sentiment shifts, and technological challenges. Proper risk management is essential when considering LDO as part of an investment strategy.
Disclaimer:
This trading idea is provided for educational purposes only and should not be considered financial advice. Cryptocurrencies like LDO involve substantial risk, including the possibility of losing your entire investment. Always conduct your own research, assess your financial position, and seek advice from a qualified financial professional before making any investment decisions. Past performance is not indicative of future results.

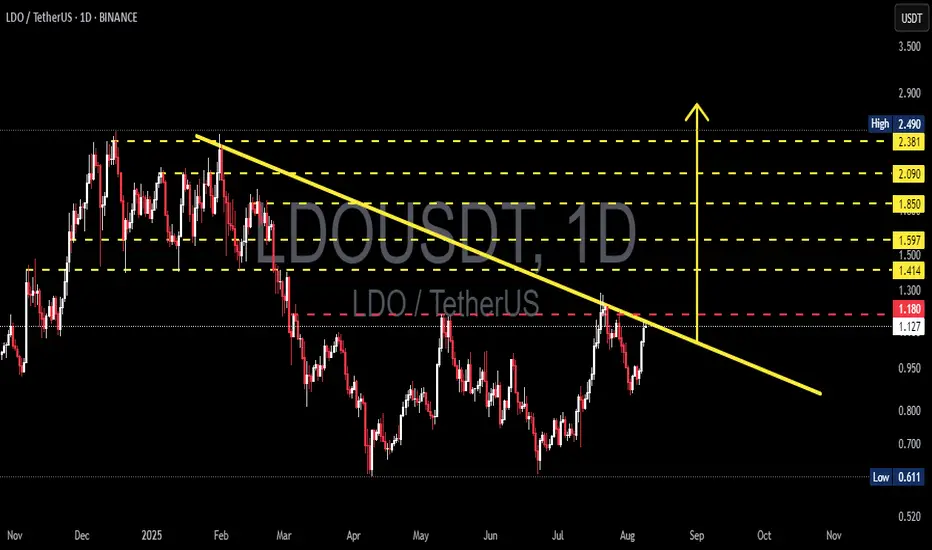
LDO/USDT — Testing the Downtrend Line: Breakout or Rejection?Summary
LDO price is currently testing the descending trendline (yellow) connecting this year’s major highs. This zone coincides with a key horizontal resistance around 1.18–1.30. Price action in this area will determine the next move — either a sustained breakout towards higher supply zones or a rejection leading to renewed bearish pressure.
---
Key Levels (from chart)
Immediate resistance / quick supply zone: ~1.18 (red line) — short-term key.
Descending trendline (yellow): dynamic resistance, currently intersecting near 1.18–1.30.
Staged resistance targets (yellow dashed lines): 1.414 → 1.50 → 1.597 → 1.85 → 2.09 → 2.38 → 2.49.
Main supports: 0.95–1.00 (intraday), and major swing low 0.611.
---
Pattern / Structure Analysis
Mid-term trend — bearish: a clear series of lower highs since the start of the year, marked by a descending supply line.
Current condition — accumulation pressure: after months of sideways consolidation, price is rallying into trendline resistance — often a decisive point leading to either breakout or rejection.
No clear classic reversal pattern (e.g., full inverse head & shoulders) — more of a trendline test after consolidation.
Volume and daily close confirmation are critical to avoid false breakouts.
---
Bullish Scenario (requirements for a valid bullish setup)
Bullish trigger (confirmation):
1. Daily close above trendline + above ~1.30 (body close, not just wick).
2. Rising volume during breakout, showing strong buying participation.
3. A successful retest of the trendline as support after breakout for safer entry.
Step targets after confirmation:
Target 1: 1.414 — partial profit zone.
Target 2: 1.50 – 1.597 — mid-term resistance.
Target 3: 1.85 – 2.09 — major supply zone; if momentum remains, extend to 2.38 – 2.49.
Risk management:
Initial stop-loss below retest area or under 0.95 (adjust to position size).
Consider trailing stops for strong momentum moves.
---
Bearish Scenario (rejection / continuation)
Bearish trigger (confirmation):
1. Rejection at trendline: long upper wick + daily close back under 1.18 without volume confirmation on buying.
2. Increasing sell volume during rejection and follow-through.
Downside targets:
Target 1: 0.95–1.00 (intraday support).
Target 2: 0.80 (mid-level support).
Target 3: if breakdown continues, retest major low at 0.611.
Short strategy on confirmation:
Enter after rejection candle with volume confirmation; stop-loss above wick high / slightly above trendline.
---
Key Signals to Watch Before Entry
1. Daily close — avoid acting solely on intraday wicks.
2. Volume — breakouts without strong volume are prone to failure.
3. Retest confirmation — ideal for safer entries after breakout.
4. Broader market context — BTC/DeFi sentiment can accelerate or reverse moves.
5. Orderflow / on-chain / Lido news — large unlocks or updates may trigger volatility.
---
Trading Plan Highlights
Position sizing: risk only 1–2% of capital per trade.
Measured stop-loss: under breakout retest or under 0.95 for longs; above rejection wick for shorts.
Take profits in stages at resistance zones; avoid aiming for one all-or-nothing target.
Prepare a contingency plan for false breakouts.
---
Final Note
LDO is at a decision point — whether to break the yellow trendline or get rejected will set the mid-term direction. Wait for confirmation (daily close + volume + retest) before committing capital, and maintain strict risk control.
---
Hashtags (for TradingView):
#LDOUSDT #LDO #Lido #Crypto #TechnicalAnalysis #Breakout #SwingTrade #RiskManagement
pay attention to LIDOThis is one of the best R/R on binance for coins who actually have liquidity.
if this trendline is broken, this asset will fly fast

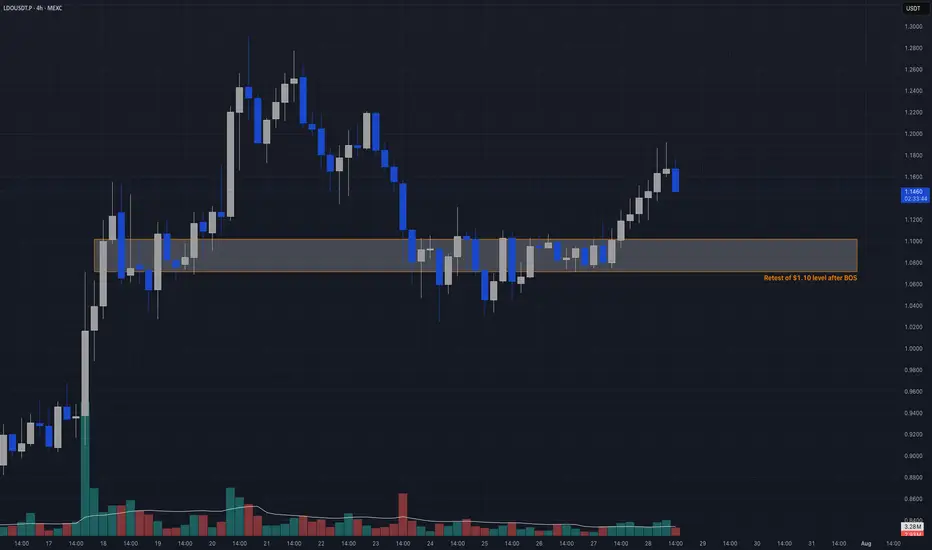
$LDOUSDT.P Breakout → Retest of OB zoneCandle Craft fam — here’s a clean structure-based setup shaping up on LDOUSDT.P. After breaking out from a tight range, price is pulling back toward a fresh BOS zone. Let’s prepare for a surgical retest entry — no chasing.
⸻
📈 Bias: Long
🧠 Strategy: Breakout → Retest of OB zone
📍 Entry Plan:
▫️ Entry Zone: 1.08 – 1.10
🛡️ Stop Loss: 1.045
🎯 Take Profits:
• TP1: 1.18
• TP2: 1.24
• TP3: 1.32
⸻
🧠 Why This Trade?
– Price broke structure cleanly and is now pulling back
– OB between 1.08 – 1.10 = key area to defend
– Previous range highs now turned into demand
– HTF trend remains bullish — this is the reload zone
⚠️ Watch 5m or 15m for BOS or CHoCH once price enters the box. No confirmation = no entry.
⸻
Trade clean. Be precise. We don’t gamble — we wait for the reclaim.
—
Candle Craft | Signal. Structure. Execution.