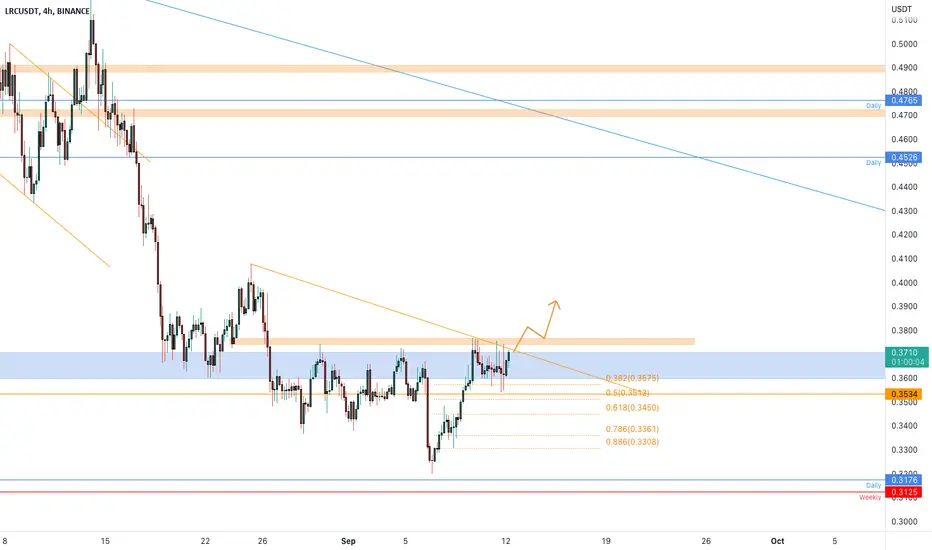
LRCUSDT | UPSIDE CHANCESLRCUSDT has been trading in a bearish parallel channel where the bears looks tired and bulls may start their upward journey.
We are expecting bullish breakout from here once price manages to close above parallel channel.
Trade your levels accordingly.
LRCUSDT.P trade ideas

LRC/USDTLRC/USDT
It is on the very important support of 30 cents.
On the other hand, he managed to break through the roof of the channel.
It is not far off to expect a price increase of up to 50 cents.
#LRCUSDT #LRC #BTCUSDT #BTC #ETHUSDT #DOGE #DOGEUSDT

LRC 15M Triangle with supportWould not say that this was a bullish triangle but the support level with decreasing volatility brought me to scalp long. Easy to scalp such setups but mostly thanks to btc bounce.

LRC/USDT - LONG IF 1 + 1 = 2----- Welcome, dear followers! -----
- Here is my trading methodology. I trade with a normal system and analysis of resistance and support, as well as price reversal patterns.
- For the record, I do not place a stop loss within my trades. So that I only risk 1.5% of my total capital in order to support the loss due to a price reversal against me.
- If a price reversed against my expectation and touched the drawn line r3, then I transferred targets to the entry point and waited for the price to close at it with a loss equal to almost zero.
- Today's deal is shown in the chart, and here are the entry and exit points below.
-- Support me with numbers and follow up on my account for other deals in the future. Thank you for coming to this part. --
-------------------------------------------------------
⚡️⚡️ LRC/USDT ⚡️⚡️
Exchange: Binance Futures
Trade Type: Breakout (Long)
Leverage: Cross (1.0X)
Entry Orders:
1) 0.3345 - 100.0% (87.006 USDT)
Take-Profit Orders:
1) 0.3418 - 80.0%
2) 0.3579 - 19.999%
Trailing Configuration:
Stop: Breakeven -
Trigger: Target (1)

LRCUSDT DEEP CRABCrab
The Crab Pattern is a volatile 5-point extension structure that was discovered by Scott Carney in 2000. It has specific Fibonacci measurements for each point within its structure and it is important to note that D is not a point, but rather a zone in which price is likely to reverse, called the Potential Reversal Zone (PRZ). The B point retracement of the primary XA leg lies between 0.382 and 0.618 and the PRZ consists of 3 converging harmonic levels: 1) 1.618 extension of the primary XA leg, 2) AB=CD pattern, either equivalent, 1.27 or 1.618 and 3) Extreme BC projection of 2.24, 2.618, 3.14 or 3.618.
The first target would be the 382 retracement of AD and the second target the 618 retracement of AD. Common stop levels lie behind the next structure level after the D point or the 2.0 extension of XA. Conservative traders may look for additional confirmation. These patterns can be bearish and bullish. TradingView has a smart XABCD Pattern drawing tool to visually identify 5-point reversal structures on a chart.

LRC Loopring This or ThatLOG SCALE
1) Did a perfect 5 Waves respecting fib levels for wave 3 and 5
2) Has come down in 3 waves holding 0.618
Whats next?
1) Hold $0.3142 and get going
2) Break $0.3142 and visit 0.702 - 0.886 levels
Very nice R:R
Hold my beer pls
----
No financial advice, do your own research, don't be stupid

LRC 1H Strong Support + Bull ChanelLRC has reached the strong support line with the bull chanel on 1H.

LRCUSDT | LIMITED DOWNSIDELRCUSDT after making a double top top around 3.83 entered into a bearish trend . The price is making lower lows and lower highs. The price has finally approached to the horizontal support. The price previously get stable at that zone. The bulls will show strong momentum at that zone. While bears will be active only break below support zone .
The bulls need to hold this zone.
Trade your levels accordingly.

LRC/USDTLRC/USDT
He broke the roof of his channel and fixed it above it.
Azhar is going to have another small correction. Then it starts to grow to at least 0.5 dollars.
#LRCUSDT #LRC #BTCUSDT #BTC #ETHUSDT #DOGE #DOGEUSDT

LRC Wont go up until it breaks the resistanceLRC still chilling under the resistance (red zone on the chart). Would look for a long position only if it breaks.

LRCUSDT is testing the resistanceThe price retested the 0.382 Fibonacci level, after a bullish impulse from the daily support
Now the price is testing the key levels, daily resistance and 4h dynamic and static resistance on the 0.38$ area
How to approach it?
IF the price is going to have a breakout from the resistance and retest it as new support, According to Plancton's strategy , we can set a nice order
–––––
Keep in mind.
🟣 Purple structure -> Monthly structure.
🔴 Red structure -> Weekly structure.
🔵 Blue structure -> Daily structure.
🟡 Yellow structure -> 4h structure.
–––––
Follow the Shrimp 🦐
LRCUSDT wants the breakoutThe price is testing the weekly support where the market got the liquidity.
Now the price is trying to have a breakout from the daily resistance after a double bottom
How to approach it?
IF the price is going to have a breakout from the resistance and retest it as new support, According to Plancton's strategy , we can set a nice order
–––––
Keep in mind.
🟣 Purple structure -> Monthly structure.
🔴 Red structure -> Weekly structure.
🔵 Blue structure -> Daily structure.
🟡 Yellow structure -> 4h structure.
–––––
Follow the Shrimp 🦐

#LRC long ideaHello dear Traders,
Here is my idea for #LRC
Price finds support at monthly pivot S1 line.
Wait for daily close above the yellow trigger line (previous month high) to enter trade.
Targets marked in the chart (black lines)
Invalidation level marked with red line
Please feel free to ask any question in comments. I will try to answer all! Thank you

LRCUSDT Critical and Looking to BTCUSDTKUCOIN:LRCUSDT
LRC is at major support that is approached via descending triangle. If support breaks and retests local low, possible opportunity to Short LRC to 0.1905 - 0.2312 zone. However, Long LRC on bounce off support via a possible double bottom with targets to 0.3660.
If you liked this idea or if have your own opinion about it, write in the comments.
The information and publications are not meant to be, and do not constitute financial, investment, trading, or other types of advice or recommendations.
LRCusdtLRC good work when market going up but now come bottom and this triangle is long time going down
remember this targets for mid adn long time
i try show u close targets but remember when btc back up again altcoin can move
GL
EntryPoint:
0.3264
Supports:
0.2909
0.2477
0.2021
0.1817
0.1594
Resistance: (remember for short time can set this for targets):
0.3861
0.4762
Targets:
0.5501
0.7761
1.0270
mid time:
1.3568
2.0156
3.3313
for HODL: (this is risky but for years is ok)
6.3381
can see 2 trgets on chart but i think better before that you sell and buy others ALT
can happen but now market going down for btc
on chrt can see pattern

LRCUSDT Loopring - CRAZY?? +1000% Potential*Hi Traders, Investors and Speculators 📉📈
Ev here. Been trading crypto since 2017 and later got into stocks. I have 3 board exams on financial markets and studied economics from a top tier university for a year. Daytime job - Math Teacher. 👩🏫
Another altcoin that I am bullish on for the near future, is Loopring LRCUSDT. This microcap is trading at 1000% under it's ATH, and considering the fact that we are evidently trading in the accumulation phase, between now and perhaps a little lower would make for some great distributed entry points.
Want to know a little more on how to do distributed entry's / dollar-cost-average? See HERE:
*Before you leave a comment, please make sure to watch the video all the way to the end, as there are some "t's and c's" mentioned about the upside potential.
I hope you enjoyed this post today! Please give us a thumbs up 👌
_________________
👀 Follow us here on TradingView for daily updates and trade ideas on crypto , stocks and commodities 💎
👍Hit like & Follow 🔔
We thank you for your support !
CryptoCheck

LRCUSDTHello Crypto Lovers,
Mars Signals team wishes you high profits.
This is a one-day-time frame analysis for LRCUSDT
There is R2 that used to be a support area. R1 is our resistance line that shows the price was not able to rise at some points. And S1 is the support area and you are able to observe the well support of the price in it. Accordingly, we have the price fluctuating over S1 and we expect a fall for it to this area. By reaching here, we should wait for some confirmation candles in order to rise and when this happens, we predict an increase to happen toward R1 for the price by considering our long position. In case the price loses the support at S1, surely more decline is waiting for it.
Warning: This is just a suggestion and we do not guarantee profits. We advise you to analyze the chart before opening any positions.
Wish you luck

another panel These are another four coins that are showing the same pattern -- If it's indicative of what's happened already, than I think we're gonna see a bit of a push here.

LRCUSDT 1WLoopring has been touching this trend for a long time on the weekly chart and starts the bull run. Will it succeed this time?

LRCUSDTA strong downtrend , the formation of the flag figure has ended , this figure has been broken , its retest has occurred .
The tool will go below. short entry by pattern

LRC/USDT buy trade setupToday we had a big downside move. The medium-term trend is turning from bearish to bullish and right now it can be a good time to take some risk.

not financial advicethis post is for myself to track my own ideas; brief description not really needed here, just filling up character limit... thanks trading-view
but yeah
idea is a projection of a sin curve w/ tilted angle;
don't know what candles will say;
look like inflection point on 200 Day SMA
if BTC relief rally --> ETH rally --> ALTS rally as rising tide lifts all boats; not fin. advice

LRC/USDT is about to boomWe expect LRC to bottom today or tomorrow, then a new upside wave should begin.
