LRCUSDT TODAY IS EXCELLENT1-Apply your own risk management.
2-Daily and Weekly Targets
3-Hunt the profits at any level you see convenient for you.
4-Raise Your SL any time the price moves up or down to protect your profits
5-Use 18% Spot
LRCUSDT.P trade ideas

LRC Loopring Coin Price Prediction🔥 Price on the 4H chart might come at these support area and we might get a potential bounce🔥
Potential bounce areas for Buying 0.2717 and 0.2421
👉 Follow me for more real time opportunities.
Share your Thoughts if you have any?

LRC super highWe see multiple buy prints and a very high volume. We can expect a great targets. Watch out 0.30 levels. DYOR

Buy LRC
LRC has been consolidating above the EMA50D for two weeks. On 12H TF, it broke the trendline.
When looking at the LRC/BTC pair (see in comment), price is at long-term support. History shew that, LRC would bounce hard from this support.
Proposed trade setup is as in chart.
Disclaimer:
This analysis is based on my personnal views and is not a financial advice. Risk is under your control.
--------- info about LRC --------------
LRC typically refers to Loopring (LRC), a decentralized exchange (DEX) protocol built on the Ethereum blockchain. Loopring aims to facilitate the exchange of digital assets while allowing users to maintain custody of their funds throughout the trading process.
The Loopring protocol enables the creation of decentralized exchanges and is designed to provide scalability, security, and liquidity to the decentralized trading ecosystem. It uses a combination of on-chain and off-chain processes to execute trades, utilizing a concept called zkRollups to batch and settle transactions on the Ethereum blockchain.

✴️ Loopring Ready For Major Bullish Explosion (500% Possible)Here is another incredible chart, things will soon get out of control; A bullish disorder.
Loopring (LRCUSDT) has been rising strong since 19-Oct and is showing a super high RSI.
While the RSI looks great, the current price is barely trading above the early November 2022 low. This means that growth potential is still intact and the bullish bias strong right from the get go.
The volume lines can be tricky, they seem pretty small but it is not about the size but the size compared to previous days, previous sessions. Lately, the trading volume has been 3, 4, 5 times above the average in the past 7 months, telling us clearly that behind the scenes the bulls, smart money and emotionally well balanced people are already buying up.
What follows is a bullish wave, no surprise, with a target of 500% or more.
We can look closer, 50%, 100% and 148% can happen within this month or within days.
When it moves it moves fast and strong.
The consolidation phase can take many months but the breakout alone can produce 100% in a single day, sometimes less, sometimes more.
Namaste.

LRCUSDTOne of the least move of alt coins with HNS forming. In the next few days, significant movement is expected with RTI indicator in bullish crossover soon.

💡Trade Idea #LRC/USDT:#Looping formed an Inverse head & shoulder pattern that facing a resistance zone right on.

What you sow today you will reap tomorrowAfter the end of a complete downward wave, you will achieve good goals. Of course, it is a spot recommendation only. I entered it by Future from 0.17$

LRCUSDT 2DRounding bottom formation on 2-days chart. #LRC is facing with the MA200 and neckline of the pattern. In case of breakout, targets are on the table. Check them on my chart.

LRC Loopring - Quiet before the STORM ?Hi Traders, Investors and Speculators 📈📉
Ev here. Been trading crypto since 2017 and later got into stocks. I have 3 board exams on financial markets and studied economics from a top tier university for a year. Daytime job - Math Teacher. 👩🏫
Loopring / LRCUSDT has been trading under its 50 day moving average for a few weeks now (this is the weekly chart). This means that the chart is heavily oversold from the MA perspective and a correction is due.
This is bullish, because a correction back towards the 50d MA is expected , even if we get rejected there it will still be an easy, low risk high reward setup that could provide +140%. Keep an eye out on this altcoin and the price action along the moving averages !
Have a great weekend, the charts will be here on Monday 🥂
_______________________
📢Follow us here on TradingView for daily updates and trade ideas on crypto , stocks and commodities 💎Hit like & Follow 👍
We thank you for your support !
CryptoCheck

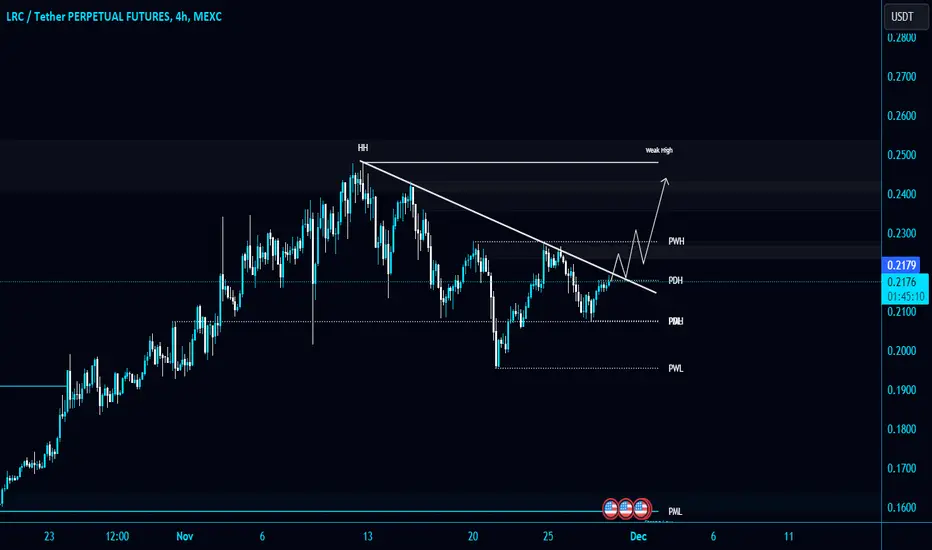
#LRC/USDT is testing the Diagonal Trendline in 4-Hour TF!#LRC/USDT is testing the Diagonal Trendline in 4-Hour TF!
FWB:LRC needs to clear the Trendline to gain the bullish momentum. Wait for BO to open a long position.
The local resistance level is PWH $0.228 and the local support level is PDL $0.2075.
LRC / LRCUSDTGood Luck >>
• Warning •
Any deal I share does not mean that I am forcing you to enter into it, you enter in with your full risk, because I'll not gain any profits with you in the end.
The risk management of the position must comply with the stop loss.
(I am not sharing financial or investment advice, you should do your own research for your money.)


LRCExpecting rejection at 26, but most other cryptocurrencies are reaching the cloud so that seems to be the general target as of right now. 26 and 34 cents for LRC.
LRC creeping gainer compared to others, but all in all looks to have broken several trends and we can look forward to a sideways movement trend now.

Is a strong rise starting?Targets: 0,25 - 0,28 - 0,30 - 0,45
This is not advanced work! Please do not consider it as investment advice!

LRC/USDT Signals Sparking Interest! Spot or Future Buy? 🌐💸 🚀 **Crypto Signal Alert!** 🚀
$LRC/USDT weekly and daily candles seem primed for a potential pump! 📈 Considering a buy? Well, it's up to you—whether it's in the future or spot, it's all about your happy mood and risk management. We're here to share experiences and ideas. Enjoy these free signals, and may the markets bring you joy! 🌟💰 #CryptoTrading #SignalAlert

LRC has a strong uptrendThe instrument has been in a local uptrend over the past few days. At this moment, a bullish triangle formation has formed, which may indicate a continuation of the trend. The compression of the lows to the levels goes along the trend line, indicating the presence of a limit buyer interested in updating the highs. Behind the cascade of resistance levels, I expect to see the participants' feet, due to which the impulse movement will go.

LRC/USDT bullish ride? 👀 🚀 Loopring Today Analysis💎 Paradisers, brace yourselves as we've spotted a promising opportunity with LRCUSDT, poised for a potent bullish surge following a retest of its formidable support.
💎 In our prior observations, LRC navigated within a descending channel. After breaking free, it faced rejection at the supply level of .1772. Interestingly, it's now revisiting the channel's support, which previously played the role of resistance.
💎 Currently, the odds are in favor of it embarking on a bullish trajectory from the solid support level at .1644. This is further bolstered by the presence of untouched supply zones overhead, indicating a potential visit to these levels in the foreseeable future.
💎 However, on the flip side, should the price breach the .1644 support, we might witness a notable downward shift.
💎 Remember to employ prudent trading strategies and use proper stop-loss measures! Stay alert to market movements and look forward to more insight

LRC/USDT - Loopring: BBand Breakout◳◱ On the $LRC/ CRYPTOCAP:USDT chart, the Bband Breakout pattern suggests an upcoming trend shift. Traders might observe resistance around 0.2135 | 0.2247 | 0.2569 and support near 0.1813 | 0.1603 | 0.1281. Entering trades at 0.2138 could be strategic, aiming for the next resistance level.
◰◲ General info :
▣ Name: Loopring
▣ Rank: 131
▣ Exchanges: Binance, Kucoin, Bybit, Huobipro, Gateio, Mexc
▣ Category/Sector: Financial - Decentralized Exchanges
▣ Overview: Loopring is an open protocol for building high-performance, order book decentralized exchanges on Ethereum. Their goal is to enable the building of highly scalable exchanges without compromising Ethereum-level security guarantees through a zkRollup construction.
◰◲ Technical Metrics :
▣ Mrkt Price: 0.2138 ₮
▣ 24HVol: 7,669,682.718 ₮
▣ 24H Chng: 6.633%
▣ 7-Days Chng: 13.52%
▣ 1-Month Chng: 21.59%
▣ 3-Months Chng: 0.87%
◲◰ Pivot Points - Levels :
◥ Resistance: 0.2135 | 0.2247 | 0.2569
◢ Support: 0.1813 | 0.1603 | 0.1281
◱◳ Indicators recommendation :
▣ Oscillators: NEUTRAL
▣ Moving Averages: STRONG_BUY
◰◲ Technical Indicators Summary : BUY
◲◰ Sharpe Ratios :
▣ Last 30D: 3.95
▣ Last 90D: 0.00
▣ Last 1-Y: 0.10
▣ Last 3-Y: 0.74
◲◰ Volatility :
▣ Last 30D: 0.44
▣ Last 90D: 0.46
▣ Last 1-Y: 0.88
▣ Last 3-Y: 1.50
◳◰ Market Sentiment Index :
▣ News sentiment score is N/A
▣ Twitter sentiment score is 0.52 - Bullish
▣ Reddit sentiment score is 0.30 - Bearish
▣ In-depth LRCUSDT technical analysis on Tradingview TA page
▣ What do you think of this analysis? Share your insights and let's discuss in the comments below. Your like, follow and support would be greatly appreciated!
◲ Disclaimer
Please note that the information and publications provided are for informational purposes only and should not be construed as financial, investment, trading, or any other type of advice or recommendation. We encourage you to conduct your own research and consult with a qualified professional before making any financial decisions. The use of the information provided is solely at your own risk.
▣ Welcome to the home of charting big: TradingView
Benefit from a ton of financial analysis features, instruments and data. Have a look around, and if you do choose to go with an upgraded plan, you'll get up to $30.
Discover it here - affiliate link -

QTUM BACK TO OLD LEVELSThanks for reading the update.
Qtum has the possibility to return to old levels since the Asia hype increase volume.

LRC NEW UPCOMING VOLUMETHank you for reading this update.
LRC seems to have a new upcoming volume that can have a break effect.

lrc breakout confirmed expecting solid recovery seems like getting ready for massive recovery in coming weeks
descending channel breakout has already confirmed with solid volume expecting massive recovery in coming days expecting move towards 1$

LRC performed Descending BroadeningLRC performed Descending Broadening Wedge
A descending broadening wedge is a technical chart pattern often observed in financial markets, particularly in stock trading and forex. It is a type of wedge pattern that indicates a potential trend reversal from a downtrend to an uptrend. Here's a breakdown of the key characteristics of a descending broadening wedge:
1. **Shape:** A descending broadening wedge consists of two converging trendlines. The upper trendline slopes downward, while the lower trendline slopes upward. This creates a wedge-like shape on the price chart.
2. **Diverging Boundaries:** The defining feature of this pattern is that the two trendlines are moving away from each other, making the wedge broader as time progresses.
3. **Sloping Trends:** The upper trendline represents the resistance level and is typically steeper than the lower trendline, which serves as the support level.
4. **Volume:** Volume tends to decrease as the pattern develops. This is a key characteristic, indicating a decrease in trading activity.
5. **Duration:** The pattern usually takes several weeks to form, but the timeframe can vary.
6. **Breakout:** The pattern is considered complete when the price breaks out of the wedge formation. The breakout can be in either direction, although in the case of a descending broadening wedge, a breakout to the upside is more common and is seen as a bullish signal.
7. **Target:** Traders often use the width of the pattern at its widest point to estimate a potential price target once the breakout occurs. This is typically projected in the direction of the breakout. In the case of a descending broadening wedge, the target would be higher prices.
Remember that technical analysis, including the interpretation of chart patterns like the descending broadening wedge, is just one tool used by traders and investors to make decisions. It's important to consider other factors and use risk management techniques when making trading or investment choices. Additionally, not all chart patterns play out as expected, so it's crucial to use these patterns in conjunction with other forms of analysis to make informed decisions.
