LRC Crypto Loopring Buy TP = 0.1753On the H1 chart the trend started on October 12 (linear regression channel).
There is a high probability of profit taking. Possible take profit level is 0.1753
But we should not forget about SL = 0.1598
Using a trailing stop is also a good idea!
Please leave your feedback, your opinion. I am very interested in it. Thank you!
Good luck!
Regards, WeBelieveInTrading
LRCUSDT.P trade ideas

Buying Signal for LRC/USDT PairWe've observed the formation of a descending wedge on the LRC/USDT pair. A breakout above the resistance confirms a bullish trend. I'm projecting the LRC price to target $0.192. For risk management, I've set a stop loss at $0.171. Keep an eye on this pair as it shows promising signs of an upward move.

LRC LOOPRING Buy TF M30 TP = 0.1774On the M30 chart the trend started on Sept. 22 (linear regression channel).
There is a high probability of profit taking. Possible take profit level is 0.1774
But we should not forget about SL = 0.1708
Using a trailing stop is also a good idea!
Please leave your feedback, your opinion. I am very interested in it. Thank you!
Good luck!
Regards, WeBelieveInTrading

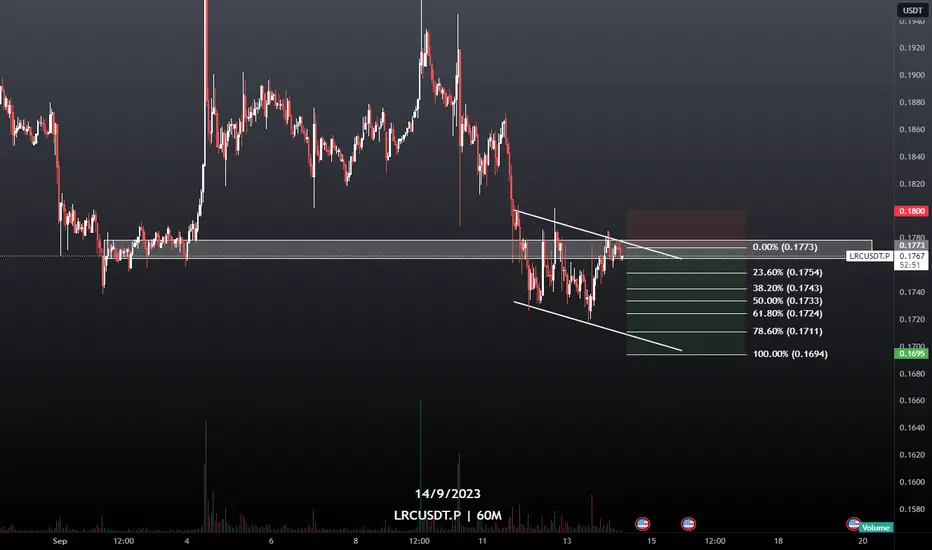
LRC USDT PERPHello Trader OKX:LRCUSDT.P
the point area is now in its strong resistance area, indications of bearish factors are there but yes it can be confirmed to go down further. because the resistance has not been able to break through and be confirmed to go up.
Please add a comment and Positive feedback and
constructive criticism are important to authors and the
community.
Disclamer: Not Financial Advice
all leverage 20X
LRC USDT PERP Hello Trader OKX:LRCUSDT.P
decreased because the resistance area was rejected, because yesterday's news was positive for usdt. take the closest area to take a sell area position.
Please add a comment and Positive feedback and
constructive criticism are important to authors and the
community.
Disclamer: Not Financial Advice
all leverage 20X

LRCUSDTThis is a 1D frame analysis for LRCUSDT As we can see, the price is currently fluctuating around our weekly support zone and we expect it to support the price like it has done in the past and not break below it. However, we must wait and see if the price can break through the first resistance zone and establish itself above it, then we can enter the trade with less risk for the second resistance zone. It is also possible that after hitting the first resistance line, the price may not be able to establish itself above it and we may experience a price pullback.

LRCUSD ❕ neutral RSITrading volumes decreased on price correction.
RSI is near neutral values.
LRC is bouncing off support.

LRC USDT PERP Hello Trader BINANCE:LRCUSDT.P
rounding bottom pattern has been seen and there is a bullish close wick for this pair
Please add a comment and Positive feedback and
constructive criticism are important to authors and the
community.
Disclamer: Not Financial Advice

LRC showing a very good investment opportunityHi Everyone;
today we have one of the best risk to reward Investment opportunity
it is more than 730 times the risk and the chart is look very promising.
Good luck every one

LRCUSDT 1DI think there is no hope for #LRC. Super bearish. Lost everything. If you have it, consider to sell.

LRC is long term Consolidation, Aiming to breakout LRC Is looking bottom at the moment lets see how it goes

Update after long hiatusI am not a user or have an understanding of Elliot waves, but looking here is something to study into the values of waves to see if they're valid here.
After trying to follow the bottom with the market I believe it is in now in and am doubling down here. There is no chance the globe is collectively going to reset the financial world or dump us into a huge recession and i think capitulation in crypto is in. Watch gold closely.
If the chart continues to follow fundamentals we should see sideways movement and gradual upward from here forward to MY single sell target of 24$ in 2025 *shrug emoji*

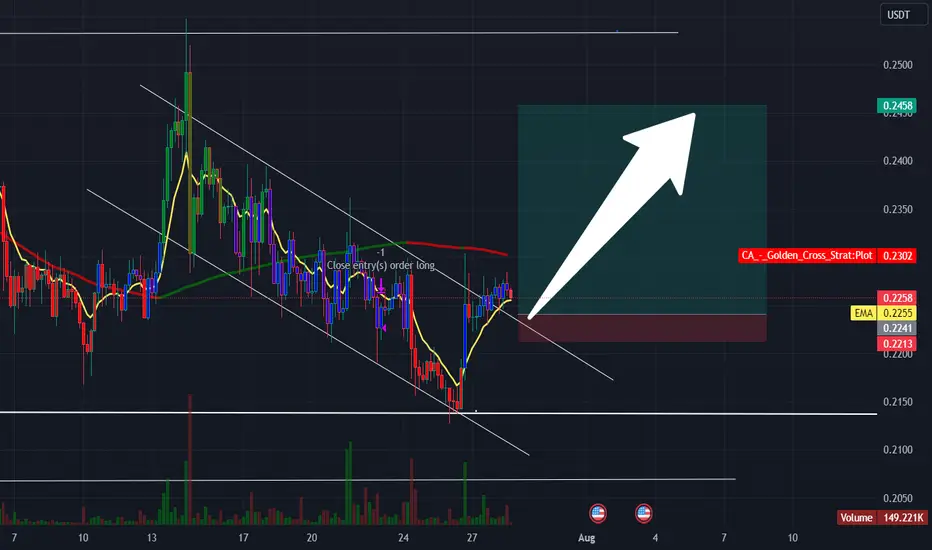
LRCUSDT is grabbing new liquidity?Testing Key Daily Support: The current market situation involves LRCUSDT testing the $0.2 area, which serves as a crucial daily support level. Daily support levels are historical price points where buying interest has previously emerged, potentially preventing the price from declining further.
Breakout Potential at $0.24: You've indicated that a potential trading opportunity could arise if the price effectively captures new liquidity and subsequently generates a new breakout above the $0.24 level.
Plancton's Rules Application: In accordance with your analysis and following Plancton's Rules, you are considering a new long position if the price accomplishes the mentioned breakout above $0.24. A long position involves acquiring the asset with the expectation that its value will ascend, aligned with the anticipated bullish momentum implied by the potential breakout.
–––––
Follow the Shrimp 🦐
Keep in mind.
🟣 Purple structure -> Monthly structure.
🔴 Red structure -> Weekly structure.
🔵 Blue structure -> Daily structure.
🟡 Yellow structure -> 4h structure.
⚫️ Black structure -> <= 1h structure.
Follow the Shrimp 🦐

Loopring token (LRC) forming bullish Cypher for the next pumpHi friends, hope you are well and welcome to the new trade setup of Loopring token (LRC) with US Dollar pair.
Previously we caught more almost 47% pump of LRC as below:
Now on a 2-hour time frame, LRC has formed a bullish Cypher move for the next price reversal.
Note: Above idea is for educational purpose only. It is advised to diversify and strictly follow the stop loss, and don't get stuck with trade.

LRC LOOKS BULLISH (12H)Hi, dear traders. how are you ? Today we have a viewpoint to BUY/LONG the LRC symbol.
For risk management, please don't forget stop loss and capital management
When we reach the first target, save some profit and then change the stop to entry
Comment if you have any questions
Thank You

LRCUSDTHello Traders,
As we can see that LRC is in a slow bleeding phase we can expect this that it will come to the lower resistance then we will have a long position to wait till it comes to support and then follow the chart pattern.

LRCUSDT.P long opportunityA complete 5 wave down cycle was identified on the M30 chart of LRCUSDT.P. There was an impulse in a bullish A wave with a recent retracement in a B wave. Going long using entry/exit levels that are marked on the chart.

#LRCUSDTLRC broke the upper resistence as it is move in the channel now is upper to the support now we can expect a good move from here.
#lrc longwe can expect a good move from here in lrc as buyers showing interest now and it is on the very good support we can have some lrc.

Loopring On the Move 🚀Hey Traders,
As LRC/USDT is currently on the Golden retracement area there's 61.8% chance of moving upwards.
After reaching the giving target level wait for a breakout from the above supply zone, if not please close your long position.
Trade wisely use stop losses and DYOR.
Happy Trading Hustlers !!!


LRC ANALYSIS (4H)Hi, dear traders. how are you ? Today we have a viewpoint to BUY/LONG the LRC symbol.
For risk management, please don't forget stop loss and capital management
When we reach the first target, save some profit and then change the stop to entry
Comment if you have any questions
Thank You

LRC/USDT SHORT💡My Vision of a TRADE IDEA BingX💡
LRC/USDT 4H SHORT High Risk According to my analysis;
Entering at 0.23500 this time coincides with the 200 moving average very close to the 0.50 Fibonacci level. On 12H and 1D charts, there are already selling configurations, taking a position with an RR of 3.61:1. If it manages to reach the previous minimum, which is very likely, then we have an RR of 4.68:1, and setting a stop loss at 2.26% allowing a ‼️MAXIMUM 30X LEVERAGE‼️ with a position size of 1% and the risk of liquidation for this position.
💡Mi Vision de una IDEA DE TRADE BingX💡
LRC/USDT 4H SHORT Alto Riesgo Según mi análisis;
Entrando por los 0.23500 en esta ocasión coincide con la media de 200 muy cerca del 0.50 Fibo
y en gráficos de 12H y 1D ya con configuraciones de venta, tomando una posición con un RR de 3.61:1 y si logra llegar al mínimo anterior que si es muy posible entonces tenemos un RR de 4.68:1 y dejando un stop Loss de 2.26% permitiendo un apalancamiento ‼️MAXIMO DE 30X‼️con una posición del 1% y con riesgo de liquidación de esta posición
