QQQ: Runaway or Exhaustion Gap?QQQ just printed a strong bullish gap on the daily chart, but context suggests caution. With widening SOFR spreads signaling a dollar funding shortage, this move may represent an exhaustion gap rather than a continuation breakout.
Runaway Gap Characteristics
Mid-trend breakout with moderate volume
Key stats
About Invesco QQQ Trust Series I
Home page
Inception date
Mar 10, 1999
Structure
Unit Investment Trust
Replication method
Physical
Dividend treatment
Distributes
Distribution tax treatment
Qualified dividends
Income tax type
Capital Gains
Max ST capital gains rate
39.60%
Max LT capital gains rate
20.00%
Primary advisor
Invesco Capital Management LLC
Distributor
Invesco Distributors, Inc.
ISIN
US46090E1038
QQQ is one of the most established and actively traded ETFs in the world, albeit one of the most unusual. The product is one of a few ETFs structured as a unit investment trust. Per the rules of its index, the fund only invests in nonfinancial stocks listed on NASDAQ, and effectively ignores other sectors too, causing it to skew massively away from a broad-based large-cap portfolio. QQQ has huge tech exposure, but it is not a 'tech fund' in the pure sense either. The fund's arcane weighting rules further distance it from anything close to plain vanilla large-cap or pure-play tech coverage. The ETF is much more concentrated in its top holdings and is more volatile than our vanilla large-cap benchmark. Still, the fund has huge name recognition for the underlying index, the NASDAQ-100. In all, QQQ delivers a quirky but wildly popular mash-up of tech, growth, and large-cap exposure. The fund and index are rebalanced quarterly and reconstituted annually.
Related funds
Classification
What's in the fund
Exposure type
Electronic Technology
Technology Services
Stock breakdown by region
Top 10 holdings

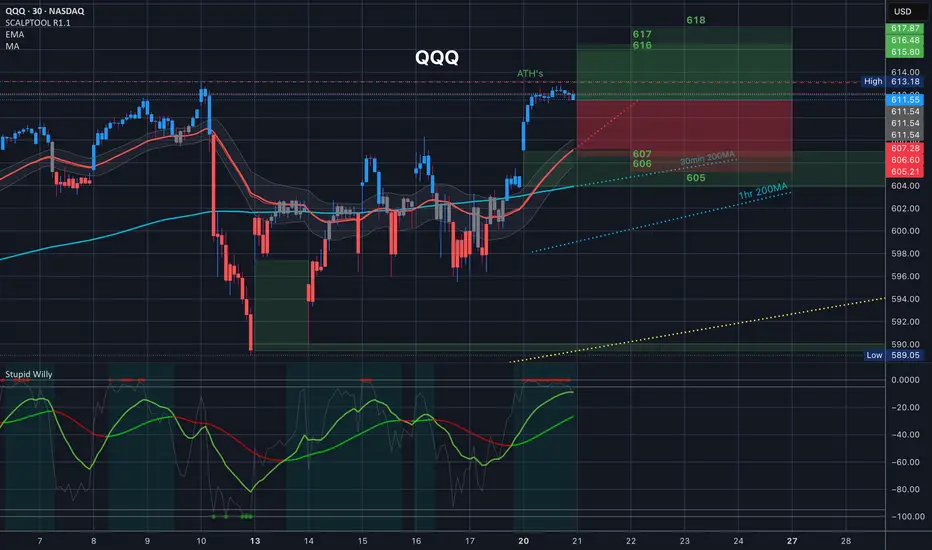
$QQQ Tomorrow’s Trading Range 10.21.25 NASDAQ:QQQ Tomorrow’s Trading Range 10.21.25
Alway’s know where your 35EMA is. It is underneath the implied move right now, which means tomorrow has a high probability of being flat or down. ATH’s are in tomorrow’s range above us, and 35EMA underneath us with that 30min 200 and also the bull ga
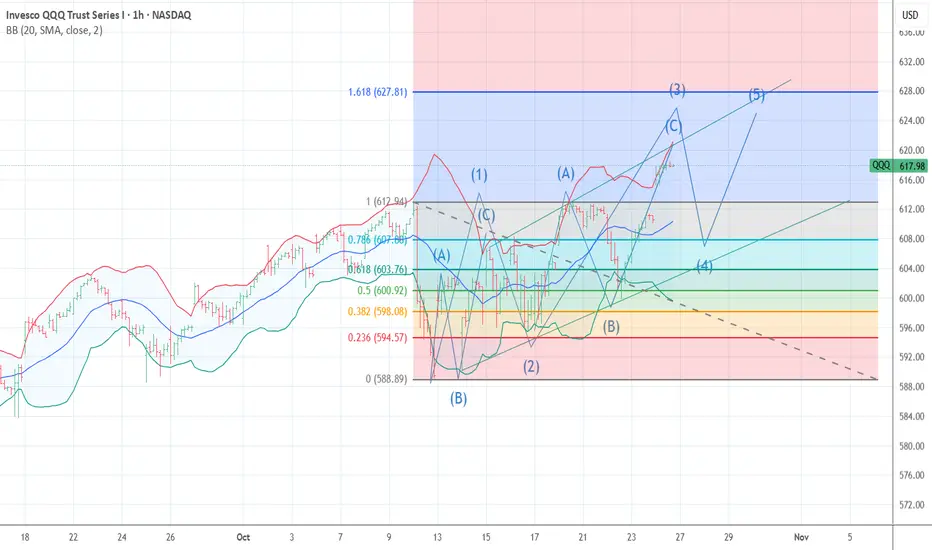
QQQ My view of the ending Diagonal 5the wave forming The chart posted below is my top QQQ count .I see us forming wave c of 3 up We should now see a down and up to new highs next week to end the 5 wave up to then see another decline to begin .Have a great weekend Best of trades WAVETIMER
$QQQ Tomorrow's Trading Range for 10.22.25
What are we thinking here? ATH's were clearly a resistance after mondays gap up, and we consolidated back to the 35EMA. That upgap from monday is looking like a good target.

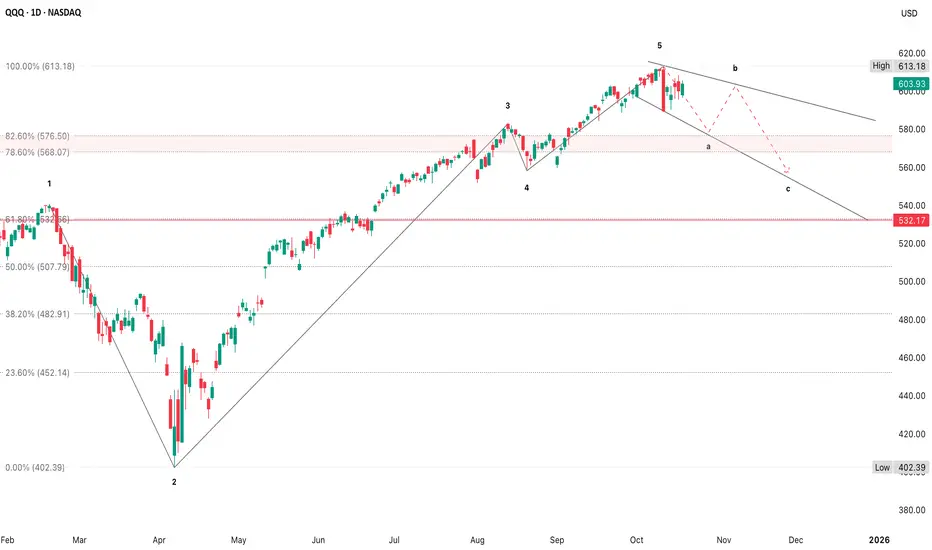
Bull Losing Strength after Six Months of GainsWe may have a double or triple top before breaking down and having a 10% correction. Prior resistance post-election was $540 and the market blew through that level since April without stopping. Should be a support level.

October 20 - 24 2025
1. Macro
Due to the government shutdown inflation-indexed bond data is delayed, however what we are seeing based on data from Thursday (as shown on the white vertical line) suggests that forward inflation expectations $(US10Y+US03MY)/2-DFII10 may be reverting back to the mean, which is supported

QQQ Probable RetracementThe current leg (mid-2025 onward) is the steepest recovery yet & that slope just broke
This indicates a possible mean reversion phase rather than another leg up
Steep advance > rounding top > 8-12% correction
Then a multi-month basing period before recovery
If that rhythm repeats, the current
QQQ Early Topping BehaviorShort-term momentum is stretched so watch for a potential pullback to $608 then $603 if selling follows through
1. Price vs MTD VWAP
MTD VWAP ≈ $603.7, with +1σ ≈ $611 & +2σ ≈ $613
QQQ is pressing the upper (+2σ) edge of the VWAP envelope & that’s statistically extended
Historically, price rar
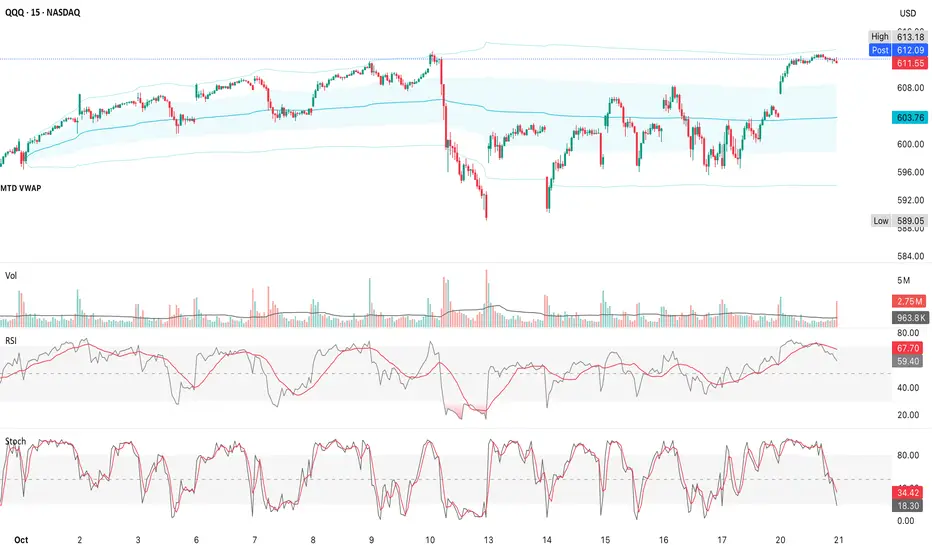
QQQ Failed PullbackOn a 15m chart, a bullish pennant is usually a 1-3 day setup, with the actual breakout move finishing within the same or next trading session
The breakout should occur before price drifts beyond two-thirds of the way to the apex of the pennant
If nothing happens after that, it’s likely morphing

Global Financial Markets and Their StructureIntroduction
The global financial market represents the interconnected network of institutions, systems, and instruments through which money and capital flow across borders. It forms the backbone of the world economy, enabling governments, corporations, and individuals to raise capital, invest, tra
See all ideas
Displays a symbol's price movements over previous years to identify recurring trends.
Frequently Asked Questions
An exchange-traded fund (ETF) is a collection of assets (stocks, bonds, commodities, etc.) that track an underlying index and can be bought on an exchange like individual stocks.
A2JNFS assets under management is 342.70 B EUR. AUM is an important metric as it reflects the fund's size and can serve as a gauge of how successful the fund is in attracting investors, which, in its turn, can influence decision-making.
Since ETFs work like an individual stock, they can be bought and sold on exchanges (e.g. NASDAQ, NYSE, EURONEXT). As it happens with stocks, you need to select a brokerage to access trading. Explore our list of available brokers to find the one to help execute your strategies. Don't forget to do your research before getting to trading. Explore ETFs metrics in our ETF screener to find a reliable opportunity.
A2JNFS invests in stocks. See more details in our Analysis section.
A2JNFS expense ratio is 0.20%. It's an important metric for helping traders understand the fund's operating costs relative to assets and how expensive it would be to hold the fund.
No, A2JNFS isn't leveraged, meaning it doesn't use borrowings or financial derivatives to magnify the performance of the underlying assets or index it follows.
Yes, A2JNFS pays dividends to its holders with the dividend yield of 0.46%.
A2JNFS shares are issued by Invesco Ltd.
A2JNFS follows the NASDAQ 100 Index. ETFs usually track some benchmark seeking to replicate its performance and guide asset selection and objectives.
The fund started trading on Mar 10, 1999.
The fund's management style is passive, meaning it's aiming to replicate the performance of the underlying index by holding assets in the same proportions as the index. The goal is to match the index's returns.