Glencore Wave Analysis – 26 September 2025Glencore Wave Analysis – 26 September 2025
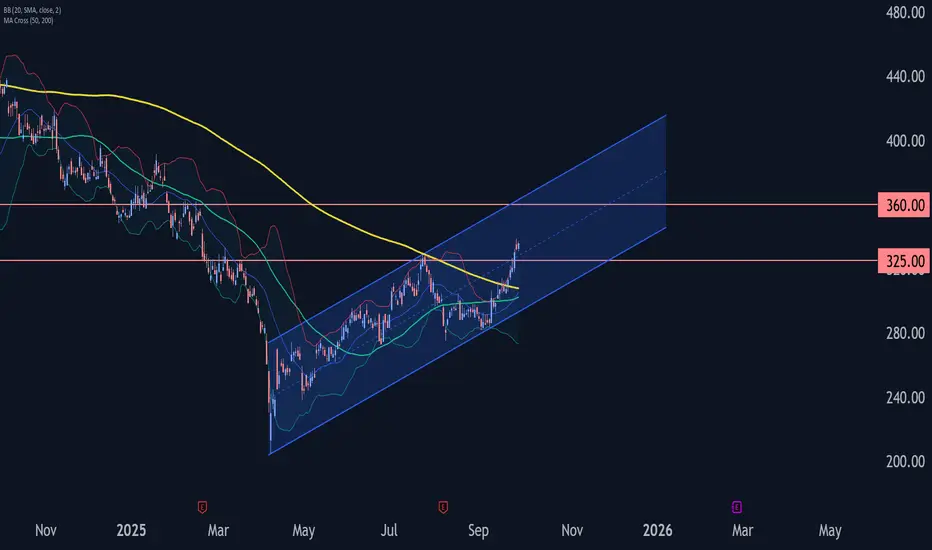
Glencore: ⬆️ Buy
- Glencore broke key resistance level 325.00
- Likely to rise to resistance level 360.00
Glencore recently broke above the key resistance level 325.00 (which stopped wave (A) at the end of July, as can be seen from the daily Glencore ch
Next report date
—
Report period
—
EPS estimate
—
Revenue estimate
—
−0.15 GBP
−1.28 B GBP
180.76 B GBP
9.60 B
About Glencore plc
Sector
Industry
CEO
Gary Nagle
Website
Headquarters
Baar
Founded
1974
ISIN
JE00B4T3BW64
FIGI
BBG001MM1KV4
Glencore Plc engages in the production and marketing of metal, mineral, and energy and agricultural commodities. The firm serves the automotive, steel, power generation, battery manufacturing, and oil sectors. It operates through the following segments: Marketing, Industrial, and Corporate and Other. The Marketing segment includes net sale and purchase of physical commodities, and provision of marketing and related value-add services. The Industrial segment deals with the sale of physical commodities over the cost of production and/or cost of sales. The Corporate and Other segment represents group related income and expenses. The company was founded in 1974 and is headquartered in Baar, Switzerland.
Related stocks
Our opinion on the current state of GLENCORE(GLN)Glencore (GLN) describes itself as, "...one of the world’s largest global diversified natural resource companies and a major producer and marketer of more than 90 commodities." The group's operations comprise around 150 mining and metallurgical sites, oil production assets, and agricultural faciliti

$GLEN ( Glencore ) Good entry or falling knife? idea shown above.. falling out of the channel and possibly further downside risk

$JSEGLN - Glencore: How Far Can The Fifth Wave Go?See link below for previous analysis.
Glencore did not take long to reverse after the previous analysis.
The stock was in a hurry and did not go low enough to test the lower support channel.
The strong reversal from 8708 has prompted an update with wave labelled as a zigzag pattern and price has

Potential BUY !Details are on the chart to make it easier to follow the idea. This is not an advise to buy or sell the stock, sharing my knowledge. what are your thoughts?

GLENCORE Analysis - Continuous, Just as the Markets !This is a Thread, so Follow for Technical Analysis performed with TrapZone Pro & UMVD Indicators.
* Trend is Based on TrapZone Color
* Bar Colors give us Momentum Green from strong Up Moves. Red Bars point to strong Down Moves.
* Red UMVD = Selling Pressure & Green UMVD = Buying Pressure. Purple is

Our opinion on the current state of GLENCORE(GLN)Glencore, one of the world's largest global diversified natural resource companies, manages over 150 mining, metallurgical, oil production, and agricultural facilities across more than 50 countries. The company's extensive global presence and diverse commodity portfolio make it less volatile compare

$JSEGLN - Glencore: Triangle Invalidated; Re-look At The Big PicSee link below for previous analysis.
After prolonged sideways movement, price broke below 9230 invalidating the triangle outlook.
This has prompted me to label the advance from 7920 to 12433 as wave (5).
A look at the bigger picture fits an impulse as the five wave advance from 2254 to 12433 for

GLENCORE - Range IDEAThe stock is finding support around the R97-99 zone with at RSI which has turned up off oversold territory.
We could possibly have a leg up initially to the 200dma then the top of range at R110.
I'm happy to hold long while R95 holds on any daily close.

Glencore Facing HeadwindsGlencore is in the timing for a daily cycle low, price action has carved out a symmetrical triangle that can break either way. Our guide is the previous cycle low with a price of R99.03, anytime we go below this price we know the trend has turned bearish. We also see the megaphone pattern going back

See all ideas
Summarizing what the indicators are suggesting.
Neutral
SellBuy
Strong sellStrong buy
Strong sellSellNeutralBuyStrong buy
Neutral
SellBuy
Strong sellStrong buy
Strong sellSellNeutralBuyStrong buy
Neutral
SellBuy
Strong sellStrong buy
Strong sellSellNeutralBuyStrong buy
An aggregate view of professional's ratings.
Neutral
SellBuy
Strong sellStrong buy
Strong sellSellNeutralBuyStrong buy
Neutral
SellBuy
Strong sellStrong buy
Strong sellSellNeutralBuyStrong buy
Neutral
SellBuy
Strong sellStrong buy
Strong sellSellNeutralBuyStrong buy
Displays a symbol's price movements over previous years to identify recurring trends.
GLCNF5781838
Glencore Funding LLC 5.893% 04-APR-2054Yield to maturity
5.94%
Maturity date
Apr 4, 2054
GLCNF5781834
Glencore Funding LLC 5.634% 04-APR-2034Yield to maturity
5.87%
Maturity date
Apr 4, 2034
USU37786AD9
Glencore Funding LLC 3.875% 27-APR-2051Yield to maturity
5.76%
Maturity date
Apr 27, 2051
USC98874AK3
Glencore Finance (Canada) ltd. 5.55% 25-OCT-2042Yield to maturity
5.74%
Maturity date
Oct 25, 2042
GLCNF6040129
Glencore Funding LLC 6.141% 01-APR-2055Yield to maturity
5.71%
Maturity date
Apr 1, 2055
7Z3A
Glencore Funding LLC 3.875% 27-APR-2051Yield to maturity
5.71%
Maturity date
Apr 27, 2051
USU37818BD9
Glencore Funding LLC 3.375% 23-SEP-2051Yield to maturity
5.69%
Maturity date
Sep 23, 2051
USC98874AJ6
Glencore Finance (Canada) ltd. 6.0% 15-NOV-2041Yield to maturity
5.67%
Maturity date
Nov 15, 2041
USC98874AE7
Glencore Finance (Canada) ltd. 6.9% 15-NOV-2037Yield to maturity
5.45%
Maturity date
Nov 15, 2037
US655422AV5
Glencore Canada Corporation 6.2% 15-JUN-2035Yield to maturity
5.34%
Maturity date
Jun 15, 2035
GLCNF6037050
Glencore Funding LLC 5.673% 01-APR-2035Yield to maturity
5.07%
Maturity date
Apr 1, 2035
See all GLEN bonds
ISFD
iShares PLC - iShares Core FTSE 100 UCITS ETF Accum Hedged USDWeight
1.61%
Market value
288.43 M
USD
Explore more ETFs
Curated watchlists where GLEN is featured.


Frequently Asked Questions
The current price of GLEN is 347.70 GBX — it has increased by 1.93% in the past 24 hours. Watch Glencore plc stock price performance more closely on the chart.
Depending on the exchange, the stock ticker may vary. For instance, on LSE exchange Glencore plc stocks are traded under the ticker GLEN.
GLEN stock has risen by 4.49% compared to the previous week, the month change is a 22.65% rise, over the last year Glencore plc has showed a −19.57% decrease.
We've gathered analysts' opinions on Glencore plc future price: according to them, GLEN price has a max estimate of 424.38 GBX and a min estimate of 307.51 GBX. Watch GLEN chart and read a more detailed Glencore plc stock forecast: see what analysts think of Glencore plc and suggest that you do with its stocks.
GLEN reached its all-time high on Jan 18, 2023 with the price of 584.50 GBX, and its all-time low was 66.65 GBX and was reached on Sep 28, 2015. View more price dynamics on GLEN chart.
See other stocks reaching their highest and lowest prices.
See other stocks reaching their highest and lowest prices.
GLEN stock is 1.93% volatile and has beta coefficient of 1.46. Track Glencore plc stock price on the chart and check out the list of the most volatile stocks — is Glencore plc there?
Today Glencore plc has the market capitalization of 41.08 B, it has increased by 3.37% over the last week.
Yes, you can track Glencore plc financials in yearly and quarterly reports right on TradingView.
Glencore plc is going to release the next earnings report on Feb 25, 2026. Keep track of upcoming events with our Earnings Calendar.
GLEN earnings for the last half-year are 0.01 GBX per share, whereas the estimation was 0.02 GBX, resulting in a −62.50% surprise. The estimated earnings for the next half-year are 0.11 GBX per share. See more details about Glencore plc earnings.
Glencore plc revenue for the last half-year amounts to 85.52 B GBX, despite the estimated figure of 77.73 B GBX. In the next half-year revenue is expected to reach 83.51 B GBX.
GLEN net income for the last half-year is −505.13 M GBP, while the previous report showed −1.09 B GBP of net income which accounts for 53.46% change. Track more Glencore plc financial stats to get the full picture.
As of Oct 6, 2025, the company has 150 K employees. See our rating of the largest employees — is Glencore plc on this list?
EBITDA measures a company's operating performance, its growth signifies an improvement in the efficiency of a company. Glencore plc EBITDA is 7.52 B GBP, and current EBITDA margin is 4.51%. See more stats in Glencore plc financial statements.
Like other stocks, GLEN shares are traded on stock exchanges, e.g. Nasdaq, Nyse, Euronext, and the easiest way to buy them is through an online stock broker. To do this, you need to open an account and follow a broker's procedures, then start trading. You can trade Glencore plc stock right from TradingView charts — choose your broker and connect to your account.
Investing in stocks requires a comprehensive research: you should carefully study all the available data, e.g. company's financials, related news, and its technical analysis. So Glencore plc technincal analysis shows the strong buy rating today, and its 1 week rating is buy. Since market conditions are prone to changes, it's worth looking a bit further into the future — according to the 1 month rating Glencore plc stock shows the sell signal. See more of Glencore plc technicals for a more comprehensive analysis.
If you're still not sure, try looking for inspiration in our curated watchlists.
If you're still not sure, try looking for inspiration in our curated watchlists.