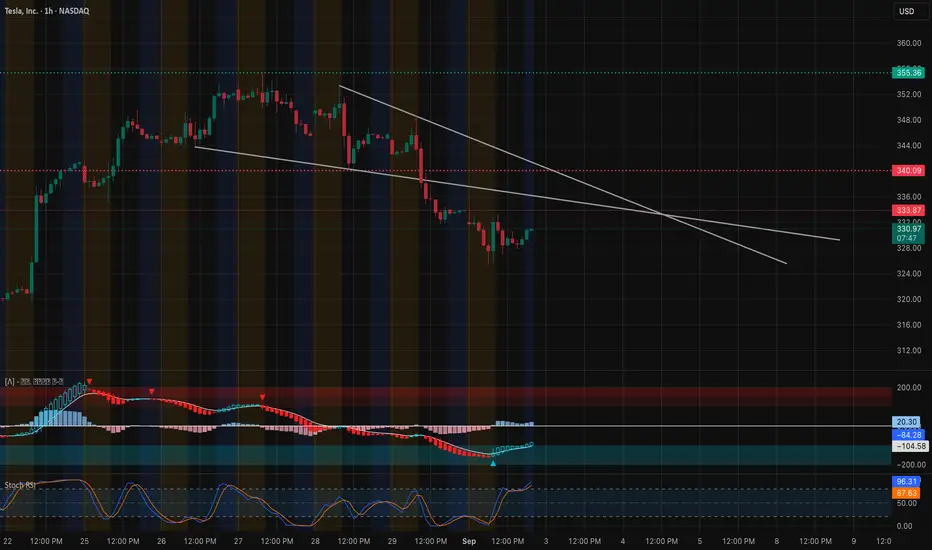
TSLA Technical Analysis-September 3Tesla remains in a short-term downtrend, capped by descending resistance lines. Price is hovering around 330, trying to base after multiple failed rallies. MACD is curling higher, showing early bullish divergence, while the Stoch RSI is lifting from oversold, suggesting some room for upside momentum if buyers step in.
* Resistance:
* First test sits at 333–335, right at descending trendline resistance.
* If cleared, the next upside targets are 342.5 → 345, with stronger supply stacked at 350–355.
* Support:
* Immediate support is 325, reinforced by the put wall.
* A breakdown below opens risk into 322.5 and deeper toward 315–314, which marks the recent swing low and key defense for bulls.
Trend remains pressured, but signs of stabilization are emerging — bulls need to reclaim 335 to start shifting momentum.
🔍 Options / GEX Confirmation
* Resistance Clusters:
* 335 confirmed as resistance by options flow.
* Above that, 345–350 aligns with major call walls, matching chart supply zones.
* Support Layers:
* 325 → strong put support.
* 322.5 and 320 → layered GEX support levels.
* 315 → final line of defense; losing this risks accelerating downside.
This confirms the chart setup: TSLA is boxed between 325–335, with the next directional break likely defining momentum into next week.
🎯 Trade Scenarios
* Bullish: Break above 335 with volume → upside targets 342.5 → 345 → 350.
* Bearish: Rejection at 333–335 and failure to hold 325 → opens downside to 322.5 → 315.
🧠 Final Take
TSLA is at a decision zone between 325–335. Bulls defending 325 and breaking 335 could spark a rally into the 340s, but failure to hold support risks a retest of 315. Options data confirms these levels as the critical battlegrounds.
0R0X trade ideas
TESLA Bullish Wave C still underway...NASDAQ:TSLA is a tough count, the entire macro chart looks like a complex correction (wave 4?) with many series of 3 wave structures.
A triangle in wave B of the current wave appears complete, leading to a terminal thrust up with a target of the High Volume Node resistance at $410 followed by a poke above the swing high touching the R1 pivot at $548.
RSI remains at the EQ.
Analysis is invalidated below the wave B triangle.
Safe trading

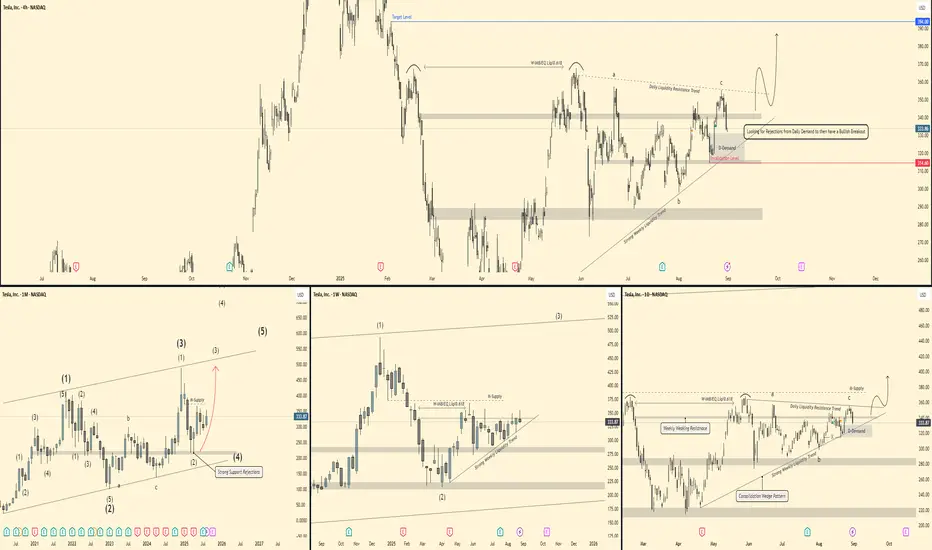
Tesla - Mutli-timeframe breakdown 🕰 Monthly View
Price is respecting a long-term ascending channel.
Strong rejections from support confirm bullish momentum.
Current wave count suggests we are working through a larger impulsive structure – potential for Wave (3) continuation higher.
If momentum holds, upside could target the 450–500 zone in the longer run.
📆 Weekly View
Structure shows a 3-wave correction complete (ABC) into demand.
Price has tapped weekly demand + liquidity trendline.
Currently bouncing, with a breakout potential toward 375–400 (supply zone).
Breakout of the wedge pattern would confirm strength and continuation higher.
📅 Daily View
Price is reacting off Daily Demand (≈320–325 zone).
Strong liquidity resistance trend overhead (≈355–365).
If rejections hold and demand stays valid, a bullish breakout setup forms → target near 390–400.
Invalidation if we close below 314 (daily demand break).
⏱ 4H View
Local liquidity sweep into demand.
Bullish scenario: push toward 350–355 short-term.
Watch for confirmation: rejection candles + momentum shift needed before entry.
🎯 Bias & Trade Idea
Bias: Bullish (buy from demand)
Entry Zone: 320–330 (Daily Demand)
Targets:
Short-term → 355
Mid-term → 390–400
Invalidation: Daily close below 314
⚠️ Risk Note
Tesla is highly volatile. Stick to clear confirmations at demand before entry, and manage risk tightly below invalidation.
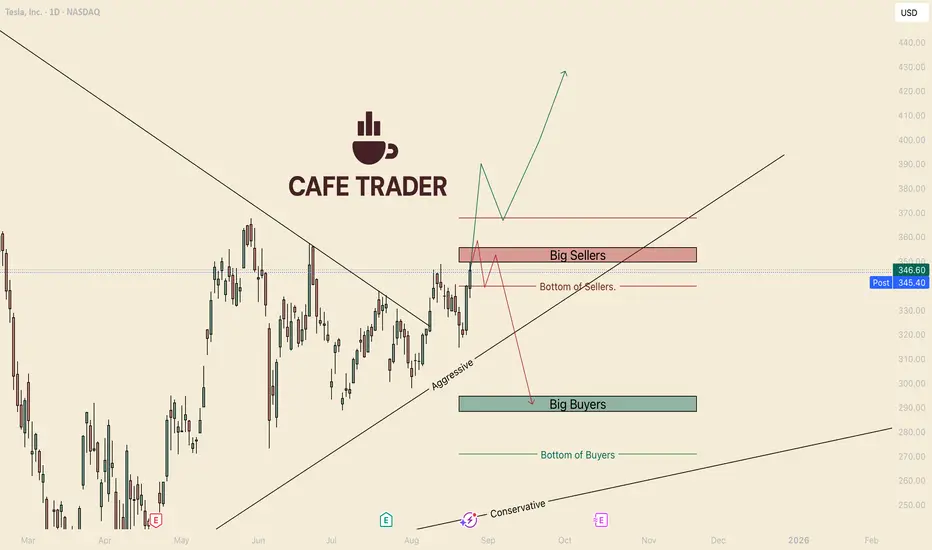
TESLA's Make it or Break it WeekHello I am the Cafe Trader.
Today we are taking another look at Tesla. Everyone knows what a beast this has been in the past, I am going to prep you on what to do when awakens.
As of today, we sit under the last strong seller before the 400's, breaking this and holding (a close above on a Friday) would make a strong case to test highs (minimum).
Overall, I still think there is a strong case for the downside, but this seller determines everything. This is due to the time we have been in the top of the range. So here are your two scenarios
Green Scenario
If Tesla can push through the strong seller zone (roughly 350–365) and actually close above it, then bulls would gain full control. That opens the door for a continuation move toward 400+.
If this happens, I will publish some trade ideas with a new chart.
Red Scenario
If This Seller continues to flush out these buyers, this could spark a large reaction to the downside. In that situation we would be looking for a move back into the big buyer zone around 290. A failure there could drag us all the way to the conservative trend line near 270.
Personally I lean short biased in the next 2-4 weeks, Very bullish over the next few years.
Hope you enjoyed, please DM or comment with questions or another stock you would like analyzed.
Happy Trading
@thecafetrader
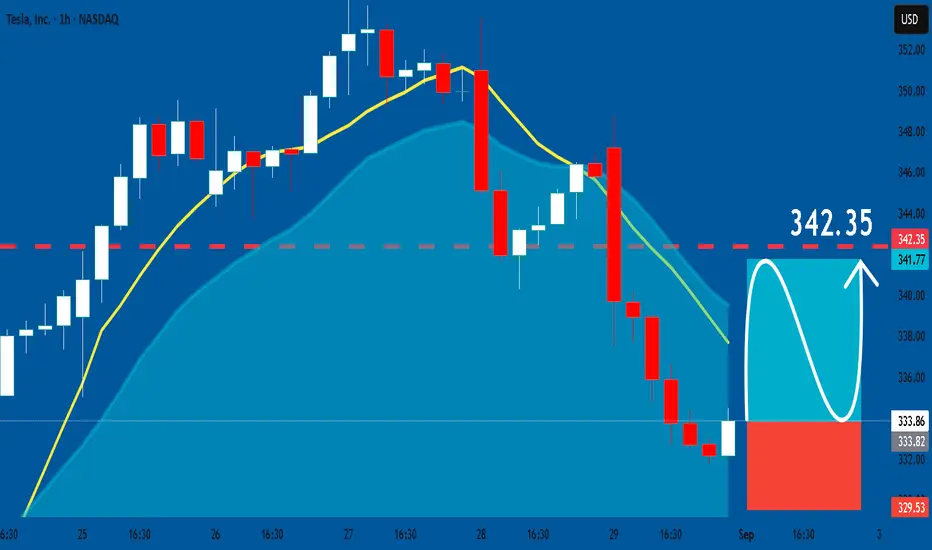
TESLA: Long Trade with Entry/SL/TP
TESLA
- Classic bullish setup
- Our team expects bullish continuation
SUGGESTED TRADE:
Swing Trade
Long TESLA
Entry Point - 333.86
Stop Loss - 329.53
Take Profit - 342.35
Our Risk - 1%
Start protection of your profits from lower levels
Disclosure: I am part of Trade Nation's Influencer program and receive a monthly fee for using their TradingView charts in my analysis.
❤️ Please, support our work with like & comment! ❤️
TESLA Expected Growth! BUY!
My dear friends,
Please, find my technical outlook for TESLA below:
The price is coiling around a solid key level - 333.86
Bias - Bullish
Technical Indicators: Pivot Points High anticipates a potential price reversal.
Super trend shows a clear buy, giving a perfect indicators' convergence.
Goal - 344.59
Safe Stop Loss - 327.03
About Used Indicators:
The pivot point itself is simply the average of the high, low and closing prices from the previous trading day.
Disclosure: I am part of Trade Nation's Influencer program and receive a monthly fee for using their TradingView charts in my analysis.
———————————
WISH YOU ALL LUCK

TSLA: Rising ChannelUnless some super positive sentiment comes out over the long weekend, I think we will hit that $325 support. Maybe even go below it during next week.
As long as we close above $325 for the week or so, We are cleared to head back up within the channel.
Tesla investors need to understand that until we see meaningful change to revenue, Tesla will continue to chop around. That's how things will be on the hourly, daily, and weekly chart. 2026 '27, '28... Just keep buying and accumulate. Just sit and wait. You're future self will kick you for trying to play this any other way.

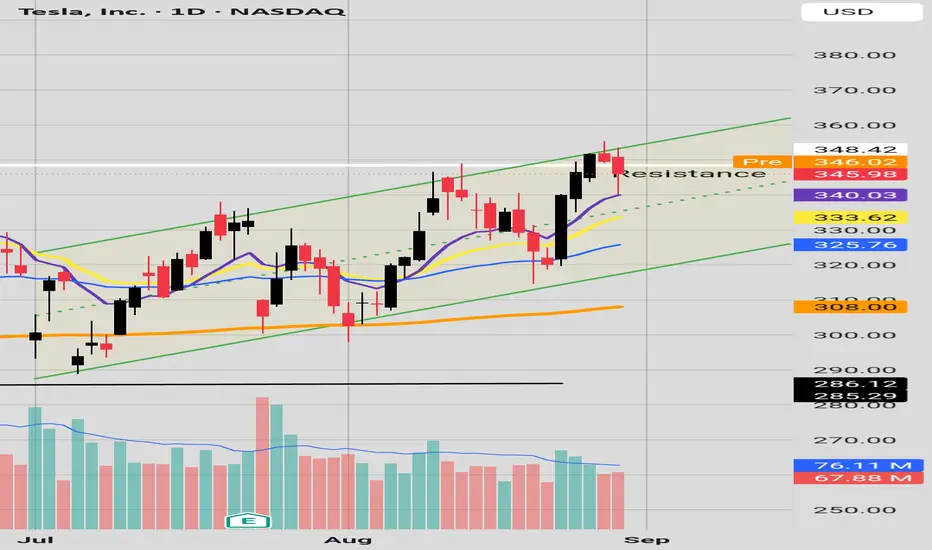
Parallel ChannelWe have Tesala facing resistance on the daily at 345.98 and also resistance in the upward parallel channel. However, the EMA's are lined up nicely 10 in purple 21 in yellow and 50 in blue and 200 in orange. If we get a pullback, hopefully it would just be to the 21 EMA 333.62 and maybe the pull back is over?Let's see if we get a bullish candle on the 10 EMA.
Have a nice day
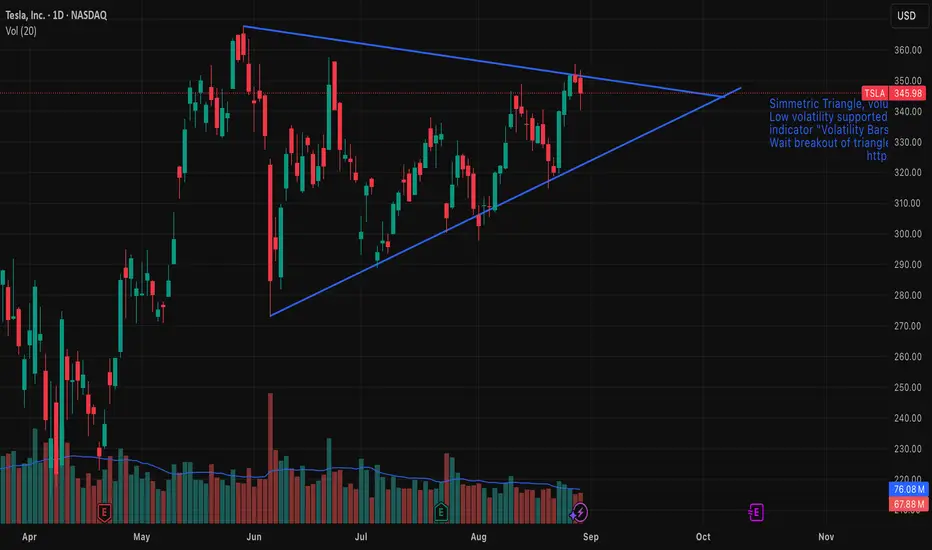
Tesla (TSLA) — Symmetrical Triangle Breakout IdeaSummary
Pattern: Symmetrical triangle on daily chart.
Expected timeframe for breakout: Within 1–2 weeks.
Targets: $367 on an upside breakout; $273 on a downside breakout.
Risk management: Use a stop-loss just outside the triangle after breakout confirmation; position size per your risk rules.
Setup & Rationale
A well-defined symmetrical triangle has formed on TSLA’s price action, characterized by converging trendlines connecting lower highs and higher lows. Volume has contracted inside the pattern, consistent with consolidation. Symmetrical triangles are neutral continuation/reversal patterns; the breakout direction provides the trading signal.
Key technical points:
Price is approaching the apex, increasing the likelihood of a decisive breakout in the next 1–2 weeks.
Volume decline during the consolidation and a volume spike on breakout would confirm conviction.
The breakout should be taken after a daily close beyond the upper or lower trendline (or after a retest), not merely intraday probes.
Entry Criteria
Upside trade: Enter long on a daily close above the upper trendline (or on a confirmed retest).
Downside trade: Enter short on a daily close below the lower trendline (or on a confirmed retest).
Targets & Measurement
Measure the pattern height (vertical distance between the initial high and low of the triangle) and project it from the breakout point.
Upside target (projected): $367.
Downside target (projected): $273.
Adjust targets proportionally if you use a measured move from the actual breakout point rather than the pattern’s maximum height.
Stops & Risk Management
Place stop-loss slightly outside the opposite trendline or beyond a recent swing point to avoid false breakouts.
Preferred approach: fixed-risk percent per trade (e.g., 1–2% of portfolio) and scale position size accordingly.
Consider tightening stops to breakeven after price clears ~50% of the distance to the target.
Confirmation: daily close beyond trendline plus above-average volume (up or down depending on direction).
Symmetrical triangles are neutral; false breakouts occur. Wait for confirmation.
News, earnings, or market-wide events can invalidate technical setups quickly—monitor catalysts.
Adjust targets/stops if volatility expands or if the breakout lacks volume confirmation.
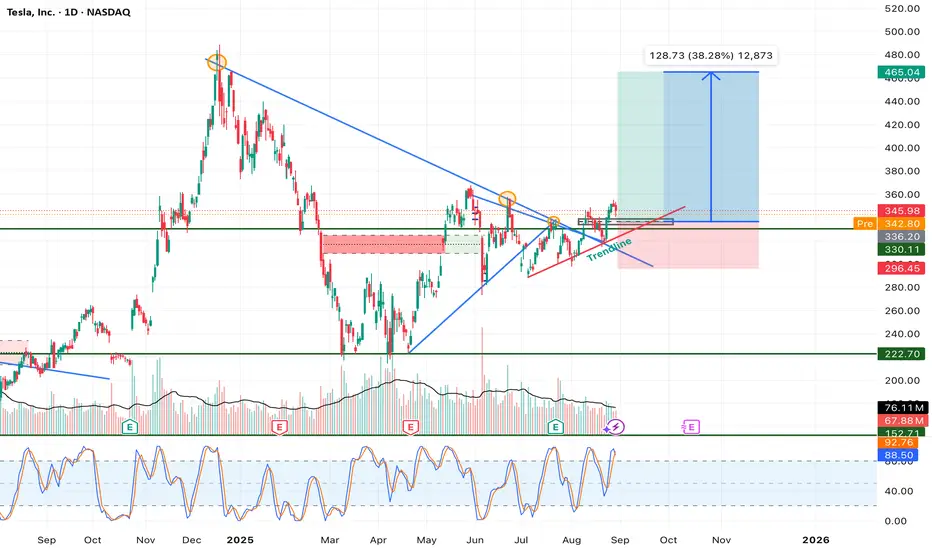
Tesla – Symmetrical Triangle Breakout With 38% Upside PotentialTesla (TSLA) has been consolidating for several months within a symmetrical triangle formation, bounded by a descending resistance trendline from the November 2024 high and an ascending support trendline from the April 2025 low. This consolidation has now resolved with a breakout above resistance, suggesting the start of a new bullish leg.
Technical Breakdown:
1. Symmetrical Triangle Formation:
• Price compressed into tighter ranges, with lower highs and higher lows converging.
• Breakout occurred above the descending trendline, confirming bullish bias.
2. Volume Confirmation:
• Breakout was accompanied by a noticeable uptick in buying volume, strengthening the validity of the move.
• Historical patterns show Tesla often rallies strongly after high-volume breakouts from consolidation zones.
3. Support & Resistance Zones:
• Immediate support: $336 (former resistance turned support, aligned with trendline retest).
• Stronger support: $296 (previous demand zone, key invalidation level).
• Resistance target: $465 (measured move from triangle breakout, aligning with prior swing levels).
4. Momentum Indicators:
• Stochastic RSI is rebounding from oversold territory, suggesting fresh buying momentum.
• MACD (not shown on chart but implied) likely supports bullish crossover given recent price action.
5. Risk-to-Reward Setup:
• Entry: $340–$345 zone after breakout retest.
• Stop Loss: Below $296 (breakdown invalidation).
• Target: $465 (38% upside potential from current levels).
• Risk/reward ratio favors long positions with significant asymmetry.
Trade Thesis:
The breakout from a well-defined symmetrical triangle suggests a continuation of Tesla’s mid-term bullish trend. The measured move projection points toward ~$465, representing a potential 38% rally from current prices. As long as price sustains above the $336–$340 support zone, bulls remain in control. A breakdown below $296 would invalidate this structure and open the door for a deeper retracement.
Conclusion:
Tesla has entered a critical bullish phase after months of consolidation. With volume confirmation, favorable risk-to-reward, and momentum recovery, the path of least resistance is higher. Upside targets sit near $465, with invalidation set at $296.
NASDAQ:TSLA
Tesla : A Symmetrical Triangle and Bullish Flag formation Disclaimer : Do your own research before investing. This is just a chart analysis. No recommendation to buy and sell.
Tesla company does not require any Introduction, Market leader in tech innovation.
Charts of Tesla is looking interesting where A Symmetrical Triangle and Bullish Flag formation is getting in place.
Tesla is having support around $300 mark and higher side is $488. will it regain that level again. Not one know about it. However, its getting in consolidation.
Current price of Tesla is $345 and one can look to $370 for near term.
Possible retrace before upside moveThe initial upward move from 214 is corrective in nature. Since the current correction to 273 doesn't seem to be proper ABC correction, I am expecting further C wave correction to the Green box. Breaking the Red Box and the trendline with a retest will invalidate further downward correction. Based on the Major Indexes structure, I am not expecting Tesla to retrace below 213 as depicted by red line .
Note
**Disclaimer** : All details shared here is for educational purpose only. Please do your own research and consider appropriate risk management before making short term or long-term investment decisions.
Approach Market always with probabilities and make sure risk management in place.
Request your support by like, comment and follow

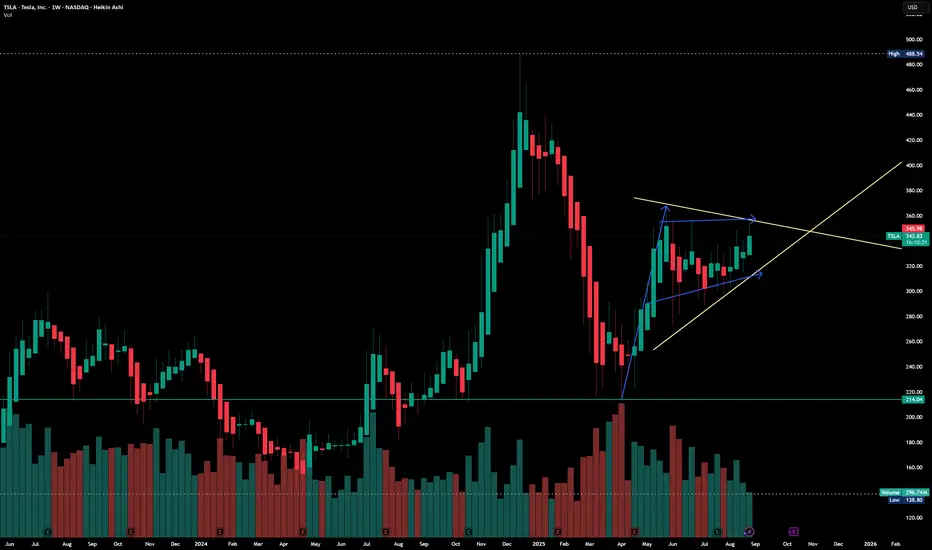
WXY structure with a double topTesla has been in a uptrend with a corrective structure WXY. I am not sure if the WXY is a part of wave 5 terminal structure or a B wave. However expecting a double top or 78.6 retrace to 425-430 range as a minimum. For this scenario, an impulsive upside move is expected within the next few weeks. However the price needs to move back into the channel next week as a first step.

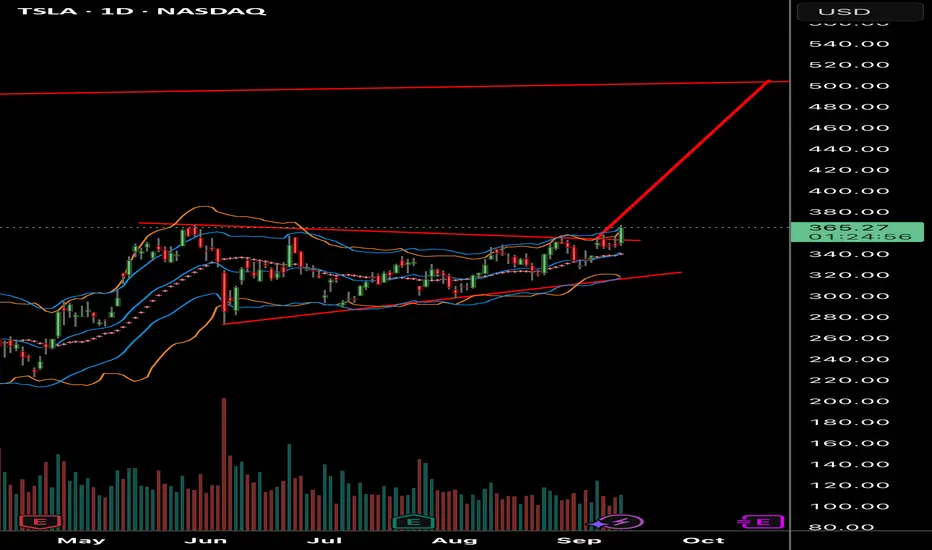
$TSLA - channel breakout on the daily. possible $400 soonTSLA - Stock finally seeing channel breakout after long consolidation. calls above $370 looking good for a move towards $378 and $400. Stock is decent at indicator. needs to hold $365 to hold the breakout move.

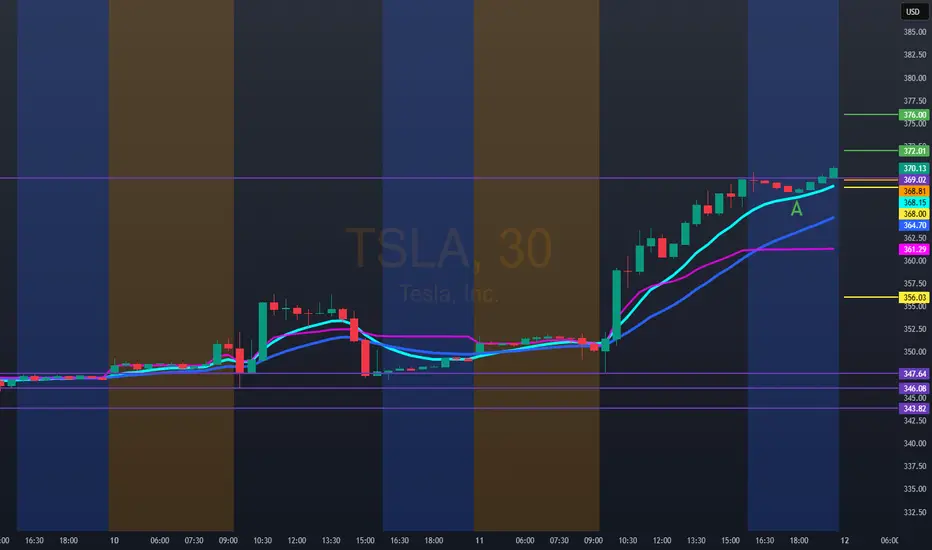
Hello trader, nice to meet you. For tomorrow, TSLA: 368.81we have a bullish entry at 372.00/376.00. Next, a possible target is 385.00/390.00. For better control of your stop, you can use the VWAP.
Bearish technical entry at 368.00. If you lose, this area could reach the 356.00 zone with a possible rebound. It's important to keep in mind that September is often a negative month for TSLA.
TSLA about to POPClear play that I’ve been sharing with friends and it’s playing out perfectly so far
TESLA Lagging BehindA compelling reason to buy Tesla stock now—despite it being beaten down—is the asymmetric risk-reward setup driven by its depressed valuation relative to long-term growth potential. Sentiment is currently low due to concerns about EV demand, competition, and Elon’s distractions, but this pessimism is largely priced in. Meanwhile, Tesla still holds massive optionality: AI-driven autonomy, energy storage, and Dojo supercomputing. If even one of these verticals scales meaningfully, current prices may prove a generational entry.
At the moment, we are hitting some of my key support levels being the anchored vwap from the low , as well as the previous Value Area High range retest within the formation of this broader triangle, suggesting a potential continuation to the upside should we get a strong breakout.
I will be watching for further down side as the current risk is only approx 6-7% for a potential upside of 60%-70% , a massive Risk to reward.
Should this reclaim the downtrend vwap, it can be a strong sign of strength for this stock to move back to ATH's as tesla is massively lagging behind.

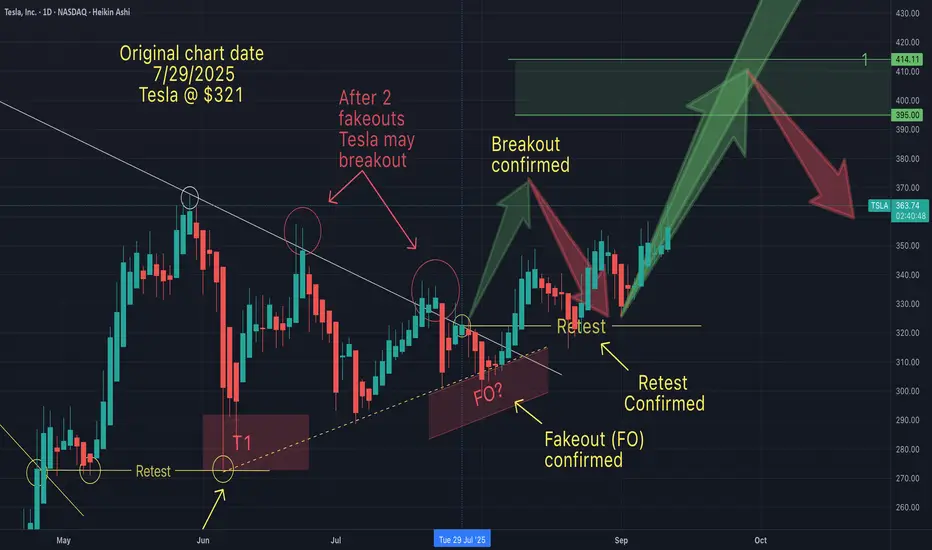
Is Tesla on it's way to $400+On July 29th I suggested that Tesla was about to break out to the upside (after fakeouts).
Then on Sep 4th I suggested that after a restest (of the breakout line), Tesla would begin its climb. This portion of the anticipated pattern now been confirmed.
One question now remains...will Tesla hit my T1 ($395 - $414).
What do you think? I'd like to know what the sentiment is out there. I'd like to hear your thoughts.
Geopolitical Tensions & Trade Wars1. Understanding Geopolitical Tensions
Definition
Geopolitical tensions refer to conflicts or rivalries between nations that arise from differences in political systems, territorial claims, military strategies, or economic interests. These tensions often extend beyond diplomacy into military confrontations, sanctions, cyber warfare, and trade restrictions.
Key Drivers of Geopolitical Tensions
Territorial disputes – e.g., South China Sea, India-China border, Israel-Palestine conflict.
Resource competition – oil, natural gas, rare earth minerals, and even water supplies.
Ideological differences – democracy vs. authoritarianism, capitalism vs. socialism.
Technological dominance – battles over 5G, semiconductors, and artificial intelligence.
Strategic influence – the U.S. vs. China in Asia-Pacific, Russia vs. NATO in Eastern Europe.
Geopolitical tensions may not always escalate into war, but they often manifest as economic weapons, including tariffs, sanctions, and restrictions on trade.
2. What Are Trade Wars?
Definition
A trade war is an economic conflict between nations where countries impose tariffs, quotas, or other trade barriers against each other, often in retaliation. Instead of cooperating in the free exchange of goods and services, they use trade as a weapon to gain leverage.
Mechanisms of Trade Wars
Tariffs – taxes on imported goods (e.g., U.S. tariffs on Chinese steel).
Quotas – limits on the number of goods imported (e.g., Japan’s rice import restrictions).
Subsidies – financial aid to domestic industries, making exports cheaper.
Export controls – restricting key goods, like semiconductors or defense equipment.
Sanctions – blocking trade altogether with specific countries or entities.
Difference Between Trade Dispute and Trade War
A trade dispute is usually limited and negotiable (resolved via WTO).
A trade war escalates into repeated rounds of retaliatory measures, often causing collateral damage to global supply chains.
3. Historical Background of Trade Wars
Mercantilism in the 16th–18th centuries – European powers imposed heavy tariffs and colonized territories to control resources.
Smoot-Hawley Tariff Act (1930, USA) – raised tariffs on over 20,000 goods, worsening the Great Depression.
Cold War Trade Restrictions (1947–1991) – U.S. and Soviet blocs limited economic interaction, fueling technological and arms races.
Japan-U.S. Trade Tensions (1980s) – disputes over Japanese car and electronics exports to the U.S. led to tariffs and voluntary export restraints.
U.S.-China Trade War (2018–present) – the most significant modern trade war, involving hundreds of billions in tariffs, sanctions, and tech restrictions.
4. Causes of Trade Wars in the Modern Era
Economic Protectionism – shielding domestic industries from foreign competition.
National Security Concerns – restricting sensitive technologies like 5G, AI, and semiconductors.
Geopolitical Rivalry – economic weapons as part of larger power struggles (e.g., U.S. vs. China, Russia vs. NATO).
Unfair Trade Practices Allegations – accusations of currency manipulation, IP theft, or dumping.
Populism & Domestic Politics – leaders use trade wars to appeal to local voters by promising to "bring jobs back home."
5. Case Study: The U.S.-China Trade War
The U.S.-China trade war (2018–present) is the most important example of how geopolitical rivalry shapes global trade.
Phase 1 (2018): U.S. imposed tariffs on $50 billion worth of Chinese goods, citing unfair trade practices and intellectual property theft.
Retaliation: China imposed tariffs on U.S. agricultural products, especially soybeans, targeting American farmers.
Escalation: Tariffs expanded to cover $360+ billion worth of goods.
Technology Restrictions: U.S. banned Huawei and restricted semiconductor exports.
Phase 1 Agreement (2020): China promised to increase U.S. imports, but tensions remain unresolved.
Impact:
Global supply chains disrupted.
Rising inflation due to higher import costs.
Shift of manufacturing from China to Vietnam, India, and Mexico.
U.S. farmers and Chinese exporters both suffered losses.
6. Geopolitical Hotspots Affecting Trade
1. Russia-Ukraine War
Western sanctions cut Russia off from global finance (SWIFT ban, oil & gas restrictions).
Europe shifted away from Russian energy, sparking energy crises.
Global wheat and fertilizer exports disrupted, raising food inflation worldwide.
2. Middle East Conflicts
Oil is a geopolitical weapon—any conflict in the Persian Gulf impacts global crude prices.
OPEC+ decisions are often politically influenced, affecting both producers and consumers.
3. South China Sea
A vital shipping lane ($3.5 trillion in trade passes annually).
Territorial disputes between China and Southeast Asian nations raise risks of blockades.
4. Taiwan & Semiconductors
Taiwan produces over 60% of global semiconductors (TSMC).
Any conflict over Taiwan could paralyze global tech supply chains.
5. India-China Border & Indo-Pacific Rivalries
India bans Chinese apps and tightens investment rules.
Strengthening of Quad alliance (US, India, Japan, Australia) reshapes Asian trade.
7. Impact of Geopolitical Tensions & Trade Wars
1. On Global Economy
Slower global growth due to reduced trade flows.
Inflationary pressures from higher tariffs and supply disruptions.
Increased uncertainty reduces foreign direct investment (FDI).
2. On Businesses
Supply chain realignments (China+1 strategy).
Rising costs of raw materials and logistics.
Technology companies face export bans and restrictions.
3. On Consumers
Higher prices for imported goods (electronics, fuel, food).
Limited choices in the market.
4. On Financial Markets
Stock market volatility increases.
Commodity prices (oil, gold, wheat) spike during conflicts.
Currency fluctuations as investors seek safe havens (USD, gold, yen).
5. On Developing Nations
Export-dependent economies suffer as global demand falls.
Some benefit by replacing disrupted supply chains (e.g., Vietnam, India, Mexico).
8. The Role of International Institutions
World Trade Organization (WTO)
Provides a platform to resolve disputes.
However, its influence has declined due to U.S.-China disputes and non-compliance.
International Monetary Fund (IMF) & World Bank
Provide financial stability during crises.
Encourage open trade but have limited enforcement power.
Regional Trade Agreements
CPTPP, RCEP, EU, USMCA act as counterbalances to global tensions.
Countries diversify trade partnerships to reduce dependence on rivals.
9. Strategies to Manage Geopolitical Risks
Diversification of Supply Chains – "China+1" strategy by multinationals.
Hedging Against Commodity Risks – futures contracts for oil, wheat, etc.
Regionalization of Trade – building self-sufficient trade blocs.
Technology Independence – countries investing in local semiconductor and AI industries.
Diplomacy & Dialogue – ongoing talks via G20, BRICS, ASEAN, and other forums.
10. The Future of Geopolitical Tensions & Trade Wars
Rise of Economic Nationalism: Countries prioritizing local industries over globalization.
Technology Wars Intensify: AI, semiconductors, and green energy will be new battlegrounds.
Fragmentation of Global Trade: Shift from globalization to "regionalization" or "friend-shoring."
Energy Transition Risks: Conflicts over rare earth metals, lithium, and cobalt needed for batteries.
New Alliances: BRICS expansion, Belt & Road Initiative, and Indo-Pacific strategies will reshape global economic influence.
Conclusion
Geopolitical tensions and trade wars are not temporary disruptions but structural features of the modern global economy. While globalization created interdependence, it also exposed vulnerabilities. Trade wars, sanctions, and economic blockades have become powerful tools of foreign policy, often with far-reaching economic consequences.
For businesses and investors, the challenge lies in navigating uncertainty through diversification, resilience, and adaptation. For policymakers, the task is to strike a balance between protecting national interests and sustaining global cooperation.
Ultimately, the world may not return to the hyper-globalization era of the early 2000s. Instead, we are moving toward a multipolar trade system shaped by regional blocs, strategic rivalries, and technological competition. How nations manage these tensions will determine the stability and prosperity of the 21st-century global economy.

Global Government Bond Trading1. Fundamentals of Government Bonds
1.1 What Are Government Bonds?
A government bond is a debt security issued by a country’s treasury or finance ministry to raise money. When an investor buys a government bond, they are lending money to the government in exchange for periodic coupon payments (interest) and repayment of the principal at maturity.
Coupon Bonds: Pay regular interest plus principal at maturity.
Zero-Coupon Bonds: Sold at a discount, repay face value at maturity.
Inflation-Linked Bonds: Adjust coupon/principal with inflation rates.
Savings Bonds / Retail Bonds: Targeted at individual investors.
1.2 Key Features of Government Bonds
Issuer: Sovereign state.
Maturity: Short-term (T-bills), medium-term (notes), long-term (bonds).
Yield: Return investors expect, inversely related to bond price.
Credit Risk: Higher in emerging economies; lower in developed ones.
Liquidity: Developed market bonds (like U.S. Treasuries) are highly liquid, emerging markets less so.
1.3 Importance in Global Finance
Provide a risk-free benchmark rate (e.g., U.S. Treasury yields influence global lending rates).
Used as collateral in repo markets.
Serve as safe-haven assets during crises.
Act as tools for monetary policy (quantitative easing, open market operations).
2. Structure of the Global Government Bond Market
2.1 Primary Market
This is where governments issue new bonds via auctions or syndications. Investors bid for these securities, and the government raises capital.
Auction System: Used by the U.S., UK, Japan. Competitive and non-competitive bidding.
Syndicated Issuance: Banks underwrite and distribute bonds, common in Europe.
2.2 Secondary Market
Bonds are traded between investors after issuance. This provides liquidity and continuous price discovery.
Over-the-Counter (OTC): Majority of global bond trading occurs OTC via dealers.
Electronic Trading Platforms: Growing importance (e.g., Tradeweb, MarketAxess).
2.3 Major Bond Markets
U.S. Treasuries: World’s largest, deepest, and most liquid government bond market.
Eurozone Bonds: German Bunds are benchmark safe assets, Italian and Spanish bonds carry higher yields.
Japanese Government Bonds (JGBs): Very large market but often low yields.
UK Gilts: Highly liquid, influenced by Bank of England policy.
Emerging Market Bonds: Offer higher yields but with currency and default risks (Brazil, India, South Africa).
3. Key Participants in Global Government Bond Trading
3.1 Central Banks
Major holders and buyers of government debt.
Conduct monetary policy through bond purchases (QE) or sales.
Hold government bonds as foreign reserves.
3.2 Institutional Investors
Pension funds, insurance companies, and mutual funds allocate heavily to sovereign debt for predictable returns.
3.3 Hedge Funds & Proprietary Traders
Trade bonds to profit from interest rate changes, arbitrage opportunities, or global macro strategies.
3.4 Foreign Governments & Sovereign Wealth Funds
Invest in foreign government bonds for diversification and reserve management.
3.5 Retail Investors
Participate via government savings bonds, ETFs, and mutual funds.
4. Trading Mechanisms
4.1 Cash Market Trading
Direct purchase/sale of government bonds in the secondary market.
Prices fluctuate with interest rates, inflation expectations, and credit risk.
4.2 Derivatives Market
Futures, options, and swaps based on government bonds or yields.
Example: U.S. Treasury futures (CME), Bund futures (Eurex).
4.3 Repo Market
Repurchase agreements use government bonds as collateral.
Essential for liquidity in the global financial system.
4.4 Electronic Platforms & Algorithmic Trading
Rapid growth in e-trading platforms.
Algorithmic and high-frequency trading now account for a significant share.
5. Factors Affecting Government Bond Prices and Yields
5.1 Interest Rates
Bond prices move inversely with interest rates. Central bank policy shifts directly impact yields.
5.2 Inflation
High inflation reduces real returns, pushing yields higher. Inflation-indexed bonds mitigate this risk.
5.3 Economic Growth
Stronger growth can lead to higher yields due to expectations of rate hikes.
5.4 Fiscal Deficits & Debt Levels
Higher government borrowing can push yields upward due to increased supply and perceived risk.
5.5 Currency Movements
Foreign investors consider exchange rate risks; weaker local currency may deter bond purchases.
5.6 Geopolitical Risk
Wars, sanctions, and political instability drive safe-haven flows into bonds of stable nations.
6. Global Government Bond Trading Strategies
6.1 Buy and Hold
Conservative investors, like pension funds, hold bonds to maturity for stable income.
6.2 Yield Curve Strategies
Steepener: Betting long-term rates rise faster than short-term.
Flattener: Opposite bet.
Butterfly Trades: Exploiting mid-term vs short/long-term curve differences.
6.3 Relative Value / Arbitrage
Traders exploit mispricing between different government bonds.
Example: Spread between U.S. Treasuries and German Bunds.
6.4 Global Macro Plays
Hedge funds trade bonds based on global interest rate cycles, inflation, and geopolitical events.
6.5 Carry Trade in Bonds
Borrowing in low-yield currencies and investing in higher-yield government bonds elsewhere.
7. Risks in Government Bond Trading
7.1 Interest Rate Risk
Sharp changes in central bank policy can cause bond price volatility.
7.2 Inflation Risk
Unexpected inflation erodes real returns.
7.3 Credit Risk
Even sovereigns can default (examples: Argentina, Greece).
7.4 Liquidity Risk
Smaller bond markets may not provide adequate trading liquidity.
7.5 Currency Risk
Foreign bond investors face exchange rate fluctuations.
7.6 Geopolitical Risk
Trade wars, sanctions, and political instability can disrupt markets.
8. Role of Government Bond Markets in Global Economy
Benchmark Rates: Government bond yields influence corporate borrowing costs.
Safe-Haven Assets: During crises, investors flock to bonds like U.S. Treasuries.
Monetary Transmission: Central bank policies work through bond markets.
Fiscal Policy Financing: Governments rely on bonds for infrastructure and welfare spending.
Global Capital Flows: Sovereign bonds drive cross-border capital allocation.
9. Case Studies in Global Bond Markets
9.1 U.S. Treasury Market
Largest and most liquid in the world (~$25 trillion outstanding).
Yields serve as a global reference for risk pricing.
Highly responsive to Federal Reserve policies.
9.2 European Sovereign Debt Crisis (2010–2012)
Greek, Portuguese, Spanish, and Italian bonds saw yield spikes.
Investors demanded higher compensation for perceived default risk.
ECB intervention (OMT, QE) stabilized the markets.
9.3 Japanese Government Bonds (JGBs)
Extremely low or negative yields for decades due to deflationary pressures.
Bank of Japan’s Yield Curve Control (YCC) dominates the market.
9.4 Emerging Market Bonds
Offer higher yields but riskier (Argentina default, Turkey’s currency crisis).
Depend heavily on foreign investor confidence.
10. Future of Global Government Bond Trading
10.1 Digital Transformation
Rise of electronic trading platforms.
Algorithmic and AI-based trading strategies.
10.2 Green & ESG-Linked Sovereign Bonds
Growing issuance of “green bonds” by governments to fund climate projects.
10.3 Impact of Global Debt Levels
Post-pandemic debt burdens remain high.
Long-term sustainability of government borrowing under scrutiny.
10.4 Geopolitical Realignment
U.S.–China rivalry may reshape global bond investment patterns.
“De-dollarization” efforts could impact U.S. Treasury dominance.
10.5 Central Bank Balance Sheets
Unwinding QE will affect bond market liquidity.
“Higher for longer” interest rate regimes may redefine yield structures.
Conclusion
Global government bond trading is the foundation of modern financial markets. It balances risk and safety, yield and liquidity, domestic policy and international capital flows. From U.S. Treasuries as the world’s risk-free benchmark to the volatile sovereign bonds of emerging markets, this market reflects the health of economies, the credibility of fiscal policy, and the confidence of investors.
In times of crisis, investors flock to safe government bonds. In times of growth, they may chase higher yields elsewhere. But regardless of market cycles, government bond trading remains central to how money moves across borders, how interest rates are set, and how nations finance themselves.
As the world transitions into an era of high debt, climate financing, digital trading, and shifting geopolitics, global government bond markets will only grow in importance. Understanding their mechanics is crucial for traders, investors, policymakers, and anyone seeking to grasp the pulse of global finance.

BMW Puts on the Techie Suit to Challenge Elon🚘️ BMW Puts on the Techie Suit to Challenge Elon
By Ion Jauregui – Analyst at ActivTrades
BMW (Ticker AT:BMW) has fired up its engines in the technology race against Tesla. The Bavarian brand is launching the Neue Klasse, a platform that promises to revolutionize the electric car and will debut with the new iX3, unveiled ahead of the Munich Motor Show.
This is not just another electric SUV: the company has invested more than €10 billion to turn the car into a “superbrain on wheels.” Four central chips manage everything from infotainment to autonomous driving, with 20 times more computing power than current systems. Added to this are headline-grabbing features: 800 kilometers of range and 350 km of charge in just 10 minutes.
BMW, however, does not manufacture its own batteries. Instead, it relies on Chinese giant CATL (SSE:300750), with whom it has developed new cylindrical cells that halve costs and increase energy density. Six gigafactories spread across China, Europe, and North America will guarantee supply.
Shift to E-Mobility
The shift toward electrification does not come without sacrifices. In 2024, the group saw its net profit fall 37%, to €7.68 billion, due to heavy spending on R&D. However, pure EV sales grew 13.5%, supporting the transition.
BMW benefits from structural reductions in battery production costs, a diversified portfolio supported by solid alliances that integrate electric, hybrid, and combustion models under the same digital platform, and a premium positioning that continues to attract loyal customers. The risk lies in massive spending eroding margins at a time when Tesla (Ticker AT:TSLA) and Chinese manufacturers like Xpeng (NYSE:XPEV) are advancing aggressively.
Technical Analysis
BMW shares on the Frankfurt Stock Exchange show a consolidation trend after a volatile 2024 marked by profit cuts. The current key support at €88.18 seems to be holding, while resistance lies between €88.85 and the unbroken highs of €91.72. This resistance has repeatedly pushed the stock back to support levels after each upward attempt. Breaking through current highs would open a path toward €110, and possibly new yearly highs, while a drop below support could shake investor confidence and push the stock toward the Point of Control (POC) around €86.60.
The 50, 100, and 200-day moving averages have contracted sharply over the past month, which could indicate declining confidence if confirmed. On the other hand, the RSI at 42.05% signals oversold conditions, while the MACD is negative but with a histogram turning positive—another possible signal of recovery. Lastly, the ActivTrades Europe Market Pulse indicator shows a contraction back to neutral territory, suggesting investors may be returning to support the market.
BMW (Ticker AT:BMW)
Trend: Bullish in the medium and long term, with potential lateralization or short-term reversal.
Resistance: Strong zone at the highs of €91.72.
Supports: Key levels between €88 and €88.50, with critical supports at €88.22, €88.18, POC €86.60, €85.18, €83.18, €81.60, and €79.70.
Point of Control (POC): €86.60.
Technical Conclusion: Recent sideways consolidation, with upside potential if the €91.50–91.72 zone is broken.
Tesla
Following political frictions between Elon Musk and Trump, Tesla’s stock has been recovering, moving sideways between May and August, with a slightly upward bias within the range of $361.93 to $291.37. A mid-range area has formed around the POC of $311.43, acting as support for the latest rally.
The RSI stands at 53.96%, a relatively neutral level, while the MACD remains neutral with a histogram gradually entering negative territory, pointing to a strong consolidation move. Meanwhile, the ActivTrades US Market Pulse indicates the American market is in extreme RISK-ON, suggesting potential adjustments due to excessive greed.
Tesla (Ticker AT:TSLA)
Current Trend: Short-term bullish recovery after weeks of lateral consolidation, with positive signs from regaining key moving averages.
Resistances: Strong resistance around $361.93, which could open the way toward $420, the next major level lost in February’s death cross.
Supports: Key support at the POC of $311.43, followed by $291.37, $274.75, and $225.58.
Technical Conclusion: Tesla is at a decisive range. A break above recent highs could trigger an upward move toward $420 or beyond. Conversely, a drop below $320 would increase bearish pressure, potentially driving the stock down to test $291.
Conclusion
The Neue Klasse is not just a product launch—it is BMW’s boldest and riskiest bet in decades. The German manufacturer wants to stop being solely a premium icon and transform into a fully-fledged tech player. Elon Musk no longer runs alone: the racetrack is filling up with rivals hungry for disruption.
*******************************************************************************************
The information provided does not constitute investment research. The material has not been prepared in accordance with the legal requirements designed to promote the independence of investment research and such should be considered a marketing communication.
All information has been prepared by ActivTrades ("AT"). The information does not contain a record of AT's prices, or an offer of or solicitation for a transaction in any financial instrument. No representation or warranty is given as to the accuracy or completeness of this information.
Any material provided does not have regard to the specific investment objective and financial situation of any person who may receive it. Past performance and forecasting are not a synonym of a reliable indicator of future performance. AT provides an execution-only service. Consequently, any person acting on the information provided does so at their own risk. Political risk is unpredictable. Central bank actions can vary. Platform tools do not guarantee success.

TSLA: 350 retestThe market is confused. Clarity is needed.
In the very short term $350 is clear. However, with plenty of resistance. Will likely chop, then rise of fall from there.
Long term the vision and execution remains supreme. Revenues will sky rocket, it's only a matter of time. From an investors perspective, I look to buy in times of extreme fear and oversold scenarios. I do nothing at these levels, but I like to stay alert with the price trends.

TSLA (daytrading) small tradeI already entered but didn’t post earlier because I was too busy. You guys can wait for a small pullback tomorrow. Take profit whenever you feel comfortable.
1. Bullish doji candle on the daily (D1).
2. Uptrend still intact on D1 and higher timeframes.
3. Retest of the 50 SMA on D1.
4. Price touched the trendline.
Plan: Buy call options at the closest strike price with expiry this week. Don’t forget to set a stop loss.
