$LLOY : Lloyds Banks UKIn volatile markets, traders can benefit from large jumps in asset prices, if they can be turned into opportunities. Gaps are areas on a chart where the price of a stock (or another financial instrument) moves sharply up or down, with little or no trading in between. As a result, the asset's chart shows a gap in the normal price pattern. The enterprising trader can interpret and exploit these gaps for profit. This article will help you understand how and why gaps occur, and how you can use them to make profitable trades.
Gap Basics
Gaps occur because of underlying fundamental or technical factors. For example, if a company's earnings are much higher than expected, the company's stock may gap up the next day. This means the stock price opened higher than it closed the day before, thereby leaving a gap. In the forex market, it is not uncommon for a report to generate so much buzz that it widens the bid and ask spread to a point where a significant gap can be seen. Similarly, a stock breaking a new high in the current session may open higher in the next session, thus gapping up for technical reasons.
Gaps can be classified into four groups:
Breakaway gaps occur at the end of a price pattern and signal the beginning of a new trend.
Exhaustion gaps occur near the end of a price pattern and signal a final attempt to hit new highs or lows.
Common gaps cannot be placed in a price pattern—they simply represent an area where the price has gapped.
Continuation gaps, also known as runaway gaps, occur in the middle of a price pattern and signal a rush of buyers or sellers who share a common belief in the underlying stock's future direction.
To Fill or Not to Fill
When someone says a gap has been filled, that means the price has moved back to the original pre-gap level. These fills are quite common and occur because of the following:
Irrational exuberance: The initial spike may have been overly optimistic or pessimistic, therefore inviting a correction.
Technical resistance: When a price moves up or down sharply, it doesn't leave behind any support or resistance.
Price Pattern: Price patterns are used to classify gaps and can tell you if a gap will be filled or not. Exhaustion gaps are typically the most likely to be filled because they signal the end of a price trend, while continuation and breakaway gaps are significantly less likely to be filled since they are used to confirm the direction of the current trend.
When gaps are filled within the same trading day on which they occur, this is referred to as fading. For example, let's say a company announces great earnings per share for this quarter and it gaps up at the open (meaning it opened significantly higher than its previous close). Now let's say, as the day progresses, people realize that the cash flow statement shows some weaknesses, so they start selling. Eventually, the price hits yesterday's close, and the gap is filled. Many day traders use this strategy during earnings season or at other times when irrational exuberance is at a high.
LLOY trade ideas

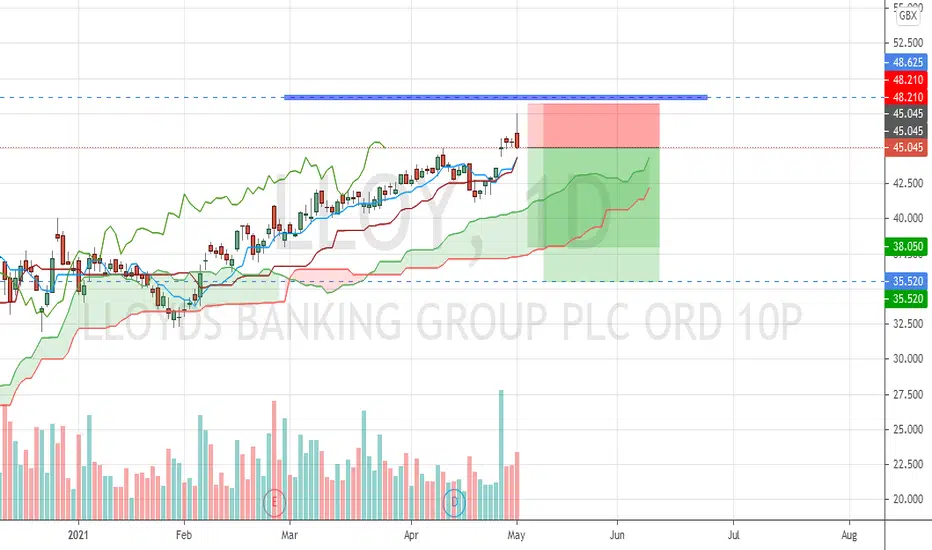
Almost counts!?So my decision zone was the blue zone which is the monthly kijun and weekly ssb, a very strong resistance. Price seems to have been repelled before that zone with relatively good volume so its a case of almost does count.
Entry: 45.05
SL: 48.21
TP1: 38.05 (R: 2.21)
TP2: 35.52 (R: 3.01)
LLoyds Banking group- Dividend?Looking at Lloyds even at these prices as a good dividend stock. something to potentially have instead on a low yield BTL.
Lloyds have a net asset value of 52p per share, so current trading conditions mean its cheaper rn to buy compared to 5 years prior to virus.
imo with everyone taking out loans they need to repay for businesses, mortgages with the booming property market they have a nice set up and future ahead.
2019/20 was 3.26p per total share. so with a buy of a share around 50p with that same dividend you'd be around 6.5% yield. obviously the dividend will not be as good now but you can easily see capital appreciation from share value even at these prices. Next key resistance being around 50p then a lot of upside from there.
thoughts?

LLOY upside potential from here? LLOY is recovering nicely from last year's mauling but 40-43 was always going to be a tough area, as proved in November. 40.79 was the high/failure back then but we are now above here and making bullish noises, getting back to levels last seen in March of last year. Resistance above is pretty sparse due to how quickly it dropped last year, suggesting that it could head back to levels like 48.50 and 54.50 without too much getting in the way.

Has sentiment at #LLOY improved?Hello traders
This analysis is following up on my previous idea, which can be found in the link below.
I thought I'd give some clarity on where the price could go, following the board's earnings release.
I have included two Fib retracements. Firstly, from the ~67p peak last year to the low mid Sep at ~23p. This gives us a broader outlook of where the price has been, and where it could go long term. Secondly, and the most critical in question, a retracement Fib from 39.5p resistance of 24 Nov 2020, to 33p support of 29 Jan 2021. This gives us a clue on where the price can go short term.
On the day of earnings release, the share price opened with a gap up, but eventually closed below resistance. Currently, the share price is using the 0.786 Fib level as support. The next few trading days will tell us more. I don't expect the price to fall below said Fib level, if it does, it would be interesting to see if the 20SMA acts as support. More importantly, if price closes above 39.5p, this will be the highest in over 11 months, and would see a bullish ascent.
The company released earnings a couple of days ago. Due to the pandemic, all stakeholders are aware that profits will fall dramatically. Question is therefore, are they better or worse than expected? Lloyds stated profits falling to £1.2bln which beats consensus. Additionally, the bank's core capital ratio increased to 16.2% compared to 15.2% in September. This is a key measure of financial resilience.
A final dividend of 0.57p per share has been announced. This is the max permitted following rules by the BoE.
For me, reasons to go long are clear, especially with an end to lockdown in sight, enabling the economy to open up again.
Let me know of your thoughts, if you disagree with me or otherwise, or if you want further information. I'll do my best to help.
Please follow me and give me a like, that would help massively.
Thank you.


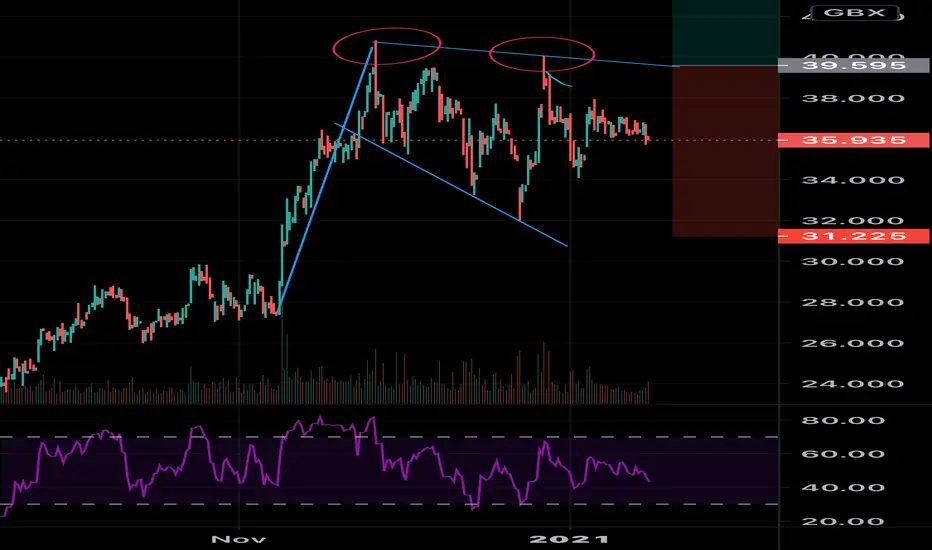
All eyes on #LLOYTomorrow, Lloyds, the UK's largest retail bank, will release their earnings report. Investors will be eager to see how LLoyds' earnings have fared especially during the pandemic, but also compared to its peers, inlcuding Barclays et al.
Additionally, as other banks have reinstated some form of dividend, shareholders will also want some of the same. This may be a bit more tricky however, due to LLoyds' limited exposure compared to its rivals. We shall see.
From the chart, we can see clear resistance at 39.55p, with the end of day close very strong, especially with HSBA producing their earnings. It will be interesting to see how investors will react in the next few trading sessions.
Let me know of any comments you may have. Thanks.

LLOYDS + BARCLAYS BANK BREAK OUTS Hello Trade Viewers, i'm fairly new to trading so i'm mainly writing this post to clarify my own thoughts, and would also welcome any feedback.
Here we can see lloyds has climbed on upward trend since september, and broken out of its previous March resistance at 37, and we have a new base support with two points bouncing off 33 which is now showing a bull flag pattern. With the rollout of vaccine and an itch for businesses to get back into business, UK bank economists have recently reported that the UK economy is 'spring loaded' ,and ready to burst out once out of the covid lockdown gates. Perhaps this is a good moment to make a buy trade that could bounce back to the pre-covid support line of 50 (which is also confirmed with the fib tool 0.618) or beyond to the previous highs of 70. The stock is not overbought or oversold with an rsi of around 55.
i also think that after the initial economic 'spring' bounces back there could be a slump later on in the year, especially if cv-19 lags and the bank of England has to make negative interest rates. That could last for some time due to the amount the government has had to borrow so it could be a short hold of 1-3 months, but lloyds is part of the ftse 100 best performing companies and a solid bank who i have been banking with for over 15 years and never had a problem with, in fact i find there digital online service pretty good and would not mind going long. Reviews also suggest that Barclays bank could potentially be a better investment so maybe it is worth going in on both. Also Jpm morgan looking to bringing a new bank to UK which would be competition to consider.
Thanks for reading and see you next time.
Rich


LYG Long EMA50 crossed EMA200, Uptrend Confirmation
Entry 1.92
Stop 1.6
Target 2.5
Target 3
I am not a PRO trader. I trade option to test my trading plan with small cost.
The max Risk of each plan is less than 1% of my account.
If you like this idea, please use SIM/Demo account to try it.

Lloyds Bullish flag? Waiting for a break out? Just an idea I thought I spotted before I turn in for the night. What are your thoughts?
*I do not claim to be an expert in anyway. Trade at your own risk*
LLOY Stock High Probability Long To 55.000Hello ladies and gentlemen, according to my graphical analysis of the LLOYDS BANKING GROUP PLC ORD 10P there is a high probability of an increase towards 55,000 in the next months .

LLOYD Banking: Buy & Hold: UK Happy Holidays
By Sun Storm Invest Research
A Profit & Solutions Strategy

LLOYInfo only, not advice
Updated chart. Looks like wave 4 was short and early, although wave 3 did go over 1.618
Current trend looks to be XYZ correction.
Watch for start of new impulsive wave structure for validation.


Llyods - LongGood Long opportunity
It broke previous Resistance which is an indication it will go higher upto 50 mark.
Lets wait and watch

Lloyds - buy the dips? - Looking to add to an existing holding on lloyds.
We have the following Confluences / Observations;
1) Initial push above EMA and close above
2) Consolidation of these gains at around 36p (not a fake out)
3) Rejection of a move below EMAs and another push higher
4) There was then some rejection from the 40p region and further consolidation again at 36p - showing this as an emerging area of Support
RISKS
1) It does look as though there is momentum divergence to the downside (momentum creating a lower high, and then falling rapidly)- this is not to say that price should sharply decline, but rather that another push higher isnt just around the corner - so dont get in too early as the stock may continue its consolidation for a while
2) Predictions of a house price crash in 2021 have hampered the shares, as seen by the bearish engulfers at 40p & 38p
I will be looking to buy again if price pushes down to the 35-36p region and this area holds (dont buy into a rapidly falling market!)


LLOYInfo only, not advice
Looks to have bit 1.618 level now
Projected 0.382 / 0.618 level before pushing for wave 5


