Does the MAG7 Really Rule the S&P 500?
I have heard people say things like:
"Without the mag 7, SPY would go nowhere" and
"Apple IS the market" and
"Tech is what the market is built on".
Various things to that effect. I have heard this more with the quite obvious AI bubble going on, where the extreme bullishness and propping of the market is being attributed to the heavily weighted mag 7 stocks, such as NVDA, META, MSFT, AAPL etc. etc.
But I wondered to myself, how true is this? And what happens when and/or if the bubble pops? What stocks are really carrying the S&P and is it true that all that matters is tech?
So, being the quant based math person I am, I decided to answer this question in the best way I knew how. Math and coding.
The questions I want to answer are:
What are the top 10 weighted stocks of the S&P?
What are the top 20 stocks over the last 5 years that have gained the most returns? Is it all tech?
What happens if the AI bubble were to pop and tech were to become a drain on the S&P?
Question #1: Is tech disproportionately weighted on the S&P?
So, let's get into the process. The first thing to do was to analyze actually how heavily tech is weighed on the S&P. This is simple enough, I can accomplish this by pulling ETF holdings from Alpha Vantage and getting their corresponding weight. Using Alpha Vantage's API, I pulled the top 10 highly weighted stocks of the S&P and here are the results:
So.. yeah, SPY heavily favours tech in terms of weighing.
Question #2: Does tech actually carry the S&P and is it the only reason the S&P sees the gains it does?
To answer this question, we need to find out, over the last 5 years, which stocks had the highest average annual return? I isolated the top 20 stocks with the highest average returns and also calculated the number of bullish vs bearish years over the 5 year period, here are the results:
You should already be seeing something interesting. While there is indeed some tech in here, there are a substantial amount of non-tech tickers. For example, NYSE:BLDR is a construction based ticker, NASDAQ:HOOD is finance, NYSE:PWR , NYSE:EME and NYSE:VST are utility based/power/electric based tickers.
You also don't see such tickers as NASDAQ:META or NASDAQ:MSFT leading the gains.
So already we have invalidated the thesis that "tech runs the market", as only 6 of these top 20 tickers are tech based, the rest vary from utilities, to finance to construction.
Another interesting thing to note is that utilities tend to be resistant to negative returns/draw downs. If you notice, NYSE:PWR , NYSE:EME , and NYSE:VST have had 0 bearish years in the past 5 years, vs the rest having some draw downs. Interesting, no?
We can't draw conclusions about the stability or returns of tech stocks from this, but we can draw conclusions about the importance of diversification. We can opine that tech sees more swings and is more prone to volatility than say stable utility based tickers. But it doesn't mean that the actual cumulative returns over 5 years wouldn't outweigh a stable stock that maybe has less returns.
So now that our findings raise this question, let's compare what our returns would be if we had bought some of these top performers 5 years ago.
Let's start with NASDAQ:NVDA
If you bought NASDAQ:NVDA October 20th, 2020, you would have bought at 13.65 per share (bearing in mind there was a split between this timeframe). Current price is 182.64, making your 5 year return 1238.46%.
Now NYSE:BLDR
If you bought NYSE:BLDR on October 20th of 2020, you would have bought it for 33.66 per share, with the current price being 122.46 being a 263.76% return on your investment.
Next NASDAQ:AVGO
If you bought AVGO on October 20th of 2020, you would have paid 37.7$ per share, with a current price of 349.24, making your return over 5 years 826.39%. Not bad.
What about NYSE:PWR
Ah, NYSE:PWR , a stable stock with 0 bearish years over the last 5 years. Had we purchased NYSE:PWR October 20th, 2020, we would currently be up 599.14%.
And what about NYSE:VST ?
Had we bought VST 5 years ago, October 20th, 2020, we would be up 912.72%. Second rank to $NVDA! Nuts right?
What about some tickers that are not on the list?
Assuming the same, you bought October 20th, 2020, here is what you would be up on various stocks:
NASDAQ:MSFT = 140.75%
NASDAQ:META = 173.65%
NASDAQ:AAPL = 123.16%
NASDAQ:NFLX = 135.73%
NASDAQ:IRDM = -34.28%
NASDAQ:GSAT = 768.78%
NYSE:VZ = -28.73%
NASDAQ:PLTR = 1858.9%
NYSE:LMT = 35.92%
NYSE:BA = 29.65%
Interesting? Probably!
In fact, this actually helps us answer our question more concretely. We can see that tech returns, while admirable, are not really all that ridiculously inflated. I mean 123% return on your investment over 5 years is pretty good, but its not 900%.
Thus, we can say that it can't be true that tech fully drives the S&P, at least not entirely.
That's all fine and dandy, but what is critical is our next question, what happens if the tech bubble (AKA AI bubble) pops? How will the weight impact the S&P?
Question #3: What happens if AI bubble pops?
Well, this is the most interesting question. And we can actually begin to answer this question, not so mathematically by simply looking at charts during the dotcom bust. We can see in 1999 at the peak of the bust, SPY lost about 50%:
Of we look at, say, NYSE:PWR and NYSE:EME during that time:
NYSE:EME lost about 36%
NYSE:PWR just over 50% but quickly rebounded while AMEX:SPY continued to tank.
So this doesn't bode well for AMEX:SPY being able to offset such a heavy weighing of tech. But let's approach this mathmatically.
Since we have the actual weight of the Mag 7.
For clarity, the Mag 7 are said to be NASDAQ:AAPL , NASDAQ:MSFT , NASDAQ:NVDA , NASDAQ:AMZN , NASDAQ:META , NASDAQ:GOOG , $TSLA.
If we take the weighing of these 7 companies and calculate the actual dollar amount this weight translates to, it translates to exactly 141.57$ USD, comprising a total weight of 31.46%.
What this means is if you were to buy $1,000 worth of SPY, approximately 315$ of your money would be allocated just to those 7 tickers, or 1,000 x 0.315 = 314.6$.
Running a simulation in R based on the weight of 31.46%, assuming that all 7 of these tickers were to drop 50%, that would equate to a loss of -15.73% on SPY. That is assuming that other companies did not, in sympathy of the bubble pop, also not come down with $SPY.
We know this to obviously be false from experience, even NYSE:PWR tanked at first during the dotcom bust and same with NYSE:EME despite them having absolutely nothing to do with dotcom nonsense.
But, in a perfect world, if only the mag7 were impacted, we would see about a -10 to -15% decline in AMEX:SPY on a bubble pop, assuming of course these companies tanked 50%.
So now what?
So I have answered my questions, I could just leave it there. But perhaps it may be more advantageous to talk about what this actually means for an investor.
We can draw some initial speculations, unfortunately we don't have enough data to draw concrete conclusions.
The first assessment we can draw is, does it even make sense to invest in AMEX:SPY ?
The 5 year return on SPY, if we bought in 2020-10-20, would be 95.5%. Had we invested in NASDAQ:AAPL or any of the other tickers I mentioned above, specifically tech, our return would have been slightly better.
It begs the quesiton, what's the point? If AMEX:SPY is so exposed to tech, its actually hindering your returns when you can just invest in the raw tech ticker itself, and diversify more fully in other tickers such as NYSE:PWR and NASDAQ:EXE to offset the drawdawns.
Overall, your returns would be better than just investing simply in the ETF SPY.
If you look at it more concretely, the R:R may theoretically be worse. If you are a savvy investor and you are up over 100% on your investment, the logical thing to do is to set a profit stop (this is something I do in my investment account). This can shield your returns from bubble pops and other financial hardship while retaining a substantial portion of profit.
You can also just chose to take profit at 100% and over and then look for something else too invest in.
When you dissect annual returns of various tickers and look at the impact these tickers have on the ETF, ETFs lose their air of "safety" and "solid investments". Because in the end, you are super exposed to a handful of stocks that you would do better to just individually invest in independently. While AMEX:SPY is diversified, being super exposed to the most volatile industries in the market does not necessarily make it a safe investment nor does it make sense from an actual R:R perspective if you were to really consider the risk that the collapse of only 7 companies of the 500 would have on the ETF itself.
This isn't advice by any means, just some food for thought.
When you dissect the anatomy of the market and its components, you can get further insight into what you are actually getting into when you buy a, quote , "safe and stable ETF" like $SPY.
These are my thoughts, opinions and some objective analysis.
Hopefully you find this information helpful and use some of these principles in gauging your risk exposure.
Thanks for reading! and as always, safe trades!
Trade ideas

Zig Zag Indicator UPD: Cycle DualityIn some earlier works I've mentioned how Markets follow Brownian Motion that explains its probabilistic memory and denies geometric one. And with the recent update of Zig Zag that monitors both directive and temporal aspect of the swings, I'd like to return to review that subject again.
Recap of Known Contradicting Theories
Brownian motion is a random walk, often used as a model for stock price movements. In its simplest form, it assumes that price changes are independent and identically distributed with a normal distribution.
However, financial markets exhibit trends, cycles, and volatility clustering, which are not captured by simple Brownian motion.
Benoit Mandelbrot studied the fractal nature of financial markets. He proposed that markets are better modeled using fractal geometry and that price movements exhibit:
Fat tails: Extreme events occur more frequently than predicted by the normal distribution.
Long-term dependence: Price changes are not independent; there is persistence in volatility and sometimes in returns.
Self-similarity: Market patterns repeat at different time scales.
Why measuring both H2H and L2L cycles matters:
(Please do not confuse with directional swing HH LH LL HL, as they are of trend's price motion and not temporal!)
Basic Thoughts
The traditional way to measure cycles is through a systematic 𖼆 movements, so that the time distance between Lows counts as cycle length. The best way to fool myself would be to just stick with one method of tracking market rhythms. So, having second perspective of what cycle is, through inverse time count 𖼓 (H ➔ H), would technically back the original one or even challenge at times, which by definition increases awareness of the price fluctuation.
We figured that markets move in alternating phases of accumulation and distribution, that's why only measuring one gives half the story.
Cycle Confirmation: When H2H and L2L cycles align in duration, it suggests stable, rhythmic market behavior. Divergences signal potential trend changes.
Phase Relationships: The timing between highs and lows reveals market temperament:
Short 𖼆 + Long 𖼓 = Strong uptrend
Short 𖼓 + Long 𖼆 = Strong downtrend
Similar durations = Consolidation/balanced market
Brownian Motion Contrast
By default assumes H2H ≈ L2L (durations symmetry)
Random phase relationships
No persistent asymmetries
The indicator's value comes from measuring exactly what Brownian motion cannot explain.
I'm essentially interested in building a temporal map of market psychology rather than just a price map. The dual aspects of timing would letting you see the complete waveform rather than just half of it.
The next update would probably be after carefully linking normalized Averaged(True Range/close *100) to the directional wave, in order to reveal how price swings are naturally scaled. It might give some constants which could be used for modeling.

NVDA Oct. 15 2025NVDA trade idea based on current conditions. Its my first video and I'm learning to talk while recording. :P

NVIDIA STOCKS NVIDIA is a leading American technology company renowned for its graphics processing units (GPUs) primarily used in gaming, professional visualization, data centers, and artificial intelligence (AI) applications.
NVIDIA stock trades around $183.22, exhibiting steady demand despite some recent short-term price corrections.
Recent Key News & Developments
NVIDIA unveiled the first US-made "Blackwell" AI chip wafer in partnership with TSMC, marking a key milestone for AI hardware innovation.
The company announced its DGX Spark, the world’s smallest AI supercomputer, aimed at accelerating AI development for developers worldwide.
NVIDIA is actively expanding its AI infrastructure, recently joining a consortium with Microsoft and BlackRock to acquire Aligned Data Centers in a $40 billion deal, highlighting its strategic push into AI and data center markets.
The firm maintains leadership in AI chips despite geopolitical challenges, particularly export restrictions affecting its China operations.
Stock Performance Context
Despite some market volatility, NVIDIA remains a strong favorite in AI-driven growth, with optimistic long-term analyst price targets fueled by growth in data centers and AI applications.
The stock recently showed some pullbacks viewed by analysts as “buy the dip” opportunities amid overall bullish sentiment.
#NVIDIA #STOCKS #BONDS

Nvidia - The next rally of +33% started!🚀Nvidia ( NASDAQ:NVDA ) just broke out:
🔎Analysis summary:
Over the past couple of months, Nvidia has been rallying an expected +100%. However, just objectively looking at the chart, this rally is not over yet. After the confirmed all time high breakout, Nvidia can rally another +33% until it will retest a substantial resistance level.
📝Levels to watch:
$250
SwingTraderPhil
SwingTrading.Simplified. | Investing.Simplified. | #LONGTERMVISION

NVDA - cause for concern at $180?NVDA on the daily broken under my support trend line. If we close under the trend line today, it may spell short term bad news for the stock.
Disclaimer: I am long NVDA. Not financial advice.

Time to short Nvidia - Key levels Longs and shorts In this video I have created a simple idea that gives you a easy invalidation for a short as well as
pinpointing some key regions as to where we can set alerts and patiently wait for strong reaction zones for the long side provided we get the structure shift that I am looking for .
Tools used TPO chart, Fibs, Channels ,

NVDA Flag bouncingExpecting to go up, will touch upper trendline based on the pattern. If it breaks the upper trendline then it will break ATH.

Long NVDA. uptake ~600NVIDIA continues to lead in AI infrastructure with significant developments, including powering the world's first supercluster with Microsoft Azure. Despite challenges in the broader tech landscape, NVIDIA's market presence remains robust, supported by high demand for AI solutions.

Oh come on, time to take a breather , NVDAThis will be a good place to go LONG on NVDA if it does pull back to 164.70 price level. With AI collaboration hot on the wheel now, it is also possible that prices get push up higher in the short term. No shorting!

I Future on Sale — Buying Nvidia Amid Trade War FearsI just bought NVDA Jan 2026 185 Call @ $16
I trust top macro analysts calling for strong Q4 ’25 and Q1 ’26.
Chips will likely get tariff exceptions.

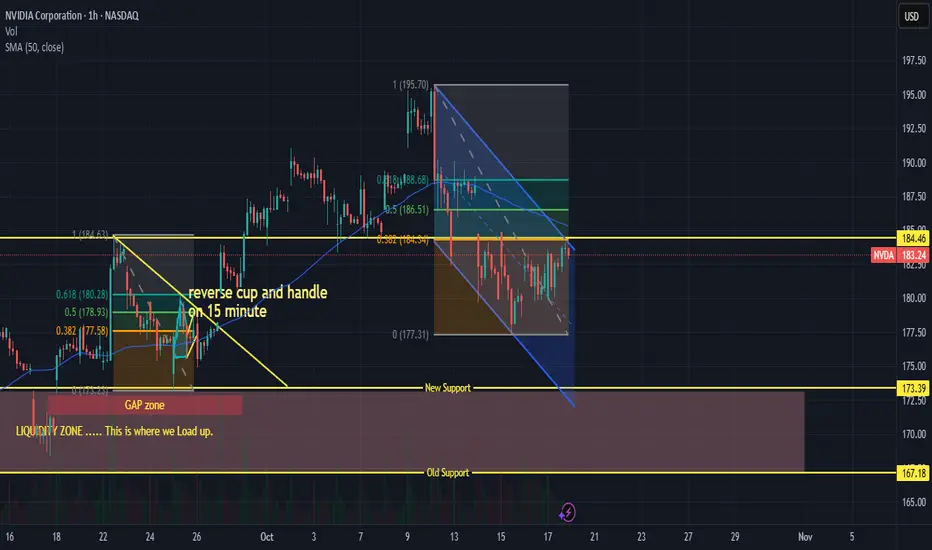
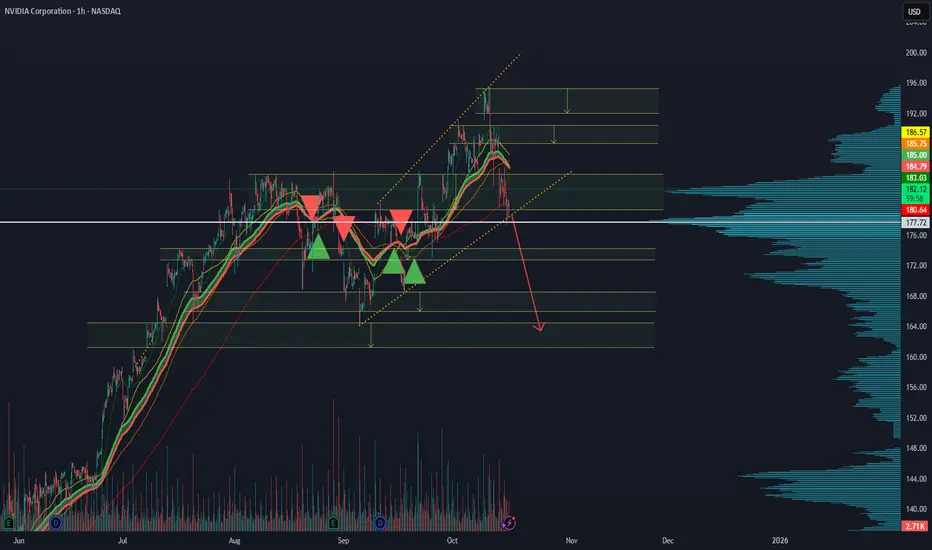
NVDA Friday Oct. 17 Setup – Gamma Tug-of-War at $181Will Bulls Reclaim Control or Fade Into the Close?
1. Market Structure
NVDA’s market structure this week has been a textbook example of controlled distribution turning into a short-term range compression.
On the daily chart, we saw a clear CHoCH (Change of Character) after NVDA failed to hold above the prior BOS zone near $194–$195, breaking below the trendline and triggering a momentum selloff toward $180. The broader uptrend from April remains intact, but this week’s action is more about testing the integrity of that long-term trendline.
On the 1-hour chart, NVDA is showing a series of lower highs and lower lows, forming a descending channel — clear short-term bearish structure. However, a minor CHoCH appeared at $179.7, where buyers defended a liquidity sweep and rebalanced the imbalance left from Tuesday’s gap-down.
On the 15-min, price is coiling tightly between $179.5 and $183.9, creating a compression zone that often precedes strong Friday moves. Smart money seems to be accumulating near the lower boundary ($179–$180), taking advantage of weak-handed sellers.
2. Supply & Demand / Order Blocks
Key demand zones sit at:
* $179–$180 → Repeated rejections and strong buy wicks confirm this as near-term demand.
* $164–$166 → Next major unfilled order block from the August consolidation (daily chart).
Key supply zones:
* $183.9–$185.5 → Intraday supply aligned with 15-min CHoCH rejection and 1-hour descending trendline.
* $194–$195.6 → Major supply from the daily BOS rejection zone.
If NVDA breaks below $179.5, liquidity opens up fast toward $177.3 and then $172.5 — both align with prior imbalance fills. Conversely, reclaiming $183.9 with conviction could trigger a short squeeze into $187–$190, where previous stop clusters lie above equal highs.
3. Indicator Confluence
9 EMA and 21 EMA:
On the daily, both EMAs are flattening — signaling exhaustion after a prolonged uptrend. On the 1-hour, 9 EMA is still below 21 EMA, suggesting bearish control but with a narrowing gap hinting potential crossover if buyers push above $182.5.
MACD:
Momentum is compressing. The histogram shows fading red on lower timeframes, and the 15-min MACD just turned slightly positive — a subtle but important shift suggesting short-term relief could follow if buyers defend $180 support.
Stochastic RSI:
Both 1-hour and 15-min Stoch RSI are curling up from oversold territory, pointing to short-term upward momentum.
Volume:
We’re seeing lower volume on the recent dips — typical of absorption rather than aggressive sell pressure. This adds weight to the idea that smart money could be loading for a controlled Friday move.
4. GEX (Gamma Exposure) & Options Sentiment
The GEX map paints a fascinating setup heading into Friday’s close:
* Key Positive Gamma Zone: $185 → Largest call wall and positive GEX cluster, where dealers hedge short gamma by selling strength.
* Neutral Pivot / HVL: $181–$182 → The battleground where dealers flip between short and long gamma exposure.
* Put Walls: $177.5 (2nd wall) and $172.5 → Heavy negative gamma zone, where volatility could expand if price breaks below.
Implied volatility remains moderate (IVR 24.6, IVx avg 54.3), indicating traders aren’t expecting a massive breakout yet — but gamma positioning suggests we’re on the cusp of a move. If NVDA pushes above $183.5, dealer hedging could flip bullish, forcing a gamma squeeze toward $187–$190. Conversely, losing $179 would trigger negative gamma acceleration, likely dragging NVDA toward the $175 zone.
For Friday scalpers, the sweet spot lies around this $181–$182 pivot, where gamma flips and liquidity sits thickest. Expect quick reversion trades early, then directional follow-through once either boundary breaks.
5. Trade Scenarios
🔹 Bullish Setup
* Entry: Above $183.50 with confirmed retest hold.
* Target 1: $185.5
* Target 2: $187.2 → $190 (gamma squeeze zone)
* Stop-Loss: $180.80
* Confirmation: MACD crossover + 9/21 EMA flip + volume expansion above prior candle body.
Bias: Watch for aggressive short covering into the weekly close if SPY stays risk-on.
🔹 Bearish Setup
* Entry: Below $179.50 (1-hour BOS level).
* Target 1: $177.30
* Target 2: $172.50 (major put wall and FVG fill)
* Stop-Loss: $181.80
* Confirmation: MACD histogram flips red again + rejection at EMA cluster + volume surge on breakdown.
Bias: Sellers control below 180. If bulls fail to defend that level, NVDA could retrace deeper into next week.
6. Closing Outlook
Friday’s tone for NVDA hinges entirely on the $181 gamma pivot.
This level is the magnet — where both sides are fighting to dictate direction into the weekend. If bulls can defend it and break $183.5, we could see a short-covering rally into the close. But failure here, especially if SPY weakens, opens the door for a deeper flush into the $177s.
Personally, I’m watching for a liquidity trap near $180–$181 — if we get a fake breakdown that reclaims quickly, it’s often the cleanest Friday scalp long into $185.
Volatility should rise into power hour as dealers rebalance hedges ahead of expiration.
Disclaimer:
This analysis is for educational purposes only and not financial advice. Always manage your risk and trade your plan.

Stock Gains from Covid Lows + Market Thoughts 10/15/25I will look over about 30 stocks ranging from Mag 7 to Covid High flyers to recent highflyers.
As well as my thoughts and prospects for the markets from here.

$SPXAs the U.S.–China trade war escalates, new investors might inject liquidity into U.S. markets to maintain strong ties with the U.S. economy.
SP:SPX could keep pushing higher not from peace, but from strategic capital alignment.
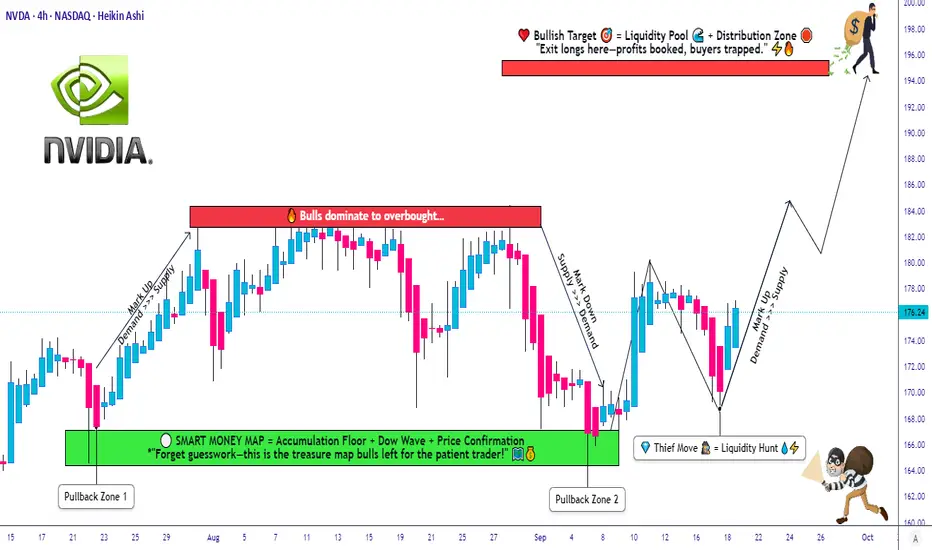
NVDA Setup Explained: Layered Entry + Clear SL/TP Levels😎 NVDA Thief’s Wealth Heist: Swing/Day Trade Blueprint 🚀
Asset: NVIDIA Corporation (NVDA) 📈Vibe: Bullish, sneaky, and ready to snatch profits with style! 💰
Welcome, ladies and gentlemen, to the Thief’s OG Wealth Strategy Map for NVDA!
This is a fun swing/day trading plan designed to grab liquidity like a master thief. Let’s break down this bullish setup with a double bottom pullback, layered entries, and a cheeky escape plan. Ready to outsmart the market? 🕵️♂️
📊 Market Analysis: Why NVDA?
NVDA is riding a bullish wave 🌊, confirmed by a double bottom pullback pattern and a sneaky liquidity grab at key support levels. The stock’s momentum is screaming “UP!” as buyers step in to defend the price. This setup is perfect for swing or day traders looking to capitalize on NVIDIA’s tech-fueled surge. 💻
🗺️ The Thief’s Plan: Bullish Heist Strategy
🎯 Entry Strategy:Deploy the Thief’s Layering Tactic with multiple buy limit orders to maximize your entry precision.
Suggested price levels:
$172.00
$174.00
$176.00
$178.00
Pro Tip: Feel free to add more layers based on your risk appetite and market conditions. The more, the merrier! 🧑💼
🛑 Stop Loss (SL):Set a Thief’s SL at $168.00 to protect your loot.
Note: Dear Thief OGs, this SL is my suggestion, but you’re the boss of your trades! Adjust based on your risk tolerance and let the profits roll. 💸
🎉 Take Profit (TP):Aim for the juicy $195.00 target, where we expect strong resistance, potential overbought conditions, and a possible trap for the unprepared. Lock in those hard-earned gains and escape like a pro! 🏃♂️
Note: This TP is my call, but you do you! Take profits at your own pace and keep the cash flowin’. 😎
🔗 Related Pairs to Watch (in USD)
To boost your market awareness, keep an eye on these correlated assets:
NASDAQ:AMD (Advanced Micro Devices): NVDA’s chipmaking cousin often moves in tandem. A bullish NVDA could signal strength in AMD. 📡
NASDAQ:SMH (VanEck Semiconductor ETF): This ETF tracks the semiconductor sector, including NVDA. Watch for sector-wide momentum. 📊
NASDAQ:QQQ (Invesco QQQ Trust): NVDA’s a heavy hitter in this tech-heavy ETF. QQQ’s trend can confirm NVDA’s direction. 🚀
Key Correlation Point: NVDA’s performance is tied to the broader semiconductor and tech sector. If AMD or SMH shows bullish patterns, it reinforces NVDA’s upside potential. Conversely, weakness in QQQ could signal caution. Stay sharp, thieves! 🕵️
🛠️ Why This Setup Rocks
Double Bottom Pullback: A textbook bullish reversal pattern, signaling strong buying interest. 📉➡️📈
Liquidity Grab: The market’s attempt to shake out weak hands before the real move up. We’re smarter than that! 😏
Layered Entries: Spread your risk across multiple price levels for a smoother ride. 🎢
Risk Management: Clear SL and TP levels keep your heist disciplined and profitable. 🧠
⚠️ Disclaimer
This Thief Style Trading Strategy is just for fun and educational purposes! I’m not a financial advisor, and trading involves risks. Make your own decisions, manage your risk, and trade responsibly. Let’s keep the vibes high and the losses low! 😜
✨ “If you find value in my analysis, a 👍 and 🚀 boost is much appreciated — it helps me share more setups with the community!”
#NVIDIA #NVDA #Trading #SwingTrading #DayTrading #ThiefStrategy #StockMarket #Bullish #TechnicalAnalysis
Below $164 very possible (RANGE + DEVIATION)Unless $184 is reclaimed, a visit to the bottom of the range is on the table with a possible deviation to the downside, trapping bears.

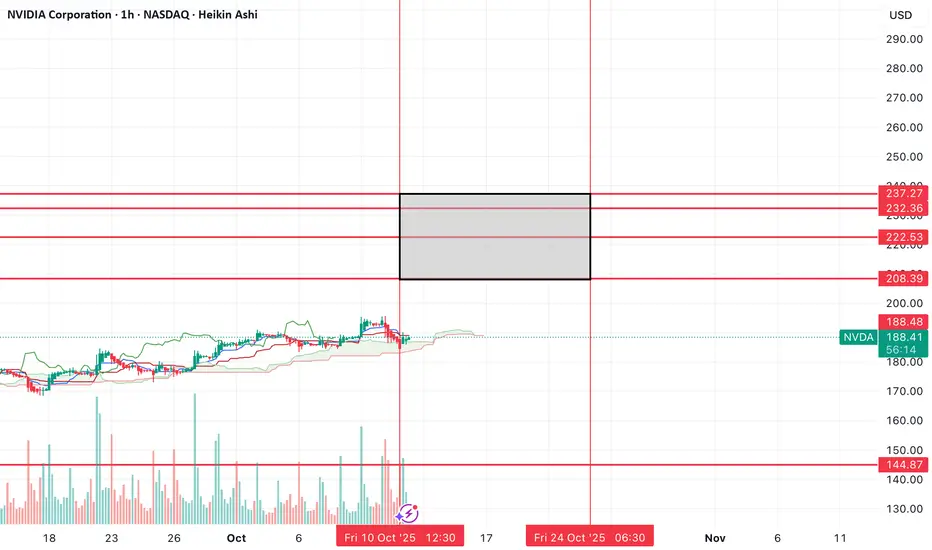
$NVDA final leg higher? Over $200?The move down on Friday looks like it marked a low to me and that we could see our final move higher from here.
It's been my idea that we see a blowoff top over the next couple of weeks, so I think these levels in the box will mark the top.
I think it's most likely that we get somewhere between the $222 level and $232 level, but I've marked off other levels just incase.
I've taken some calls, let's see how the move plays out from here.
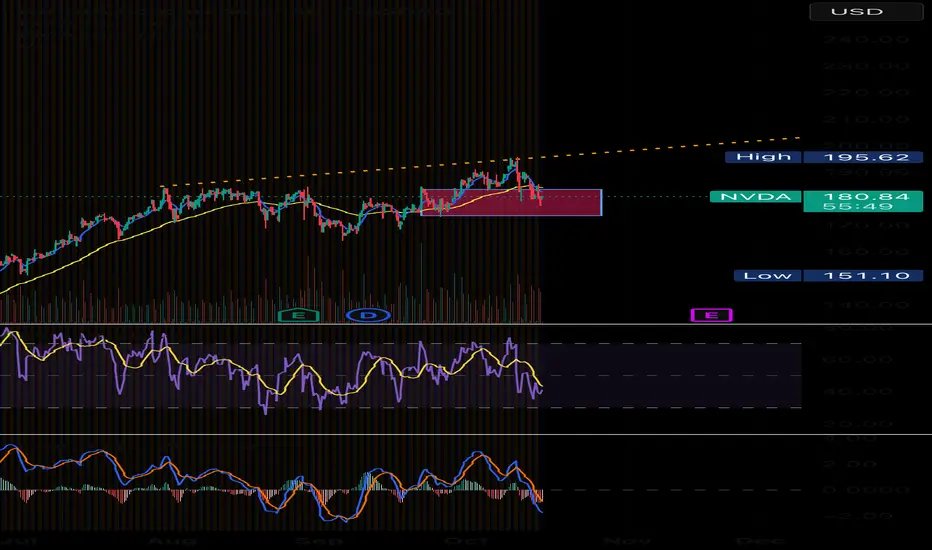
NVDA – Bearish Divergence at the Peak: Is a Healthy Correction CPrice is testing the upper boundary of its long-term ascending channel near 190 USD, showing clear bearish divergence between price vs RSI and MACD histogram, signaling weakening momentum. A corrective A–B–C wave toward the 125-135 $ zone is likely, aligning with EMA and Ichimoku supports. This would form a healthy reaccumulation phase before the next potential bullish leg.

Nvidia short ideaNVDA is forming an expanding pattern and looks ready to break lower. A short could be considered once price confirms a break, with a target around 163 and a stop just above 184. Keep an eye on the breakout for proper confirmation.
⚠️ Not financial advice.
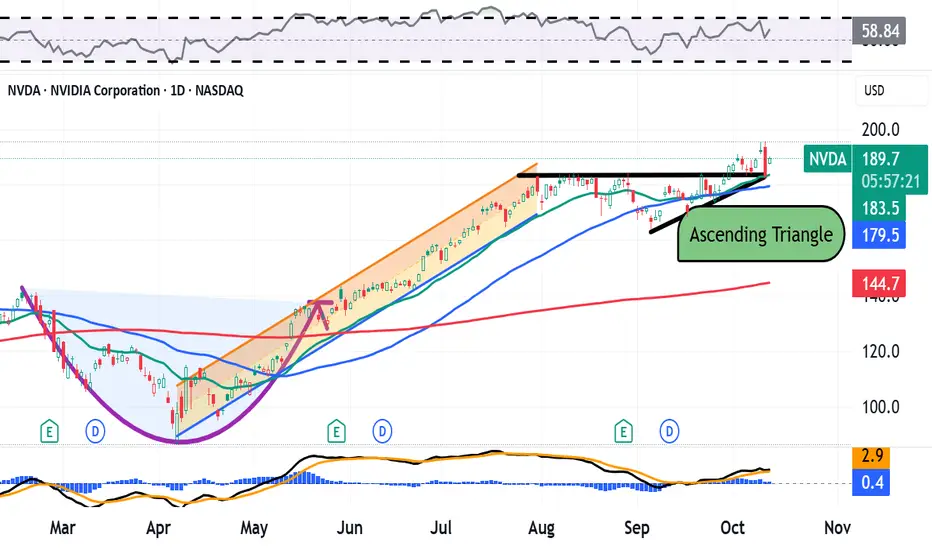
Nvidia Is Trading Near All-Time Highs. What Does Its Chart Say?Nvidia NASDAQ:NVDA hit an all-time intraday high this past week after rebounding some 120% from its April lows. What does the AI-friendly chip giant's chart and fundamental analysis say could happen next?
Let's check things out:
Nvidia's Fundamental Analysis
We're still more than a month away from hearing from Nvidia about its Q3 quarterly results, which will likely come in late November.
But as of right now, the Street is looking for the high-end GPU designer to report $1.24 in adjusted earnings per share for the period on roughly $54.7 billion of revenue.
That would represent a 53.1% gain from the year-ago period's $0.81 in adjusted EPS, as well almost 56% growth from the $35.1 billion in revenues seen 12 months earlier.
That kind of sales growth would be more than impressive for almost any other firm, but would actually represent a deceleration from the growth pace NVDA has experienced over the past two years or so.
The advent of big capex up-spend on artificial-intelligence-focused infrastructure meant Nvidia boasted annual sales growth well into three-figure percentages during much of 2023 and into 2024.
But the "law of large numbers" eventually kicks in for everyone, even Nvidia -- and that's really not a bad thing at all. After all, NVDA's stock currently trades at about 30 times forward-looking earnings and 53 times trailing earnings.
Expensive? Maybe, but a growth rate at this kind of scale is hard to put a price on. Less than 1% of Nvidia's entire float is held in short positions, so we know there aren't a lot of NVDA out there.
In fact, 33 of the 38 sell-side analysts that I know of who cover NVDA have revised their Q3 earnings estimates higher since the quarter began, while just two have lowered their forecasts. (Three have left their estimates unchanged.)
And in full disclosure, I'm personally long this name and have been for a very long time.
Nvidia's Technical Analysis
Now let's check out NVDA's chart going back some eight months and running through Wednesday afternoon:
Readers will see that Nvidia bottomed out at $86.62 intraday on April 7, forming a bullish "cup-with-handle" pattern in the process (marked with a curving purple in at the chart's left).
The stock then rallied from that early April low into late July, which I've illustrated with a Raff Regression model (the orange-shaded area above).
However, NVDA next hit stiff resistance from late July through late September, bumping its head up against the Raff Regression's ceiling many times before finally cracking through on Sept. 30.
This resistance formed the upper trendline of what's known as an "ascending-triangle" pattern of bullish continuance, marked with thick black lines at the chart's right.
The top black line now serves as Nvidia's pivot at the $184 level. We can see that since cracking this line in recent days, the stock has tested it from above and found support. (NVDA was trading at $189.85 Monday morning as I wrote this after hitting a $195.62 all-time intraday high on Friday.)
Meanwhile, Nvidia's secondary indicators are postured quite bullishly.
Its Relative Strength Index (the gray line marked "RSI" at the chart's top) is improving and flashing a better-than-neutral signal, but isn't yet technically overbought.
Similarly, all three components of Nvidia's daily Moving Average Convergence Divergence indications (or "MACD," marked with black and gold lines and blue bars at the chart's bottom) are in good shape.
The histogram of the 9-day EMA (blue field) is above the zero-bound, as are the 12-day Exponential Moving Average (or "EMA," denoted with a black line) and 26-day EMA (the gold line). The best part for the bulls is that the 12-day line is running above the 26-day line and both lines are still rising.
An Options Option
A bullish trader might get involved with Nvidia by initiating a "buy-write" strategy.
This involves purchasing a stock and simultaneously "writing" (i.e. selling) a covered call against that equity position to reduce the investor's net basis. Here's an example:
-- Buy 100 shares of NVDA at or close to $188.
-- Sell (write) one Nov. 21 $210 call for about $4.25. This call will likely expire after Nvidia's 3Q earnings come out.
Net basis: $183.75.
In the example above, selling the covered call will significantly lower the equity position's net basis.
Should the shares be called away in November, the trader would still realize a 14.3% profit. That's fine, but this trade is really about getting long NVDA while finding ways to reduce net basis.
The trader in the example above could theoretically keep writing covered calls against the stock for as long as the equity position exists, further and further reducing net basis.
(Moomoo Technologies Inc. Markets Commentator Stephen "Sarge" Guilfoyle was long NVDA at the time of writing this column.)
This article discusses technical analysis, other approaches, including fundamental analysis, may offer very different views. The examples provided are for illustrative purposes only and are not intended to be reflective of the results you can expect to achieve. Specific security charts used are for illustrative purposes only and are not a recommendation, offer to sell, or a solicitation of an offer to buy any security. Past investment performance does not indicate or guarantee future success. Returns will vary, and all investments carry risks, including loss of principal. This content is also not a research report and is not intended to serve as the basis for any investment decision. The information contained in this article does not purport to be a complete description of the securities, markets, or developments referred to in this material. Moomoo and its affiliates make no representation or warranty as to the article's adequacy, completeness, accuracy or timeliness for any particular purpose of the above content. Furthermore, there is no guarantee that any statements, estimates, price targets, opinions or forecasts provided herein will prove to be correct.
Options trading is risky and not appropriate for everyone. Read the Options Disclosure Document ( j.moomoo.com ) before trading. Options are complex and you may quickly lose the entire investment. Supporting docs for any claims will be furnished upon request.
Options trading subject to eligibility requirements. Strategies available will depend on options level approved.
Maximum potential loss and profit for options are calculated based on the single leg or an entire multi-leg trade remaining intact until expiration with no option contracts being exercised or assigned. These figures do not account for a portion of a multi-leg strategy being changed or removed or the trader assuming a short or long position in the underlying stock at or before expiration. Therefore, it is possible to lose more than the theoretical max loss of a strategy.
Moomoo is a financial information and trading app offered by Moomoo Technologies Inc. In the U.S., investment products and services on Moomoo are offered by Moomoo Financial Inc., Member FINRA/SIPC.
TradingView is an independent third party not affiliated with Moomoo Financial Inc., Moomoo Technologies Inc., or its affiliates. Moomoo Financial Inc. and its affiliates do not endorse, represent or warrant the completeness and accuracy of the data and information available on the TradingView platform and are not responsible for any services provided by the third-party platform.
Nvidia to Recover: Just A Bump In the Road?Trump’s remarks about China close to Friday’s weekly close sent markets into a brief panic. Nvidia had just made a new all-time high, breaking through the previous top and resistance near 184, and was attempting another leg higher despite the US government shutdown. His comments triggered a 7 percent selloff, causing NVDA to retest the previous resistance zone from above.
The 182–184 area is now the primary support. After Trump slightly eased tensions, the stock is up 3 percent in premarket trading today. The road ahead may be bumpier than bulls would like, but the upside remains the base case for now. If both the 182–184 zone and the 177 support fail, that would be the point where the bullish outlook should be reconsidered for the short to medium term.

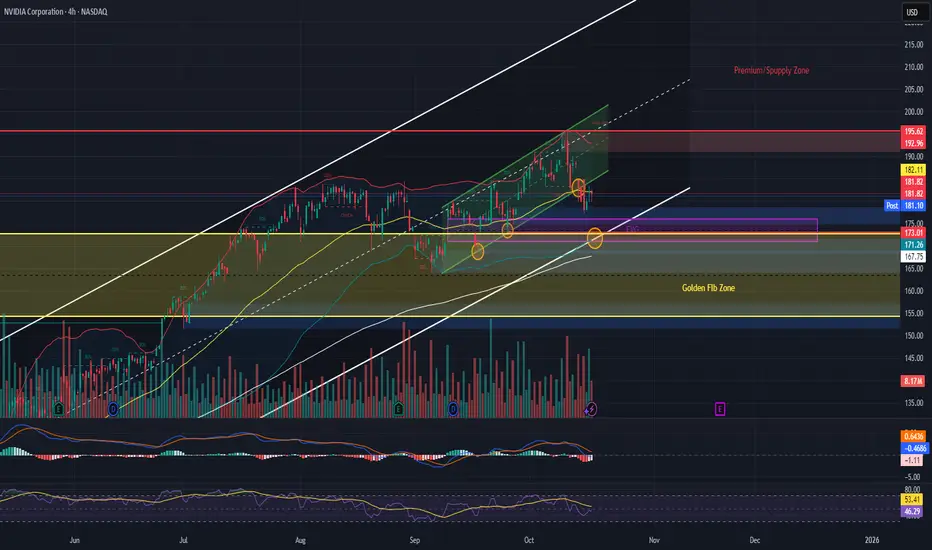
NVDA: Pullback Before the Next AI Move🧠 Technical Overview
NVIDIA is currently testing the integrity of a larger ascending channel after breaking out of a smaller uptrend structure. The setup reflects a potential pullback to the Fair-Value Gap (FVG) zone around $171–$175, where confluence from multiple structural levels may support a continuation of the long-term uptrend.
Structural Context:
- NVDA broke below a smaller, local uptrend channel, indicating short-term weakness or a deeper retracement phase.
- The larger white trend channel remains intact, suggesting the broader bullish structure is still valid unless price decisively breaks below $168.
- The FVG and trendline confluence around $171–$175 forms a critical decision zone — potential accumulation area before continuation.
Indicators & Momentum:
- MACD: Bearish crossover active but showing signs of flattening → potential slowdown in downward momentum.
- RSI: Near 45, approaching oversold territory, aligning with potential bounce region.
- Volume: Moderate with slight increase during recent sell pressure — suggests controlled pullback rather than full reversal.
Scenario Expectation:
Base case favors a retest of $171–$175 before continuation upward.
If NVDA fails to hold above $168, expect a shift in structure — likely continuation of the larger channel downtrend toward $164–$160 before stabilization.
🌍 Macro & Catalyst Overview
1. AI Demand & Infrastructure Growth
NVIDIA continues to dominate AI chip supply, benefiting directly from global GPU infrastructure expansion. Microsoft’s and Nscale’s recent deployment of 200,000 Nvidia GB300 GPUs reinforces NVDA’s market moat and ensures extended demand through 2029.
→ Bullish Long-Term Catalyst
2. Market wide Valuation Concerns
Despite strong fundamentals, AI sector valuations remain stretched. This creates short-term corrective risk — investors rotating between overextended AI names and value sectors.
→ Neutral / Slightly Bearish Short-Term Catalyst
3. Macro Environment (Q4 2025)
Stable U.S. inflation and Fed holding rates steady maintain a neutral-to-positive tech environment.
Bond yields leveling off supports risk-on sentiment for semiconductors.
4. Global Supply Chain Notes
GPU production remains tight but improving. NVDA’s ongoing partnerships across Europe and Asia mitigate supply bottlenecks, enhancing delivery reliability and forward guidance confidence.
Macro Takeaway:
While NVDA may experience near-term pullbacks amid valuation cooling and technical corrections, its AI infrastructure dominance and GPU supply deals provide a solid long-term bullish foundation. Any retracement into the $171–$175 range could be viewed as a high-probability re-entry opportunity for continuation traders.
📊 Trading Plan Example
Bullish Scenario: Long entries near $171–$175 zone with confirmation of support. Targets: $183 → $192 → $220
Bearish Scenario: Break below $168 confirms structural weakness. Downside target: $164 → $160.
Invalidation: 4H close above $183 with strong volume invalidates short-term bear thesis.
Looks like it was a temporary breakout.Being that it was under a previous breakout might test former support and trade sideways between the former support and resistance without significant news. Potentially restoring relations with China I don't see this going higher anytime soon. Especially since they have attached themselves to the hype train that is ORACLE. I guess we shall see what happens.