Will Nvda crash the AI bubbleThis channel is not providing individualized trading or investment advice, nor is it a banking service, brokerage service, trading service, investment service or money management service
Trade ideas

Sub $100 Incoming?Textbook UTAD • LPSY Formation • Bearish Divergence on 3D QQQ Trend
📌 Overview
NVDA is showing a complete Wyckoff Distribution across all major timeframes. The Monthlys last major push has been extremely weak volume, The Weekly chart printed a clean UTAD, the Daily/3D shows a fractal UTAD, and the 3-Day QQQ trend reveals a bearish divergence by closing above its last swing, while NVDA closed below — confirming supply dominance.
This combination strongly suggests NVDA is transitioning from Phase C → Phase D, with markdown likely into the AR and below.
🟦 1. WEEKLY — Completed UTAD, Now Phase D
The Weekly structure is extremely clean and follows classic Wyckoff logic:
Phase A
PSY
Buying Climax (BC)
Automatic Reaction (AR)
Secondary Test (ST)
Phase B
Wide, choppy rotation while the Composite Operator distributes.
Phase C — UTAD
NVDA broke above Phase B highs, failed immediately, and reversed with increasing sell pressure.
This is the exact spot where smart money typically finalizes distribution.
Phase D — Current
The last two rallies have formed LPSYs, each weaker than the last:
Lower highs
Shortened thrust
Volume fading on upswings
Downside volume expanding
Interpretation:
Weekly is firmly in Phase D, preparing to test the AR (≈ $120). Followed by SOW-B ≈ $93
Failure of this zone opens Phase E (markdown).
🟪 2. 3-DAY NVDA — Fractal UTAD of the Weekly Distribution
On the 3-Day chart, NVDA produced a smaller UT and UTAD inside the larger weekly UTAD.
This is a fractal distribution, confirming:
A smaller distribution nested inside a larger one
CO selling on both timeframes
Supply overwhelming diminishing demand
This also aligns perfectly with the behavior of Phase C → D.
This is one of the strongest bearish Wyckoff signals you can get.
🟦 3. 3-Day QQQ Trend — Clear Bearish Divergence
Above the NVDA 3D chart is the QQQ 3-Day
• When NVDA closes below its last swing, while the market held above, that shows weakness.
This is momentum divergence:
Demand decelerating
When the leaders start to lag, thats something to cause concern.
Its a classic condition during UTADs in distribution tops
When a UTAD forms with divergence, Wyckoff views it as Demand is drying up.
🟧 4. MONTHLY — Macro Distribution Entering Phase D
The Monthly chart confirms the big picture:
Massive vertical run → PSY + BC
First shift in behavior → AR
Controlled retest → ST
Drift sideways → Phase B
Final push → Monthly UTAD
Rejection with increased supply → Phase C complete
Now price is failing the retest and rolling over into Phase D.
The Monthly and Weekly now align, which greatly increases the probability of sustained markdown.
🟥 5. Wyckoff Markdown Projection Path
Based on the current structure:
1️⃣ Current Zone
Weak LPSY → low-volume rally failures. I expect some chop, followed by one last UT of the chop highs, with a rejection between $185-$195. IF we reclaim and hold $195 = Invalidation, otherwise:
2️⃣ SOW (Sign of Weakness)
A decisive breakdown below the most recent structure lows.
3️⃣ First Major Target: AR Zone
$120
Every completed distribution returns to test the AR.
4️⃣ Sow Break (Phase E Begins)
Targets:
$102 (Phase A low)
$90-102 (Redistribution zone)
$76 (Final stopping area; Monthly value reset)
5️⃣ Bear Market Behavior
If the SoW breaks, NVDA enters a true Phase E markdown —
smooth, directional, and supply-driven.
🟩 6. Invalidation
To negate this bearish Wyckoff view:
➡️ NVDA must reclaim and HOLD above the UTAD high.
Given the 3D divergence and repeated LPSYs, this has low structural probability.
🟦 7. Final Thoughts
NVDA is aligning across all major timeframes in one of the clearest Wyckoff distribution sequences of the year:
Monthly UTAD
Weekly UTAD → LPSYs → SOW
Daily/3D fractal UTAD
3-Day QQQ divergence
Volume shift confirming supply
Everything here points toward Phase D → Phase E, with markdown into the AR and below. I think its important to not repeatedly try and call tops so if this idea is invalidated I will remain neutral, until I see redistribution below phase b, but I also think that the weakness in volume, and the MTF alignment is too much to ignore
If this continues to play out that would make all of 2025 a distribution. If that is the case, the markdown phase could play out throughout all of 2026 and into 2027. I know people say this every year/month/day but this is the first time, I personally, have seen this kind of alignment and supporting evidence across timeframes. Time will tell.
Good luck in 2026 everybody

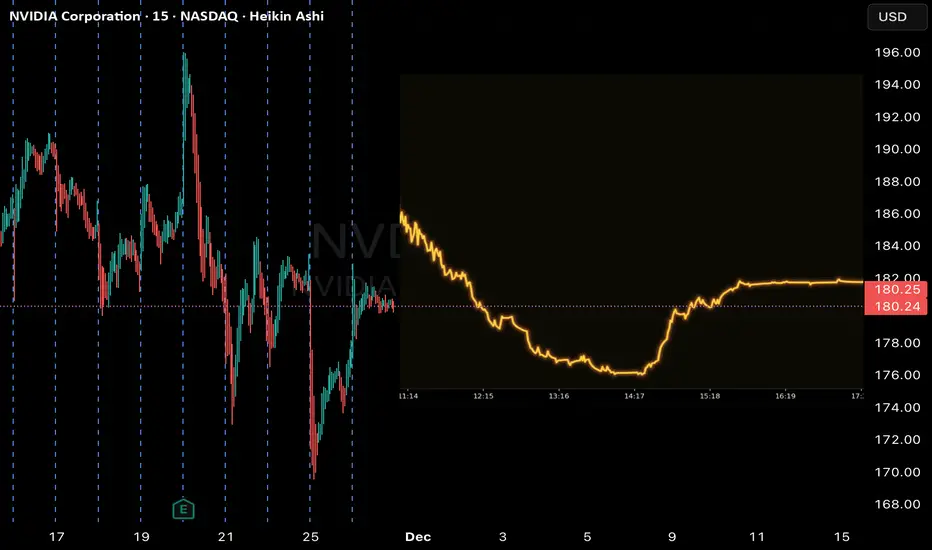
NVDA Put Alert | QuantSignals V3: Katy AI Predicts Short-Term
Signal Type: 1-Month Prediction (QuantSignals V3)
Date: 2025-11-26
Current Price: $180.19
Predicted Price: $177.34 (-1.58%)
30-Min Target: $178.91 (-0.71%)
Trend: Bearish
Confidence: 60.6%
Volatility: 16.7%
Trade Signal: PUT
Entry: $180.19
Target: $177.91
Stop Loss: $182.89
Expected Move: -1.58%
Analysis Summary:
Katy AI predicts a short-term downward trajectory.
Technical resistance near $182.89 acts as stop loss level.
Moderately high confidence (60.6%) indicates some caution is warranted.
Volatility at 16.7% suggests moderate price swings.
Key Notes:
No additional trade signals; single-symbol analysis.
Ideal for traders looking for short-term bearish exposure.
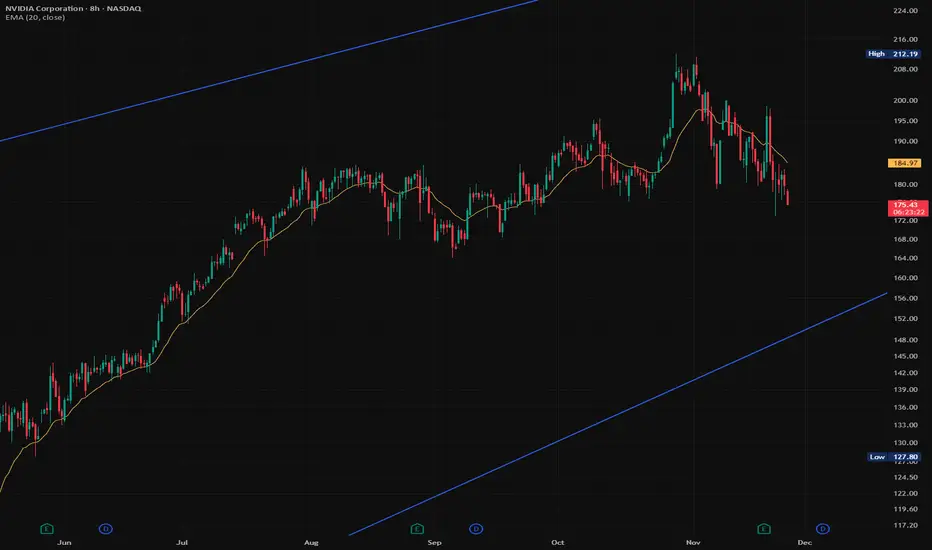
NVDA at a Critical Breakdown. Bounce Coming or Flush to $175NVDA at a Critical Breakdown Zone – Bounce Coming or Full Flush Below $175? 🔥
Weekly Trend (Big Picture)
NVDA’s weekly chart just did something important:
✅ Broke below the long-term rising structure
✅ First real weekly lower high since the major uptrend started
✅ Strong selling wick at the top
This shift tells us momentum is no longer purely bullish. Buyers lost control near $220–$230, and the weekly now leans corrective, not trending.
Key weekly support: $176–$180
This is where the prior trendline, demand, and volume cluster meet.
If NVDA loses this zone on a weekly close → the next major weekly demand isn’t until $160–$165.
Daily Structure
The daily makes the story even clearer:
* Multiple CHoCH signals (trend weakness)
* Failed continuation after breakout attempt
* Price rejecting the daily bearish order block around $198–$205
* Holding inside a large daily demand zone $175–$182
This is the final defense for bulls.
As long as NVDA holds $176–$180 on the daily, we can see:
➡️ Relief bounce toward $187–$192
➡️ Possibly $198 retest
But if $176 breaks…
➡️ Daily breakdown
➡️ Clean air to $165
➡️ Fast move likely
1-Hour View (Trader Timing)
The 1H structure is currently:
* Downtrend channel
* Lower highs
* Multiple failed bounces
* Buyers defending the green demand block $177–$182
Short-term, this is range to down, but oversold enough for intraday bounces.
Best actionable levels:
✅ Long scalp only if price holds above $180 → target $184–$187
❌ Avoid longs below $179
📉 If $176 breaks → expect momentum selling toward $170–$165
GEX (Options Positioning Signal)
This is the key confluence.
GEX shows:
🔴 PUT dominance
🔴 Highest negative exposure at $175
🟥 Strong PUT support wall below $175
🟢 Light CALL interest above $188–$195
What this means:
Institutions are positioned for downside or pinning around $175–$180.
If price cracks $175, dealers flip into accelerated selling → this is where the flush to $165 can trigger quickly.
If price holds above $180 and pushes toward $187+, GEX shifts to neutral and a bounce can develop.
My Thoughts
NVDA is the opposite of AAPL and GOOGL right now.
Those are pushing highs with momentum.
NVDA is:
* Weakest of the big names
* Losing trend structure
* Sitting on final support
* Option flow leaning bearish
This usually leads to:
🔥 Either a violent bounce
🔥 Or a breakdown flush
No middle.
Direction Summary
Bullish scenario:
Hold $180 → push into $187–$192
Bearish scenario (higher probability if $176 breaks):
Break $176 → unwind to $165 fast
Disclaimer:
This analysis is for educational purposes only and does not constitute financial advice. Always do your own research and manage your risk before trading.

NVDA to $170? AI Bubble Risk, Big Money Exits & Heavy Shorts !I f you haven`t bought NVDA before the previous earnings:
Now you need to know that NVIDIA has dominated 2023–2025, becoming the face of the global AI boom. But the higher the climb, the harder the fall. While NVDA is still seen as “untouchable,” several major signals suggest the stock could revisit levels near $170 — a healthy correction of 10–15% from here.
1. Major Investors Are Exiting — SoftBank Dumped Everything
SoftBank, one of Nvidia’s earliest and most influential institutional backers, sold its entire stake in late 2025, worth roughly $5.8 billion.
Smart-money exits near all-time highs should never be ignored.
SoftBank rarely sells unless it believes:
- the sector is overheated
- the valuation has run too far
- risk/reward becomes asymmetric
This mirrors their strategy in 2021–2022 when they unloaded overvalued tech before the correction.
SoftBank’s full exit is a red flag for anyone ignoring the possibility of an AI bubble.
2. Michael Burry Bought Massive Puts — A Direct Bet Against the AI Mania
Michael Burry — famous for predicting the 2008 crisis — has quietly increased his put positions on NVIDIA and other AI names.
Why does this matter?
Because Burry doesn’t short “normal” overvaluations.
He shorts bubbles.
His AI thesis:
- expectations are unrealistic
- revenue growth is priced as infinite
- companies are spending billions on AI with no short-term monetization
- chip demand could normalize faster than markets expect
When a contrarian with Burry’s track record bets against a trend, it’s worth paying attention.
3. NVIDIA’s Valuation Is Stretched Even for a Hyper-Growth Company
Even bulls agree: NVDA’s multiples are once again aggressively priced.
Key issues:
• Price-to-Sales historically elevated
NVDA is trading at a P/S ratio that would be insane for any company approaching a $5 trillion market cap.
• Revenue growth expectations assume perfect long-term AI adoption
If AI monetization slows or plateaus even slightly, NVDA’s valuation collapses fast.
4. Are We in an AI Bubble? Many Indicators Say Yes
Top analysts, academics, and even bullish investors admit:
AI has bubble-like behavior.
Evidence of a bubble:
- Stock prices rising faster than actual earnings growth
- Companies buying GPUs “because everyone else is doing it”
- Zero clarity on monetization for many AI firms
- AI startups valued at billions with no revenue
- Media hype similar to 1999 dot-com sentiment
Harvard Business Review, Wired, and Investopedia already discuss the “AI bubble thesis.”
If AI expectations don’t materialize fast enough, NVDA becomes the single most vulnerable stock on the market.

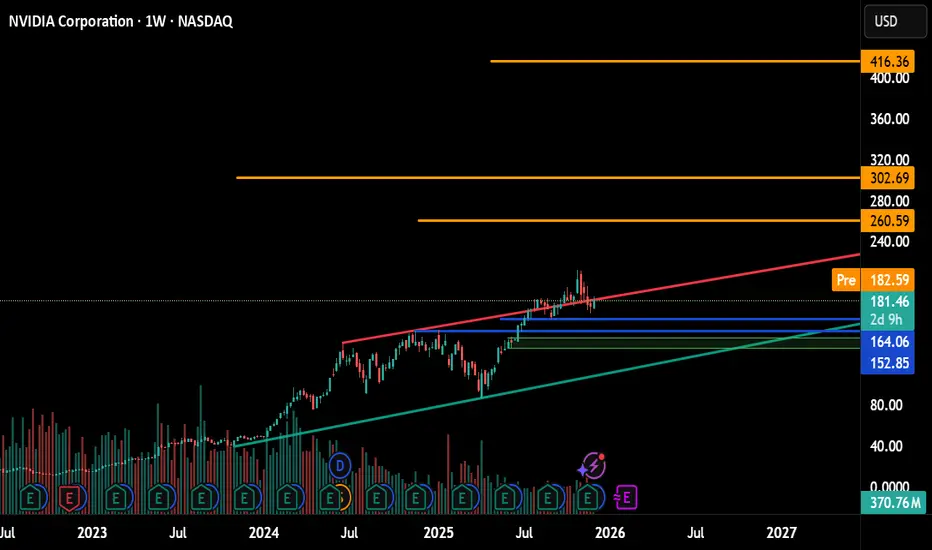
NVDA : Blue-chip and Strong potential for alpha returnsCMP : 181.46
Investment pick.. Long term.
Adding : if decline : 164-152 levels...
and 130 Stop Loss of course because we can not hold if it will give us negative long term price structure..
Manage your Risk..
Target : 260, 302, 416 + then review.
Logic : Rising channel and correction .. we are eyeing in it.
NVDA Weekly CALL Alert: Bullish Momentum + Extreme Options FlowNVDA QuantSignals V3 Weekly 2025-11-25
Ticker: NVDA
Signal Type: Weekly Options Setup (Expiry: 2025‑11‑28)
Direction: BUY CALLS
Confidence: 65% (Medium conviction)
Strike Focus: $177.50
Entry Range: ~$2.55
Target 1: ~$4.08
Stop Loss: ~$1.53
Weekly Momentum: Neutral (+0.59% 1W)
Options Flow / PCR: Bullish (PCR ~0.37)
Risk Level: Moderate — trending strength plus overbought indicators
🧠 Key Technical & Chart Insights
According to TradingView’s technical ratings, NVDA is currently neutral, with short‑term signals mixed and the 1‑week rating showing a prevailing buy trend.
TradingView
On the chart:
Price is trading around ~$176.71 in your system, above a recent support at ~$174.05.
Weekly momentum is neutral but 2‑week trend is bullish (+2.91%), suggesting underlying upward drift.
RSI is elevated (~72.1) and strength regime ~94.4%, which suggests trend heredity but also risk of pullback.
Key resistance zone near ~$184.56, and support near ~$174.05.
From published trade ideas on TradingView:
NVDA has faced a major resistance around ~$183‑185 region; a breakout above that could propel price higher, while failures may lead to pullbacks toward ~$165‑$175 zone.
TradingView
+1
Fundamental metrics show strong valuation: price‑to‑sales ~27.05 and EV/EBITDA ~45.58.
TradingView
+1
News & flow context: Despite some caution in sentiment (concerns about overvaluation, AI regulatory risk), the options flow (low PCR) signals institutional bullish bets.
🎯 Trade Rationale
The combination of strong trending regime + bullish options flow offers an edge for an upside trade.
Entry at $177.50 allows participation in breakout potential toward ~$183‑184, aligning with your target ~$4.08 (roughly +60% return) if the move plays.
Stop at ~$1.53 (~40% loss) balances risk/reward given moderate confidence.
The trade is time‑limited (3‑day expiry) — so timing and volatility matter.
⚠️ Key Risks & Watchpoints
RSI overbought and technical structure near resistance means upside is not guaranteed and may be limited if breakout fails.
If NVDA fails to hold support near ~$174, downside risk increases — especially given prior resistance around ~$183‑185.
The 3‑day expiry means time decay and implied vol shifts will heavily impact option premium.
News or sector rotation (e.g., semiconductor weakness, AI regulation) could trigger sharp reversal.
The neutral weekly momentum suggests strength, but not overwhelming strength — cautious size is warranted.
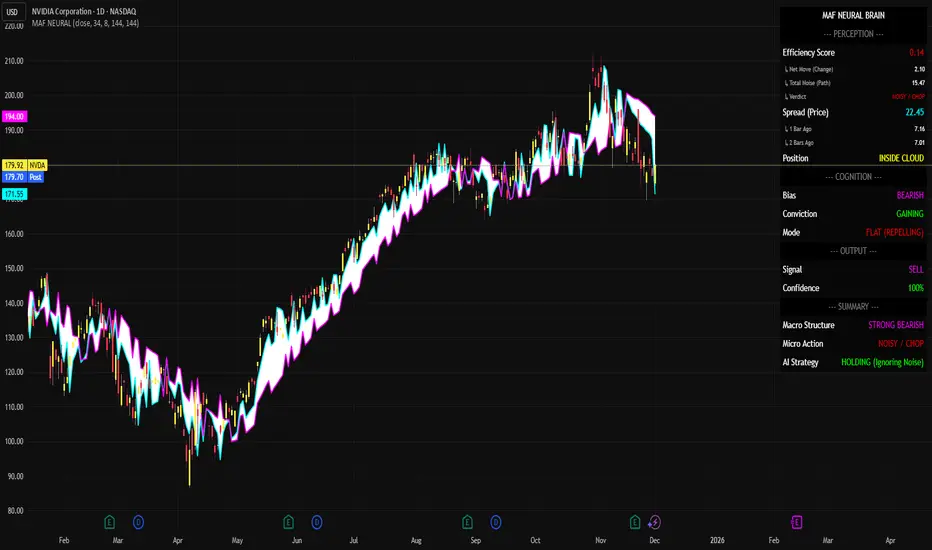
Trade Summary: Bearish Continuation with High ConfidenceYou are looking at the Daily chart for NVDA (NVIDIA Corporation). The broader trend is clearly bearish, and the MAF Neural Brain indicator has identified a high-probability continuation setup.
1. Perception (The Eyes): What the Indicator Sees
Efficiency Score: 0.14. This is very low, indicating "Noisy/Chop" price action. The daily candles are overlapping significantly, showing a struggle between buyers and sellers rather than a smooth trend.
Spread (Price): 22.45. Volatility is present but contained within the bearish structure.
Position: INSIDE CLOUD. Price is trading within the indicator's bands, confirming that this is a consolidation phase within the larger downtrend.
Trade Summary: Bearish Continuation with High Confidence
2. Cognition (The Mind): How the Indicator Interprets It
Bias: BEARISH. Despite the choppy daily action, the system maintains a negative bias.
Conviction: GAINING. This is the key insight. While the market looks messy to the naked eye, the algorithm's internal confidence in the downtrend is actually increasing. It sees the current chop as a pause before another drop, not a reversal.
Mode: FLAT (REPELLING). The market is stuck in a range that is resisting upward breakouts.
3. Narrative (The Story): The Strategic Output
Signal: SELL. A hard sell signal is active.
Confidence: 100%. The system is fully aligned. Every metric (Bias, Conviction, Structure) points to lower prices.
4. Summary (The Execution)
Macro Structure: STRONG BEARISH. The dominant force is selling.
Micro Action: NOISY / CHOP. The daily candles are messy.
AI Strategy: HOLDING (Ignoring Noise).
Trade Analysis: This setup represents a "Bear Flag" or Consolidation in a Downtrend.
The Opportunity: Traders often get shaken out during "Noisy" consolidations like this because they mistake the sideways movement for a bottom. The Neural Brain is explicitly telling you to ignore that noise.
The Action: If you are short, HOLD. If you are flat, this is a valid entry for a Short position, anticipating a breakdown from the current "Inside Cloud" consolidation.
The Verdict: The 100% confidence level combined with "Gaining Conviction" suggests the path of least resistance remains strictly downward.
In plain English: "NVDA is taking a breather after dropping, and the price action is messy. However, the internal data says sellers are still in total control and getting stronger. Don't buy the dip; expect the drop to continue."
NVDA long-term TANvidia is still keeping up the long-term uptrend but the mid-term is currently in distribution since the last couple of weeks, so let the news won't surprise you, it's healthy for Nvidia to fall lower and that's what it been doing recently. Some time is needed for Nvidia to bottom out, while long-term remains bullish, the mid-term is yet bearish.

Forex Trading Options1. What Are Forex Options?
A forex option is a derivative contract whose value is derived from an underlying currency pair such as EUR/USD, GBP/INR, USD/JPY, or AUD/USD. The buyer of a forex option pays a premium to the seller (writer) in exchange for the right—not the obligation—to buy or sell the currency pair at a predefined price, known as the strike price.
Options help traders manage risk, hedge exposures, and take advantage of directional or non-directional forecasts about the forex market. Because global currencies constantly fluctuate due to interest rates, inflation, monetary policies, geopolitical factors, and macroeconomic data, options give traders flexibility and control over how much they stand to lose or gain.
2. Types of Forex Options
Forex options are broadly divided into two categories: vanilla options and exotic options.
a) Vanilla Options
These are the most basic and widely used options. They come in two forms:
Call Option
A call option gives the buyer the right to buy a currency pair at the strike price.
Example:
Buying a EUR/USD call at 1.0800 means you profit if EUR/USD rises above 1.0800 before expiry.
Put Option
A put option gives the buyer the right to sell a currency pair at the strike price.
Example:
Buying a USD/JPY put at 150.00 means you profit if USD/JPY falls below 150.00.
Vanilla options are straightforward and behave similarly to stock options.
b) Exotic Options
Exotic forex options are complex instruments tailored for advanced hedging or speculative plays. Popular types include:
Binary (digital) options – payoff is fixed if a condition is met.
Barrier options (knock-in, knock-out) – activate or deactivate based on price movement.
Asian options – payoff depends on average price over a period.
Chooser options – allow the holder to choose later whether it is a call or put.
These options are commonly used by institutions rather than retail traders.
3. How Forex Options Work
To understand how options work in forex, you need to understand a few essential terms.
a) Strike Price
The pre-agreed price at which the currency can be bought or sold.
b) Premium
The cost of buying the option. It is non-refundable.
c) Expiry Date
The date when the option contract ends.
d) In-the-Money (ITM)
Option currently has intrinsic value.
e) Out-of-the-Money (OTM)
Option has no intrinsic value and expires worthless unless price moves.
f) At-the-Money (ATM)
Spot price equals the strike price.
4. Option Pricing – What Determines Premium?
The price (premium) of an option is influenced by multiple factors:
1. Spot Price
The current market price of the currency pair.
2. Strike Price
The closeness of the strike to the spot affects intrinsic value.
3. Implied Volatility (IV)
Higher volatility = higher premium.
Forex markets with instability or news events have high IV.
4. Time to Expiry
More time = more premium, since more time means more opportunity for the trade to become profitable.
5. Interest Rate Differentials
Different national interest rates influence currency pair forward values and options pricing.
6. Market Liquidity
Major pairs like EUR/USD have cheaper, more liquid options compared to exotic pairs like USD/TRY.
These factors combine via pricing models like the Garman-Kohlhagen model (a modification of Black-Scholes for forex).
5. Why Traders Use Forex Options
Forex options provide unique advantages not available in spot trading.
1. Limited Risk
The worst-case scenario for option buyers is losing only the premium.
2. Unlimited Upside (for Call Buyers)
If the currency skyrockets, the trader profits significantly.
3. Hedging Tool
Businesses hedge currency risk using options to protect against exchange rate fluctuations.
Example:
An Indian importer expecting to buy goods in USD may buy a USD/INR call option to lock in cost.
4. Flexible Strategies
Options can be combined in creative ways to profit from trending, stagnant, or volatile markets.
5. No Mandatory Execution
If the market goes opposite, the trader can simply let the option expire.
6. Popular Forex Option Trading Strategies
1. Long Call
Expect the currency pair to rise.
2. Long Put
Expect the currency pair to fall.
3. Straddle
Buy both a call and a put at the same strike.
Used when expecting high volatility.
4. Strangle
Cheaper version of a straddle; strikes are wider apart.
5. Bull Call Spread
Buy one call and sell a higher strike call.
Used when expecting moderate upside.
6. Bear Put Spread
Buy put at higher strike, sell put at lower strike.
Used when expecting moderate downside.
7. Protective Put
Used by investors holding forex futures or large spot exposures.
8. Risk Reversal
Combine a long call and a short put to express directional views at lower cost.
Each strategy serves a different market scenario—trend, range, or high-volatility environment.
7. Forex Options vs. Spot Forex Trading
Feature Forex Options Spot Forex
Risk Limited to premium Unlimited (stop-loss needed)
Flexibility Very flexible Less flexible
Cost Requires premium No upfront cost
Profit Potential Unlimited (calls) High but risky
Expiry Yes No expiry
Complexity High Simple
Options are ideal when uncertainty is high, while spot forex is better for immediate price speculation.
8. Risks Involved in Forex Options Trading
Despite protections, options are not risk-free:
1. Time Decay (Theta)
Options lose value as expiration approaches.
2. Complex Pricing
Requires understanding volatility and Greeks.
3. Low Liquidity on Minor Pairs
Wider spreads = less efficient execution.
4. Premium Cost
High volatility = expensive options.
5. Seller’s Risk
Option sellers can face unlimited losses.
Therefore, beginners should focus on buying options rather than writing them.
9. Who Should Trade Forex Options?
Forex options are suitable for:
Intermediate to advanced traders
Businesses hedging currency exposure
Investors wanting limited risk
Traders expecting volatility spikes during events (Fed policy, inflation, elections)
Swing and positional traders who want controlled leverage
Beginners should start with vanilla calls and puts before experimenting with complex structures.
10. Conclusion
Forex options are powerful instruments that provide flexibility, leverage, and limited risk potential. By understanding the mechanics of calls and puts, pricing factors, strategies, and risks, traders can use options to hedge against uncertainties or speculate on currency movements with precision. While more complex than spot trading, forex options offer sophisticated possibilities—especially in volatile global markets driven by economic data, central bank policies, geopolitical events, and macroeconomic trends. With proper knowledge and disciplined strategy, forex options can significantly enhance a trader’s toolkit and open new avenues for profitable trading.
Nvidia plummeted amid the threat of competition from GOOGL
Optimism surrounding the Gemini 3 and news that Alphabet (GOOGL) will internally supply its TPUs to Meta Platforms (META) supported the AI rally. On the other hand, Nvidia (NVDA) experienced a significant decline due to concerns over the potential GOOGL threat.
Mizuho noted that the "Google wins, OpenAI/Nvidia loses" trade is gaining traction, accelerating the sell-off in OpenAI-related stocks like NVDA and Oracle (ORCL).
Meanwhile, the US administration's decision regarding the allowance of NVDA's H200 chip sales to China remains a potential positive catalyst for future NVDA stock prices.
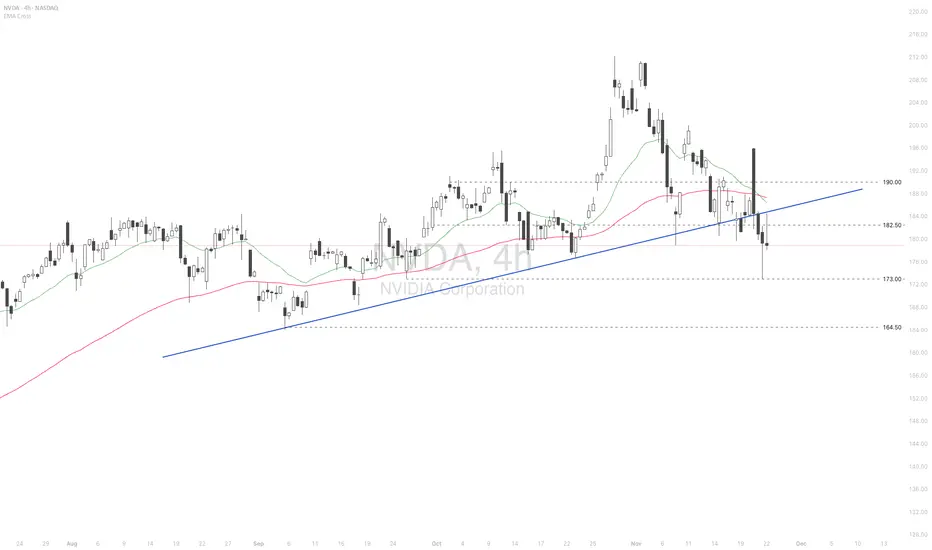
NVDA briefly fell below the support at 173.00 after breaking below the ascending trendline. Diverging bearish EMAs indicate a potential extension of the downtrend.
If NVDA breaks below 173.00 again, the price could further decline to the next support at 164.50.
Conversely, if NVDA closes above 182.50, the price may advance toward the following resistance at 190.00.

NVDA – Inventory Panic or Blackwell Positioning?Nvidia just became the center of another “AI bubble” debate after headlines highlighted a 32% Q/Q inventory increase. The surface-level take was bearish, but the clarification from management changed the context. According to today’s memo, the buildup is preemptive staging for the Blackwell platform, not a sign of weakening demand. These units are tied to presold systems, meaning this is logistics positioning, not channel stuffing.
On the tape, the story is more technical than fundamental. Heavy insider selling (CEO/CFO), hedge fund trimming, and SoftBank pressure all created the sell-side imbalance we’ve been seeing for weeks. But despite those headwinds, the chart continues to defend major support zones.
Key Observations:
• 177–178 acted as the first demand pocket, aligning with trend support and prior volume nodes.
• Price continues trading within a controlled downtrend, but each flush is producing diminishing downside extension—a sign of seller exhaustion.
• The real liquidity magnets remain below:
– 172.93
– 170.69
– 164.01 (golden support if the market unwinds further)
The bearish narrative points to elevated inventories and institutional unloading. The bullish narrative focuses on Blackwell staging and enterprise AI demand still being early-cycle. Both can be true at once. That’s why the environment favors high-probability scalps, not oversized directional bets.
My Read: This is a volatility market. NVDA is still in discovery mode, and both sides will get opportunities. Until NVDA reclaims 182.55, sellers maintain short-term control. A break below 172.93 opens a path into the 170/169s where real buyers should step in.
This isn’t about predicting a hero reversal—it's about respecting levels and trading the reaction.
📌 PROFIT TARGETS & STOP ZONES (Required by TV)
Upside Targets:
• 182.55 (first resistance)
• 186.20 (gap fill supply zone)
• 190.17–191.05 (major distribution shelf)
Downside Targets:
• 172.93
• 170.69
• 164.01 (golden support)
Invalidation / Stop Zone:
• Close above 186.50 invalidates the short-term bearish drift.
• Close below 170 invalidates the shallow bounce thesis and opens deeper liquidity.

NVDA: Key Support at 116.94 and Long-Term Target at 258.33NVDA is attempting to stabilize after a corrective decline, trading just above an important Fibonacci retracement cluster. The broader structure remains constructive as long as price holds above the major support at 116.94, which represents a strong liquidity base and a key long-term demand zone.
A sustained reaction above the current region may open the way for a continuation of the broader bullish cycle. The next upside levels to monitor are:
217.73 (0.75 Fib extension)
242.09 (0.90 Fib extension)
258.33 (primary upside target)
These targets remain valid while the price maintains a higher-low structure.
Alternative Scenario
If the current rebound fails, NVDA may revisit the major support at 116.94. A reaction from this level would still align with the long-term bullish outlook and may serve as a stronger accumulation point before the next upward leg.
Conclusion
The trend remains upward-biased with 258.33 as the main projected target, provided that 116.94 continues to act as the dominant structural support.

Can NVDA Hold the Pullback Zone and Extend the Uptrend?🔥 NVDA Bullish Pullback Playbook – Thief-Style Swing Setup 🚀🕵️♂️
Hey traders & my fellow Thief OG’s 😎🕶️ — here’s a clean, polished, TradingView-friendly version of my NVDA Swing Trade Playbook with a professional + funny touch. Let’s get to the setup 👇🔥
📌 Asset
NVDA – NVIDIA Corporation (NASDAQ)
Swing Trade | Momentum | Trend-Following Setup
📈 Plan: Bullish Pullback Strategy (Pending Orders Active)
The trend is strong, the buyers are steady, and NVDA is still delivering clean higher-lows. We're waiting for either a breakout continuation or a discounted pullback entry. 📊⚡
🎯 Entry Zones
1️⃣ Breakout Entry – Momentum Thief Mode 🥷⚡
Enter after clearing the nearest resistance at $191.00
• Clean breakout
• Volume confirmation
• Trend continuation strength
2️⃣ Pullback Entry – SuperTrend ATR Sniper Entry 🎯📉
Watch for a discounted pullback near $170.00 around the SuperTrend ATR zone.
• Trend support retest
• Lower-risk entry
• Ideal for swing traders who wait for “patience-pays entries” 😎
🛡️ Stop-Loss (Thief Style – Risk First)
Breakout Entry SL → $180.00
SuperTrend Pullback SL → $160.00
Note: Dear Ladies & Gentlemen (Thief OG’s) ❤️
I’m NOT recommending you use only my SL. Choose your own levels — you make the money, you protect the money. Trade at your own risk 🔐⚠️
🎯 Target (Take-Profit Zone)
Our target → $210.00
Why?
• Strong resistance zone
• Overbought region historically
• Buyer trap zone where police force 🚔👮♂️ usually waits — so escape with profits early 😂💨
Note: Dear Ladies & Gentlemen (Thief OG’s) 🙌
I’m NOT recommending you set my TP only. Choose your own TP — your money, your exit. Trade with responsibility 💼💰
🔍 Related Pairs to Watch (Correlation Insights + Key Notes)
NASDAQ:AMD
• High positive correlation with NVDA
• When AMD shows volume expansion, NVDA often follows
• Good for momentum confirmation 🔥
NASDAQ:SOXX (iShares Semiconductor ETF)
• NVDA is a major weighted component
• ETF direction confirms big-money flow 🧠💸
• Great for spotting sector-wide risk-on / risk-off shifts
NASDAQ:QQQ (NASDAQ 100 ETF)
• NVDA is one of the heaviest weights
• If QQQ trends strongly → NVDA often mirrors
• Macro sentiment index for tech strength 📊⚡
NASDAQ:SMH (VanEck Semiconductor ETF)
• Clean supply/demand signals
• NVDA mirrors SMH breakouts frequently
• Helps confirm breakout validity before taking the trade
All these help you avoid fakeouts and align with overall semiconductor market strength.
✨ “If you find value in my analysis, a 👍 and 🚀 boost is much appreciated — it helps me share more setups with the community!”
⚠️ This is a thief-style trading strategy created just for fun. Trade responsibly.
NVDA QuantSignals Alert: High-Volatility Bearish Move IncomingNVDA QuantSignals Katy 1M Prediction 2025-12-02
QuantSignals Katy AI Stock Analysis
Analyzed 1 stock(s): NVDA
NVDA Analysis
Current Price: $183.28
Final Prediction: $181.20 (-1.14%)
30min Target: $180.13 (-1.72%)
Trend: BEARISH
Confidence: 57.6%
Volatility: 37.9%
🎯TRADE SIGNAL:
Direction: SHORT
Entry: $183.28
Target: $181.62
Stop Loss: $186.03
Expected Move: -1.14%
Summary: Generated 1 trade signals from 1 successful analyses out of 1 symbols.

NVDA buy zone NVDA has had some bearish news recently despite very strong earnings. I believe this was the extent of the pullback and the stock has reached a local weekly demand zone. Given the multi year strength I doubt it pulls back to 130-140 but anything is possible. If I enter the trade here I’d be net long.

Why Structure Beats Prediction|The Core Philosophy of UIA **Why Structure Beats Prediction|The Core Philosophy of UIA
(英文为主・中文为辅)**
Most traders try to predict market direction.
But prediction is unreliable, emotional, and impossible to repeat.
At UIA Institute, our core belief is simple:
Markets cannot be predicted.
But structure can always be read.
(中文:市场无法预测,但结构可以被读取——这是 UIA 方法论的核心。)
🔵 1. Why prediction fails(预测为何不可靠)
Prediction depends on assumptions, and assumptions fail because:
Liquidity shifts without warning
Macro events disrupt trends instantly
Reversals never send a notification
Emotions distort expectations
Every prediction increases the gap between “what we think” and “what the market actually does.”
(中文总结:预测依赖假设,而假设越多,错误越多。)
🔵 2. Why structure works(结构为何可靠)
Structure is built from facts, not guesses.
Price → Volume → Reaction → Rhythm
These reflect what has already happened, and therefore can be read objectively.
Structure tells us:
T — When a trend starts
E — Whether the trend is extending healthily
H — Where key swing points form
X — When the trend is exhausted and ending
(中文:结构来自“市场已经发生的事实”,因此可被辨识、可被重复。)
🔵 3. Reacting beats predicting(反应比预测更强)
The UIA methodology is designed around one principle:
Don’t predict the future.
React to the structure.
Reacting means:
You act on confirmed information
You avoid emotional bias
You stay synchronized with real market rhythm
You reduce unnecessary trades
This dramatically improves consistency and longevity.
(中文:UIA 做的是“结构出现后再反应”,成功率高得多。)
🔵 **4. Structure is the only repeatable edge
(结构是唯一可重复的优势)**
Indicators change.
News changes.
Sentiment changes.
But structure is timeless.
Price will always move in rhythms of:
Expansion
Pullback
Continuation
Exhaustion
Reversal
This universal rhythm is why UIA focuses exclusively on structural reading.
(中文:结构具有可重复性,是任何市场、任何周期都适用的通用语言。)
🔵 5. Conclusion(总结)
Prediction creates stress.
Structure creates clarity.
Structure allows traders to understand:
What the market is doing now
When to participate
When to exit
When to stop
When to observe
When to wait
This is the foundation of the UIA Trend Engine, Wave Engine, and TSX Engine.
(中文:结构让交易回到“可控、可读、可执行”的节奏。)
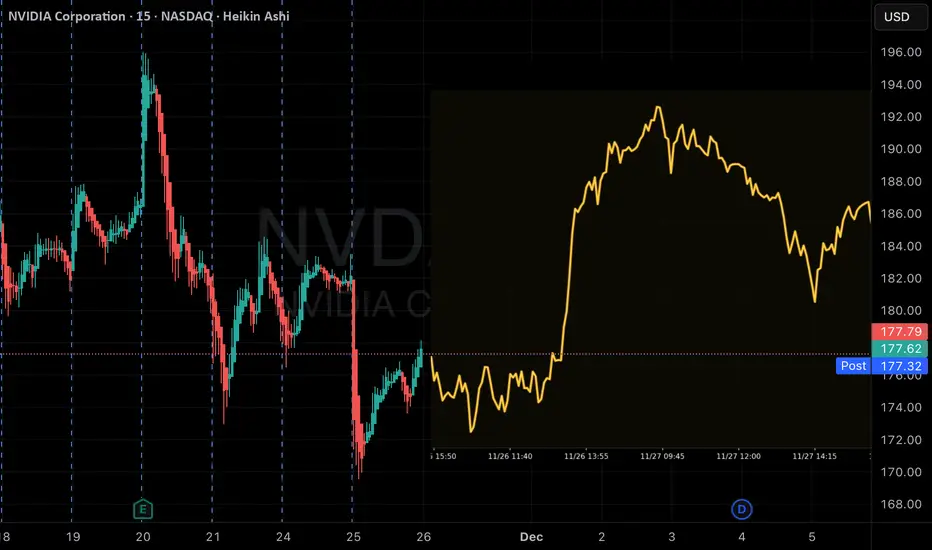
Nvidia loses steam despite exceptional 3Q performance
Nvidia (NVDA) posted a record-breaking 3Q performance, with revenue surging 62% YoY to 57 bln USD. Its 4Q guidance points to another 65% increase, reinforcing optimism that growth momentum will continue to accelerate. CFO Kress noted that the guidance does not include any contribution from China sales, while CEO Huang pushed back against recent AI-bubble concerns raised by Michael Burry.
Nevertheless, AI valuation risks remain elevated. Beyond strong earnings, the scale of AI infrastructure spending and the surge in bond issuance required to fund it continue to dampen investor sentiment.
Goldman Sachs (GS) has warned about the fragility in the private credit market. The firm highlighted that Blue Owl Capital, with more than 295 bln USD in AUM, over half of which is credit-exposed, has seen its share price fall nearly 30% since Sep. Major credit-heavy players such as KKR and Blackstone are also showing signs of pressure, underscoring how AI-driven anxiety is spilling into private credit.
NVDA briefly breached above the psychological level at 195.00 but surrendered all gains, falling back below 182.00. The price remains under the death-crossed EMAs, indicating a potential expansion of the bearish bias.
If NVDA breaks below the support at 173.00, the price could decline further toward the following support at 164.50.
Conversely, if NVDA breaches above the resistance at 182.50 and the ascending trendline, the price may advance toward the subsequent resistance at 190.00.
Stocks Worth Your AttentionI wanted to share a list of high growth, high margin stocks that are worth looking into. This is where I pull a lot of my core positions from.
HIMS is noteworthy as it's also one of the most heavily shorted stocks at the moment and THE best performer on my ranking.
These stocks are essentially cash cows dominating their space. Please do look into each one carefully. This list is algo generated and not combed through by me yet. So make sure the stock's earnings and trend are to your liking.
Enjoy and good luck!

NVDA | Post-Earnings Exhaustion Near Recent Highs – What’s Next?NVIDIA delivered another exceptional quarter, with revenue surging and demand for AI infrastructure remaining firm. Yet the market’s reaction was notably muted, signalling that expectations may already be stretched in the short term.
Technical Lens:
The share price gapped higher after earnings but struggled to break above its recent peak. It slipped back toward the pre-announcement zone, which suggests fatigue after months of strong momentum. The anchored VWAP from the last significant swing remains an important reference point below current prices, acting as fair-value support throughout the year.
Scenarios:
• If the anchored VWAP continues to draw price lower, the shares may drift into that support zone before sentiment resets and buyers return.
• If the post-earnings gap is reclaimed and price pushes through prior highs, it would indicate that momentum is re-energising sooner than expected.
Catalysts:
Upcoming macro data, broader equity market sentiment, and any fresh commentary on AI demand or supply constraints may influence whether NVIDIA consolidates or attempts another move toward new highs.
Takeaway:
The fundamentals remain strong, but the technical picture hints at a near-term pause. The anchored VWAP zone sits as the key decision point for the next phase of the trend.

NVIDIA (NVDA): Where Are We in the Cycle?Ticker: NVDA
Category: Market Structure / Elliott Wave Analysis
Author’s note: Educational analysis — not financial advice.
🧠 Market Context
NVIDIA has been one of the strongest growth stories in the last market cycle. However, after such a powerful move, many traders are now asking: Where are we in the broader structure — and what could come next?
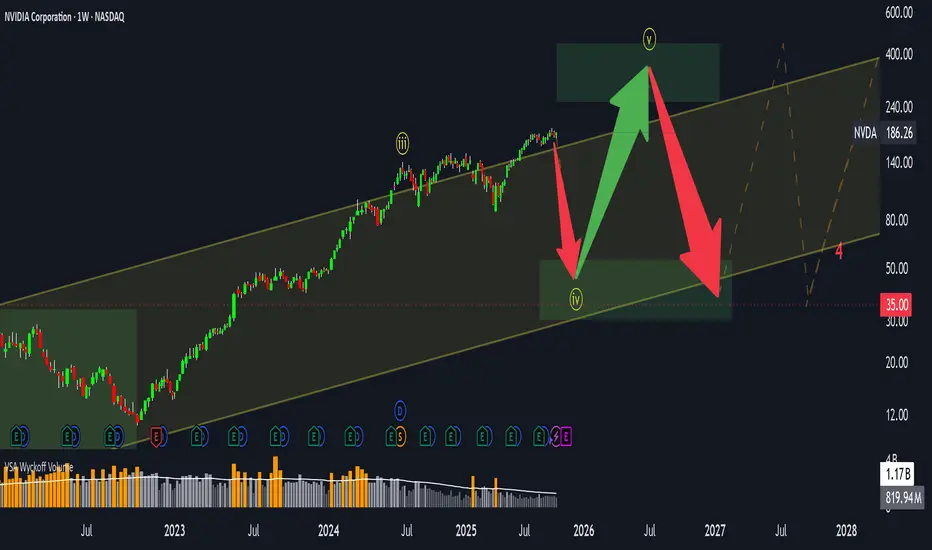
From a structural perspective, NVDA appears to have completed its third Elliott Wave, with the fourth wave currently in progress. This phase often reflects a period of consolidation, where the market digests previous gains before potentially starting the fifth wave.
📊 Elliott Wave Structure
Through the lens of Elliott Wave theory:
Wave 3 — likely completed after the parabolic advance that marked NVIDIA’s latest all-time highs.
Wave 4 — a corrective phase, potentially forming a sideways or slightly downward structure.
Wave 5 (ahead?) — may still occur, possibly extending above the upper boundary of the current price channel.
However, once the fifth wave completes, markets typically enter a longer consolidation or corrective phase — often retracing 50–60% of the total move from the highs.
⚙️ Volatility and Price Range
Currently, NVDA is trading within a broad channel, roughly between $100 and $400+.
Volatility remains elevated — which suggests that the sideways phase could persist for several months, or even longer.
Such behavior is common in late-cycle stages when large market participants distribute part of their holdings while retail interest remains high.
📈 Key Takeaways
The main impulsive move seems to have already played out.
The market may enter a range-bound or sideways phase, with local rallies still possible.
Correction risks are gradually increasing, especially if the fifth wave develops and fails to sustain new highs.
In short, this might not be the best time to chase — but rather to observe how price behaves within the current channel.
💬 Final Thoughts
This analysis is purely educational and reflects one possible scenario based on market structure.
No one can predict the exact timing or depth of the next move — the market always decides.
👉 What do you think?
Are we already in the correction phase, or is there still one more leg up left for NVDA?
Share your view in the comments below 👇
NVDA in BUY ZONEMy trading plan is very simple.
I buy or sell when at either of these events happen:
* Price tags the top or bottom of parallel channel zones
* Money flow volume spikes beyond it's Bollinger Bands
So...
Here's why I'm picking this symbol to do the thing.
Price in buying zone near bottom of channels
Money flow momentum is spiked negative and under bottom of Bollinger Band
Entry at $170
Target is moving average at $185
Looking to catch a quick bounce this week.
Will be buying as low as $167.
Set your own stop.
$NVDA Structure keeps improving for a move lower.Just added to my NASDAQ:NVDA short.
Structure keeps improving for a move lower.
And the competitive pressure is real:
NASDAQ:GOOGL ’sTPU stack is becoming a legitimate alternative to Nvidia for training/inference.