RIG outlookSo looking at RIG on both the monthly and weekly chart, we seem to be due for a correction after a long run upward.
1. We are currently retesting a resistance at which we got rejected recently on the 24th of nov, but also in August and in June, I see this as a high probability area for a breather on the latest upward run.
2. We are approaching the W-cloud, which adds extra resistance.
3. We've recently broken and continued upward from a downward trendline (blue arrow), but without properly retesting it (not always necessary as we did see a brief retest on the daily).
If indeed we get rejected around the area of USD 2.50-2.70, then I will be looking at the following areas for a potential buying opportunity. (There is a possibility that we fill an old gap at 2.85 first as well)
Both the 0.382 fib, the 0.5 fib and the 0.618 fib are potential retrace areas, but I'm looking for confluence of support as well.
The 0.382 doesn't line up with any other areas of interest at the moment.
The 0.5 however lines up with a strong area of horizontal support, making it a more likely candidate. A retrace till here could also potentially see a retest of the previously mentioned trendline (blue arrow). See the orange scenario.
The 0.618 is below what seems as the strongest support. But in a scenario where we need to complete an inverted Head&Shoulders pattern, this area (or beyond) might also still come into play. See the red marks for the iH&S and the green scenario.
So to conclude, it's more likely that we do a retrace soon, then for the uptrend to simply continue. If looking for a selling area, look at USD 2.50-2.70 and perhaps even at the gap at USD 2.85.
If a retrace indeed happens we need to wait for price action to reach the areas mentioned above and wait for buy signals.
If I'm wrong and the trend continues upwards, wait for breaking of resistance and the retest of this resistance.
Trade ideas

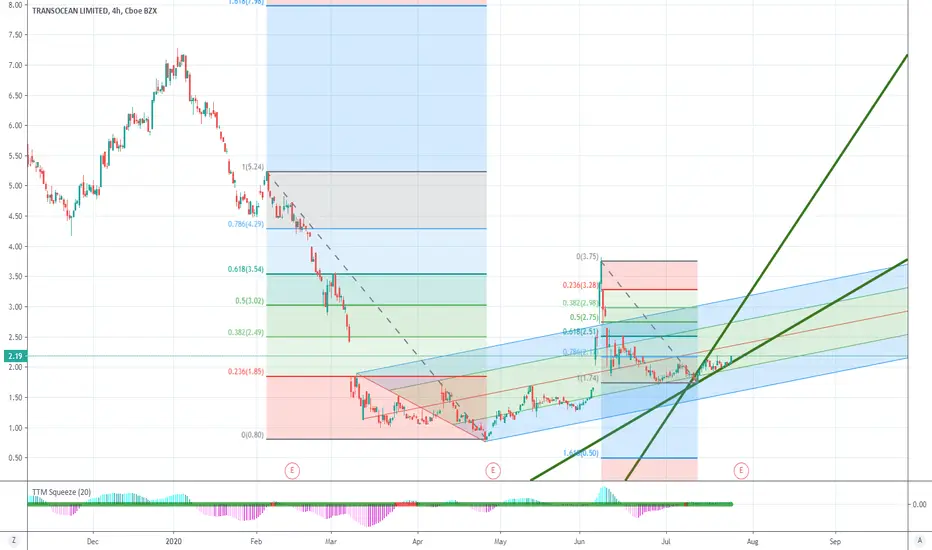
RIG Brekout Stock AlertBREAKOUT STOCK ALERT
$RIG - Transocean Ltd (Switzerland) Common Stock
Initial Alert Price: $2.31
Potential Price: $3.82
Potential Gains: 65%
Stop Loss Limit: $2.19
RIG is currently trading in a Continuation Breakout Pattern and working to break the $2.62 Levels of Resistance. If it does, then we expect this retest the $3.82 Level no later than March, if not before due to a catalyst or the Oil Industry finally getting a grip on Production Cuts to account for lower demand in regards of the pandemic. #Breakout #Stocks #Trading #Investing #Alerts #StockMarket #Daily #News #Today
Follow for more trade alerts and information & egister your account for Instant Alerts by clicking the link in our signature.

RIG awaiting entry pointSo RIG has been on a huge surge upwards since the end of October, clearly creating some bullish momentum.
Recently the major resistance of USD 1.60-1.80 has been broken upward.
Now I'm looking for a retracement that will provide a good entry point.
Both the 0.318 fib (which for now already has created some support around USD 1.96-2.01) and the 0.5/0.618 fibs are areas to watch.
I'm inclined to say that the 0.5/0.618 fibs are more likely to be retested as they line up exactly with the former major resistance we recently broke (1.60-1.80 as mentioned before).
But we'll have to simply wait and see where a clear sign of support will be formed and then enter the market.

Rig is a buy here11/25
Crossing 50 on the RSI on the 3 day chart. There might be some pullbacks along the road but major up trend has been established it looks like.
Disclaimer, this is only for entertainment and education purposes and doesn't serve by any means as a buy or sell recommendation.
Personally I hold both long term long positions and occasionally short term short position, for disclosure purpose.


Transocean Ltd. Announces Deepwater Corcovado, Deepwater MykonosRIG: Transocean Ltd.
2020-11-18 16:16:03
Transocean Ltd. Announces Deepwater Corcovado, Deepwater Mykonos Contract Extensions


Transocean Ltd. (RIG) may be at a turning point.The latest earnings beat expectations, Transocean could end up as the sole survivor within it's market segment & we might see a mighty short squeeze in a very near future.


K.I.S.S. Can RIG hold THE trend line?Since the beginning of 2010, there have been 5 rejections of a MAJOR RSI trend line on the 3 month big boy time frame, which closes soon.
A successful breakout finally occurred on the 6th attempt.
From the start of the trend line until the point of breakout between Janury and April of 2018, this has held as resistance for just under 8 YEARS STRAIGHT.
3 Monthly candles so far since have closed almost directly on this line, showing buyer support:
The monthly shows an interesting situation. In March, the RSI dipped well below this trend line, but was rejected at entering oversold.
After the oversold rejection, there was another attempt to break back above the trend line. It was rejected:
HOWEVER.
The last monthly was able to close a higher low in the RSI.
The weekly chart is showing that RIG is still above that trend line, but very close:
The daily rose beyond this trend line, but fell back below and has confirmed it as resistance.
This insinuates there is likely still more downside to come yet:
Interestingly, the daily RSI rejection of this trend line also coincides with my mock bear flag on two seperate occasions as shown:
After price fell below my mock bear flag, there was one more test of support and then a nearly 400% rise thereafter.
Not saying this will for sure happen again but it is most definitely worth noting.
To give even more credibility to a possible bounce here:
Histogram and MACD divergence:
3D showing the RSI is now directly on the trend line:
Some positive news:
seekingalpha.com
I'm looking for a liquidity hunt in the mid 80 cent region and buying a small amount of shares there.
If there is serious volume behind the move, this could potentially dump much lower than that.
My shares *will* be a long term hold.

RIG opportinity for a few good tradesRIG ....under pressure
looking for bump then settle into bankruptcy


$RIG 30% Upside for TransoceanTransocean Ltd. engages in the provision of offshore contract drilling services for oil and gas wells. It also owns and operates offshore drilling fleet such as ultra-deepwater, harsh-environment, deepwater, and midwater rigs. The company was founded in 1954 and is headquartered in Steinhausen, Switzerland.

RIG: Descending Triangle, ConfirmedDescending Triangle, Confirmed
Pros
200MA descending
PPS below 50MA and 200MA
ATR descending, less volatility
Broke support with lots of volume
250RSI below 50
RS below 0 and falling
No support below the current level
Target price
If downtrend continues, could become fractionnal

RIG if pattern confirm OP up to $5Cup and handle pattern still on the going, but I change the objective price up to $4.9X to $5.06
MACD confirms the bearish movement, so we can expect the price goes lower, also StochRSI shows that we're on the bottom of the oscillation, so we can wait a few more days for the rising movement and the probabilty of a bullish trend if C&H pattern is confirmed.
I think we can achieve the objective price before the next earnings results on august 2nd.
Anyway: this is not an investment advice. but I'm in and I'll wait to see this.
I think this is the same pattern for (with different objectives of course):
NASDAQ:CDEV
NYSE:CPE

RIG - ready to move?Looks like it! RIG is bumping up against key resistance and a break should bring some higher prices and possibly an attack of the $3.82 high from three months ago. Watching closely!

RIG - onward and upward?RIG is starting to perk up after holding its breakout area around $1.75. It held at the golden pocket marked by the $.76 low and recent $3.82 high. That high represents resistance that will take a little more consolidation action before a definitive push thru. The first attempt was parabolic and if you owned this in size for the $1 it traded at for better than a month you made out in spades. BTW it's $2 now and looks to me like there may be better times ahead. Targets galore on the chart but that $3.82 is the number to watch. A good push thru there and we're back in the original yellow channel that was the start of what looked like yer beginning of the next bull market for the stock. Same story big debt but they've got contracts going out 11 years. BK always a possibility but Transocean has been around for a long time and has been thru a lot. I remember when LVS traded down to a dollar and you looked at it and said it was a back up the truck moment back in 2008. IMO RIG should continue to move onward and upward and survive coronavirus. The only question is how big a truck.

