META – Weekly Chart📈 META – Weekly Chart Overview
A technical rebound may be starting to form.
Several signals from The Wave system are aligning:
✅ Price in the buy zone
META has retraced into a historically strong demand area, perfectly overlapping with the Wave buy signal zone.
This region has acted as a springboard multiple times in the past.
✅ Undervaluation on higher timeframes
The stock is currently trading near its dynamic trendline support, combined with oversold readings on momentum indicators.
This suggests the correction might be approaching exhaustion.
✅ Momentum turning
The stochastic is bottoming out exactly where previous weekly reversals occurred.
RSI also shows early signs of stabilisation.
🎯 Potential scenario
If buyers step in from this level, META could aim for the upper resistance area marked on the chart, offering an attractive risk-to-reward of 3.3 — a favourable setup for medium-term swing traders.
🛑 Invalidation
A clean break below the SL area would shift the structure and invalidate the bullish setup.
This is a textbook example of waiting for high-probability zones rather than chasing the price, discipline always pays.
Trade ideas

META now close to a critical trendlineMETA is approaching a significant technical region.
The trendline currently in focus originated on 31 October 2022, and it has remained relevant over time.
This same trendline was retested twice in April of this year, and price action is once again moving toward it after achieving a new all-time high.
At the moment, the asset is sitting at the Fibonacci 61.8% retracement level — a well-known zone where reversals often occur. Based on this structure, the asset may begin its upward move from the current region, or it may decline by an additional $10–$20 to retest the ascending trendline.
I have taken my initial positions in META during this pullback and may increase my exposure if price reaches the trendline.
Overall, my outlook remains bullish.
Trade responsibly.
Entry: RR is 1:3
Confidence: High

META QuantSignals V3 | Moderate Risk alretMETA Swing Signal — (2025-11-28)
Instrument: META
Direction: BUY CALLS 📈
Confidence: 60% (Medium)
Horizon / Expiry: 14 days → 2025-12-12
Strike Focus: $650.00
Entry Range: $12.50 – $13.50 (mid $13.00)
Target 1: $19.00 (+50%)
Target 2: $25.00 (+100%)
Stop Loss: $8.50 (-35%)
Position Size: 3% of portfolio
Risk Level: Moderate — sector volatility and mixed technical signals
Katy AI Signal
Bullish prediction targeting $680–$700 in 14 days
Strong AI sector momentum and technical breakout potential
Katy LLM Conflict: LLM recommended CALLS, but Katy chart shows PUTS (-8.40% predicted) — medium confidence
Technical Context
Current Price: $645.62 (near session high $646.25, above VWAP $606.50)
Support: $600–$610
Resistance: $650–$660
Momentum: Bullish after 6.93% intraday gain
Market Context: STRONG_BULLISH overall; SPY & QQQ bullish
Options Flow
Put/Call Ratio 0.73 → bullish sentiment
Some hedging at $730 put, but overall call buying interest
Neutral flow bias, supports potential upside
Trade Setup & Strategy
Why This Trade: Captures AI sector momentum in large-cap tech swing play
Timing Advantage: Enter after significant intraday gain; aligns with continuation pattern
META — Watching for a Potential GAP Closure.Hello Everyone, Followers,
META is the second one for Today.
After disappointing financial report, It created big GAP between 742 to 680 .
The GAP is still unfilled.
Then META has shown a solid rebound after weeks of heavy selling. The chart is now structured around one key element:
🔍 Chart Highlights
- Price is now broke the 631 and closed over this level. This level is now our new Support level.
- The GAP zone around 680–700 remains open and is a magnet if momentum continues.
- The long-term yellow trend support line held beautifully — buyers stepped exactly where they should.
-A push into the GAP zone is the logical next step if META holds above 630 - 631.
🔹 Outlook
- META has room to retest the GAP area near 700–720.
- A breakout above the 50 MA strengthens this scenario. (Green Line)
- A rejection could bring the price back toward 595.
🔹 My Plan
If META closes multiple days above 631, I expect continuation into the GAP region.
If it pulls back, 595 is my key support area to watch.
If you enjoy and like clean, simple analysis — follow me for more.
This is just my thinking and it is not invesment suggestion , please do not make any decision with my anaylsis.
Have a lovelly Sunday to all and Good Start a Week.
#META #SPX500 #NASDAQ

META — Setting Up for a Potential 50% Upside?META (Weekly Chart) is showing a strong technical setup after a healthy multi-week correction. Price has bounced exactly from the long-term rising trendline + 100-WMA zone — a region that has historically acted as a strong accumulation area.
🔍 Key Bullish Signals
Bullish candle forming near structural support, indicating buyers stepping in.
Price holding above major MAs: 100W, and 200W → long-term trend intact.
MACD flattening near zero-line, often a precursor to a fresh weekly bullish crossover.
A bounce from the current trendline opens room to the next Fibonacci cluster at
~$980–$1,000, which is approximately +50% from current levels.
🎯 Upside Projection
Current Price: ~$648
Potential Target (Fib 2.618 extension): ~$990
➡️ Estimated Upside: ~50%
If META confirms a weekly close above the current range resistance, the path toward higher Fib zones becomes technically valid.

looking good this bouncemaybe if NVDA dips a bit with google, the money rotates to Meta, time will tell

Meta Wave Analysis – 3 December 2025
- Meta reversed from support zone
- Likely to rise to resistance level 700.00
Meta recently reversed up from the support zone between the round support level 600.00 and the support trendline of the daily Down Channel from July.
The upward reversal from this support zone started the active short-term impulse wave 1 of the intermediate impulse wave (C).
Meta can be expected to rise further to the next round resistance level 700.00 (former monthly low from July and October).

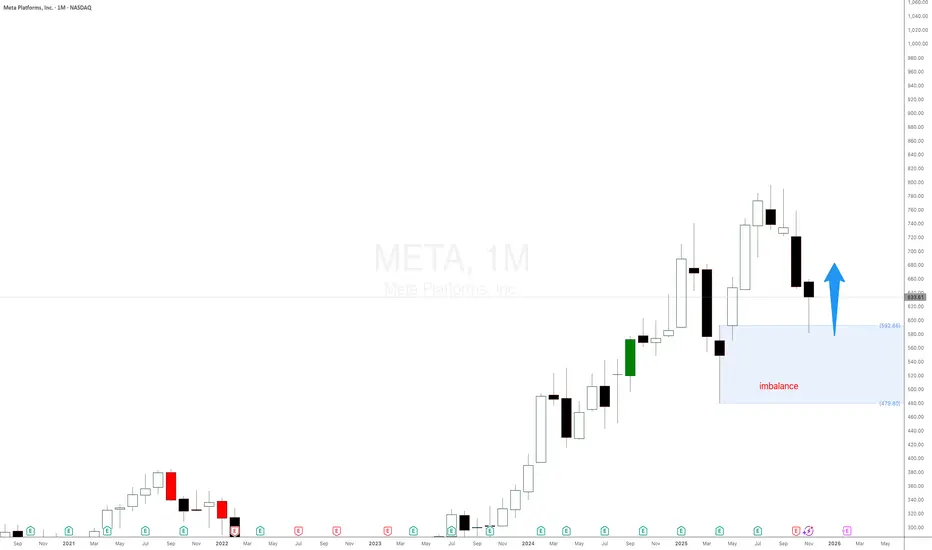
Meta Plafforms stock $META is exploding as expectedMETA Platforms NASDAQ:META is reacting nicely to the monthly demand imbalance at $592 as mentioned in the last update. Using pure supply and demand price action. META’s big drop was predictable from the monthly and weekly imbalances, and how the current reaction was part of the plan all along. Expecting a decent rally.
META — WEEK 49 TREND REPORTNASDAQ:META — WEEK 49 TREND REPORT
Ticker: NASDAQ:META — 12/02/2025 @ 647.10$
Timeframe: WEEKLY
This is a reactive structural classification of NASDAQ:META based on the weekly chart as of this timestamp. Price conditions are evaluated as they stand — nothing here is predictive or forward-assumptive.
⸻
1) Current Trend Condition
• Trend Duration: +9 weeks (Bearish)
• Trend Reversal Level (Bullish): 670.20$
• Trend Reversal Level (Bullish Confirmation): 688.75$
• Pullback Support: 645.90$
• Correction Support: 525.73$
⸻
2) Structure Health
• Retracement Phase:
Correction (approaching 61.8%)
• Position Status:
Unstable (price below both structural layers)
⸻
3) Temperature :
Cooling Phase
⸻
4) Momentum :
Bearish
⸻
5) Market Sentiment
Bearish
⸻
Author’s Note
This analysis is fully reactive, not predictive. Market conditions, trend structure, and behavior are classified as they appear in real time. The objective is to identify where directional shifts first occurred, where structural integrity remains intact, and where it would begin to weaken if key levels were breached.
Predictive analysis projects outcomes that do not exist yet. Without price confirmation, prediction is built on baseless assumptions. This framework avoids that entirely by responding only to verified structural changes and live conditions.
The levels shown simply identify where the current trend structure first shifted and where it would begin to lose integrity if breached. Recognizing these boundaries allows for clearer interpretation of market behavior without relying on forward guarantees, speculative projections, or unsupported assumptions.
⸻
Methodology Overview
This classification framework evaluates directional conditions using internal trend-interpretation logic that references price behavior relative to its structural layers. These relationships are used to identify when price movement aligns with the framework’s criteria for directional phases, transition points, or regime shifts. Visual elements or structural labels reflect these internal interpretations, rather than explicit trading signals or preset indicator crossovers. This framework is observational only and does not imply future outcomes.

Nasdaq Rallies into Thanksgiving, Meta Bounce Kicks InWall Street sentiment has perked up on renewed Fed cut bets, with the Nasdaq leading the way. This has allowed Facebook to finally rally from support levels I highlighted 3 weeks ago.
Matt Simpson, Market Analyst at City Index.

META - Weekly - Dealing With a Fibonacci LayerThe asset is currently at a crucial Fibonacci resistance layer, suggesting a near-term ceiling or range-bound trading zone, which complicates immediate price action, although the 200-day EMA appears to be the more reliable support level compared to the 100-day EMA. This technical caution is amplified by a pattern of decreased weekly volume since early 2024, mirroring the distribution phase seen before the July 2021 correction, which strongly indicates a likely, gradual correction to the $500 or potentially the $300 level. Fundamentally, the company remains robust in the long term due to strong annual net income and revenue growth, normal debt levels, and ample free cash flow and cash equivalents; however, the significant quarter-over-quarter drop in net income from Q2 2025 to Q3 2025 raises short-term skepticism about its immediate health, aligning with the bearish technical outlook for a substantial correction before the long-term fundamentals can drive the next major upswing.
Not financial advice, always do your due diligence
Leave a like👍 and/or comment💬.
We appreciate and value everyone's feedback!
- RoninAITrader

META Stock Tip LongHere is our stock signal for NASDAQ:META
Meta Stock Signal
🎉Entry: 597.13
⚠️SL: 482.50
✔️TP1: 732.42
✔️TP2: 911.95
✔️TP3: 1134.37
Don't forget, if you are on a challenge/funded you can trade main stocks
Hope all of our friends in USA have a good holiday
Best
ETAforex

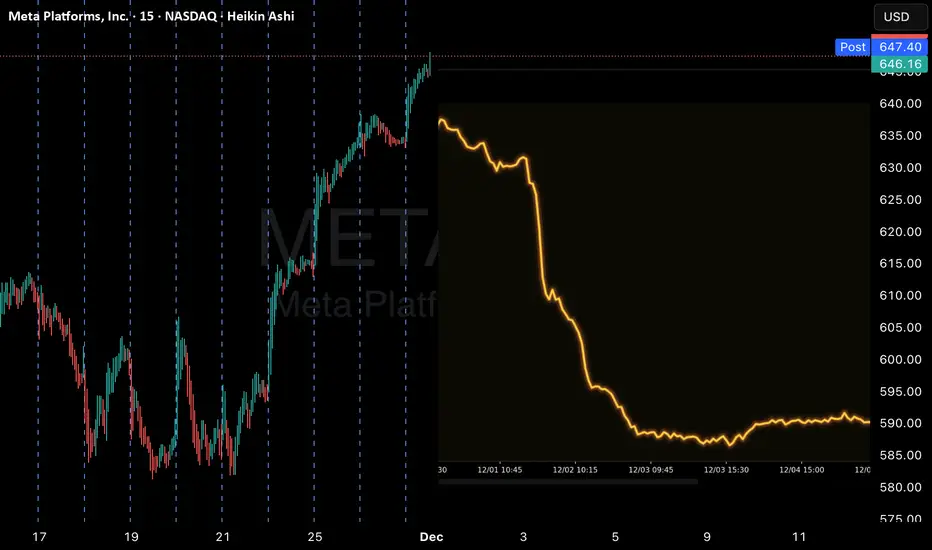
META’s Run Today Was Strong — Watching These Levels for Nov 26
META had one of the cleaner intraday trends today. The move off the morning base was almost textbook: steady higher highs, shallow pullbacks, and candles riding right along that rising trendline you drew on the 15-minute chart. Whenever you get a move that smooth, it usually means the order flow is very one-sided — and judging by the absence of deep pullbacks, buyers were the ones in control all day.
But after that last push into the 635–637 zone, the pace changed. The candles started flattening out, and META began drifting sideways right under resistance. That’s usually where the market takes a breath and waits for new orders to come in. The trend is still intact — nothing about the structure looks weak — but the last few candles clearly show hesitation near the top of the day’s range.
Let heck the 1-hour GEX chart below, the hesitation makes sense. The entire area above 637 is loaded with call walls. You’ve got multiple levels stacked between 640, 645, and then 650. When price runs into heavy GEX resistance like that, it often slows down because market makers start hedging the other way. It doesn’t mean META is bearish — it just means it needs real momentum or volume to break through those overhead layers.
Below price, META actually has a pretty friendly GEX landscape. There’s solid put support around the 615–620 zone, and a deeper cushion around 592 if the market ever decides to do a full reset. That lower band is why META rarely dipped today — option structure was keeping a floor beneath it.
Going into Nov 26, the levels are straightforward:
If META can break through 637 with a decisive candle — not just a wick — then 640 becomes the next magnet. And if the stock gets enough push to chew through that, the next meaningful level is 645. That’s where the thicker call wall sits.
If META slips back under 630 and stays there, we probably see a cleaner pullback into 625 or even 620 just to cool the trend. That’s the zone where buyers likely step back in, since it lines up with both intraday structure and GEX support.
Option Trading Plan
Calls only make sense if META can actually get a clean break over 637. That’s where the air pocket sits. Between 637 and 640, META usually moves fast because there’s less hedging friction.
Puts don’t make sense unless price loses 630 with conviction. Below that, 625 and 620 become natural targets. Above 630, put premiums will get eaten alive because the overall GEX structure still favors the long side.
Disclaimer
This is just my personal view based on chart behavior and options data. It’s not financial advice — always trade your own plan and manage your risk.

$META: Wave 3 to start soonNASDAQ:META : The bear market of 2021-2022 ended a higher degree 5-wave sequence and started a new 5-wave sequence, which is Wave .
Tariff scare completed Waves I and II of . Wave III of started at the bottom.
We've had a very aggressive Wave 1 of III and a deep Wave 2 of III. I expect Wave 3 of III to make a new high, reaching 1.618% length of Wave 1.

LONG META ~630 - TARGETING 730-750After the stock took a major hit driven by a one-time tax charge, we could see the buyers decided to come in at ~600 level, the stock was bought the whole trading day of Nov 25th, and we can see it is turning into a bullish pattern.
RR is very good here and this potentially could lead to a huge move upwards.
Target price should be previous local highs - 740-750 (Feb/Jun/Oct)
Stop should be placed bellow 600 price level, and lose of that level should signal that this was a false move.
This move can lead to a 15-18% uptrend.
BH

Patience pays off? Long METAI've been patient with META. I've been wanting to go long here since earnings, but I also wanted to see if we'd get closer to the lower trendline. Luckily I waited. But I'm at a point I don't want to wait longer to start my position/trade.
The reasons:
1. That lower trendline has held since October 2022. I might do something I rarely do which is set a stop loss somewhere like $530, just in case. But I think the bulls will jump back in here.
2. Look at the MACD. The last time it looked like this, Meta went on a run from $490 to about $750.
3. There's bullish divergence starting to appear in the RSI which is also oversold at 26.5
4. For the past 2 quarters, the POC is almost exactly where we are. This volume should at least slow the drop, and potentially work as a floor to bounce off of.
I'm not planning on holding this long term, but I will if I have to.
I just bought 25% of my trade and I'll DCA 3 more red days as long as it stays above the trend line. If it drops below the trendline, I'll hold and wait to see what happens with the structure.
I have 3 targes as usual:
Take Profit 1 = $650 (I think the 200day will be there) and I'll sell 50% of my position.
Take Profit 2 = $680 (there's some volume resistance there) and I'll sell 50% of my remaining position.
Take Profit 3 = $850 or if it touches the upper trendline.
Good luck!

QuantSignals V3: META Lacks Sufficient Momentum for TradeMETA QuantSignals Katy 1M Prediction 2025-11-26
Ticker: META
Signal Type: QuantSignals Katy 1M
Date: 2025-11-26
🔍 Analysis Summary
Current Price: $636.90
Final Prediction: $636.00 (-0.14%)
30min Target: $637.62 (+0.11%)
Trend: NEUTRAL
Confidence: 42.4% (Below trade threshold)
Volatility: 12.6%
⚠️ Trade Signal
No trade signal generated
Reason: Insufficient confidence and insufficient move size
Market shows flat momentum with tight trading range.
📌 Summary
0 trade signals generated from 1 analysis.
Recommendation: Wait for stronger trend or higher confidence before entering a trade.

Facebook (Meta) dip-buying momentum points to rebound this week
Current Price: $588.18
Direction: LONG
Confidence Level: 70% (Several professional traders highlight strong fundamentals and are actively buying dips; X sentiment leans bullish despite recent pullback)
Targets:
- T1 = $605.00
- T2 = $625.00
Stop Levels:
- S1 = $580.00
- S2 = $570.00
**Wisdom of Professional Traders:**
Bringing together the collective insights of numerous professional traders, the consensus is that Meta’s recent 20–27% pullback from the $750 highs is creating a buying opportunity. Many traders are accumulating positions below the $615 level, noting that the fundamentals—$189 billion in revenue, $58 billion net income, aggressive AI infrastructure investment—remain intact. Several traders characterize Meta as deeply undervalued compared to other tech peers, with fair values well above current prices. This crowd wisdom suggests the stock has room for a short-term rebound.
**Key Insights:**
The main thing I’m watching is the aggressive dip-buying discussed in multiple analyses. Several traders pointed out that the 20–23% correction from recent highs has brought the price into a strong support zone around $580–$590. This level has been mentioned repeatedly as a line-in-the-sand for stopping further downside. The bullish bias is reinforced by the fact Meta’s P/E ratio is far lower than that of many speculative tech names, giving it more resilience during market volatility.
What’s interesting is that despite near-term technical weakness (trading below the 233-day moving average), the majority of traders I’ve tracked believe this is a short-term oversold condition rather than the start of a deeper downtrend. Combining that with X sentiment showing a majority of bullish tweets suggests momentum could turn higher quickly if that support holds.
**Recent Performance:**
This all played out in the price action last week—Meta slid from $615 toward $580, marking over a 20% drop from its October highs. Large-volume selling early in the week was met with accumulation by dip buyers towards Friday. For context, this correction is in line with other Magnificent Seven stocks, but traders note Meta’s relative value is stronger than most, making it a prime candidate for a bounce.
**Expert Analysis:**
Multiple professional traders are watching for a rebound toward $605–$625 in the short-term, citing repeat tests of the $580–$590 support zone. Several identify upside catalysts in AI and infrastructure expansion, alongside share buybacks, which could bolster earnings per share. The trader consensus often references fair value estimates well above $660, meaning this week’s targets remain conservative, focusing on achievable levels based on near-term technicals.
The $615 line is widely watched as the first hurdle for upside momentum; closing above it would likely trigger heavier buying.
**News Impact:**
Recent headlines around Meta’s half-trillion-dollar AI data center investment over the next three years are bolstering long-term sentiment. While there have been concerns about high capital expenditures and VR product traction, these haven’t shaken long-term bullish fundamentals. The market’s reaction to the pullback appears more tied to sector-wide tech corrections than company-specific weakness. This creates an environment where news about AI initiatives and user scale—3.5 billion daily active users—could serve as upside catalysts.
**Trading Recommendation:**
Here’s my take: with strong underlying fundamentals, visible accumulation at current levels, and bullish sentiment on X, I’m going LONG Meta this week. I’d enter here with partial allocation, aiming for $605 first and $625 as a secondary target, keeping stops tight at $580 and $570 to protect against a breakdown. Position sizing should account for potential continued volatility in tech stocks, but given the widespread trader consensus on undervaluation and the clear support zone, the risk-reward here looks favorable for a short-term bounce.

Meta Platforms (META) – Strong Reaction at Key Demand ZoneMETA has retraced sharply and is now testing a major demand zone around 600 – 585, aligned with the 0.236 Fibonacci level (597). This area represents the first strong support after the recent corrective wave.
The latest candles show early signs of buyer interest, suggesting that the market may attempt a rebound if this zone continues to hold.
If META confirms support here, the next upside levels are:
637 (0.333 Fib)
665 (0.4 Fib)
707 (0.5 Fib)
749 – 755 (0.618 Fib)
811 (0.75 Fib)
A daily close below 585 would signal further weakness and expose the next downside level near 561 (0.15 Fib).
As long as the demand zone holds, the bullish recovery scenario remains valid, with the long-term target set at 916.23.

Too Late to Buy Meta stock?META just reached the monthly demand imbalance at $592 and is reacting as expected using pure supply and demand price action. In this video, I show how META’s big drop was predictable from the monthly and weekly imbalances, and how the current reaction was part of the plan all along. Expecting a decent rally.

Midterm Stock Forecast for METANASDAQ:META At $594, Meta enters a buy zone after the sharp decline since late October. H1 technicals show stabilizing momentum. First target stands at $660, and extension toward $760 remains possible if ad revenue and AI-driven engagement trends stay strong. Valuation still supports midterm upside after the recent correction.

META'S REVENGE TO SHORT SELLERSI see A Short term Break OF UPside RALLY Here AT the 200 DMA ON META.
This is how i see it playing out for the rest of the year and early next year
SHORT SELLERS WILL GET SQUEEZED EARNINGS SEASON COMES AROUND EARLY 2026.

META: Daily Oversold, Weekly Vulnerable — Key Levels to WatchBull Case:
META is testing a long-term ascending trendline and a major demand zone between $579–$595. Daily RSI is oversold, suggesting a potential short-term reversal. If buyers defend this level, key upside pivots sit at $635, followed by $676–684, and a full mean-reversion target near $691. The broader uptrend remains intact as long as the stock holds above $562.
Bear Case:
While the daily chart is positioned for a bounce, the weekly structure is still weakening. META has lost multiple EMAs on the weekly timeframe, momentum remains bearish, and weekly RSI has broken its bull range. A breakdown below $579 opens downside continuation toward $562 and $548, with deeper support near the mid-$400s if selling pressure accelerates.
Summary:
The daily chart shows potential for a near-term rebound, but the weekly trend still favors caution. A sustained close back above $635 strengthens the bullish scenario, while a failure to hold $579 shifts control firmly to the bears.
Key Levels to Watch
Bullish Levels
$595 / $579 — must hold (trendline + demand)
$635 — first resistance / short-term trend flip
$676–$684 — major supply zone
$691 — full mean-reversion target
Bearish Levels
$579 — breakdown trigger
$562 — next liquidity zone
$548 — deeper support
$480s — weekly structural support if selling accelerates
How the Stock Is Leaning:-
Short-term (daily): Leaning bullish for a bounce — oversold, testing major support.
Medium-term (weekly): Leaning bearish — trend damaged, EMAs rolling over, RSI in a downtrend.
Overall: Two-timeframe divergence. Daily wants a reversal, weekly still argues for lower levels unless $635 is reclaimed.
