LTC - Long pendingA pattern from July- Nov 2020 might be repeating in real time.
Will need to wait for 3 to 5 weeks before execution.
Update when needed.
LTCMZL_509F03.USD trade ideas

Litecoin Long-Term Outlook – Sep 2025Litecoin (LTC) is trading around $114, consolidating at the lower range of its historic logarithmic channel. The black line (Bitcoin historic trend) shows how closely Litecoin has followed Bitcoin’s macro cycles, with a lag but strong upside moves once momentum shifts.
2013 bull: LTC went from ~$1 → ~$50 (50x, actually outperforming BTC).
2017 bull: ~$3 → ~$370 (123x, in line with BTC).
2021 bull: ~$22 → ~$412 (19x, slightly weaker than BTC).
Cycle view: Litecoin typically lags BTC but then accelerates late in the cycle. A breakout above $420 would confirm trend continuation.
If history repeats:
Conservative projection point to (like 2021, 19x): $950-1100.
Moderate (like 2013, 50x): $2,500.
Aggressive (like 2017, 123x): $5,000-6,100.
Current consolidation appears to be accumulation before a potential cycle expansion. If Litecoin follows its historic lagging-but-similar pattern to Bitcoin, the new cycle could target $950–$1,100 as baseline, with $2,5K–$6K possible in a strong blow-off phase.

LTCUSD H4 | Bearish drop aheadLTC/USD is rising towards the sell entry, which is an overlap resistanc,e and could drop from this level to the downside.
Sell entry is at 113.38, which is an overlap resistance.
Stop loss is at 118.49, which acts as a pullback resistance.
Take profit is at 107.19, whichis a multi swing low support.
High Risk Investment Warning
Trading Forex/CFDs on margin carries a high level of risk and may not be suitable for all investors. Leverage can work against you.
Stratos Markets Limited (tradu.com ):
CFDs are complex instruments and come with a high risk of losing money rapidly due to leverage. 65% of retail investor accounts lose money when trading CFDs with this provider. You should consider whether you understand how CFDs work and whether you can afford to take the high risk of losing your money.
Stratos Europe Ltd (tradu.com ):
CFDs are complex instruments and come with a high risk of losing money rapidly due to leverage. 66% of retail investor accounts lose money when trading CFDs with this provider. You should consider whether you understand how CFDs work and whether you can afford to take the high risk of losing your money.
Stratos Global LLC (tradu.com ):
Losses can exceed deposits.
Please be advised that the information presented on TradingView is provided to Tradu (‘Company’, ‘we’) by a third-party provider (‘TFA Global Pte Ltd’). Please be reminded that you are solely responsible for the trading decisions on your account. There is a very high degree of risk involved in trading. Any information and/or content is intended entirely for research, educational and informational purposes only and does not constitute investment or consultation advice or investment strategy. The information is not tailored to the investment needs of any specific person and therefore does not involve a consideration of any of the investment objectives, financial situation or needs of any viewer that may receive it. Kindly also note that past performance is not a reliable indicator of future results. Actual results may differ materially from those anticipated in forward-looking or past performance statements. We assume no liability as to the accuracy or completeness of any of the information and/or content provided herein and the Company cannot be held responsible for any omission, mistake nor for any loss or damage including without limitation to any loss of profit which may arise from reliance on any information supplied by TFA Global Pte Ltd.
The speaker(s) is neither an employee, agent nor representative of Tradu and is therefore acting independently. The opinions given are their own, constitute general market commentary, and do not constitute the opinion or advice of Tradu or any form of personal or investment advice. Tradu neither endorses nor guarantees offerings of third-party speakers, nor is Tradu responsible for the content, veracity or opinions of third-party speakers, presenters or participants.

LTCUSD--LONG--monthly bullish
--weekly bullish
--daily bullish
--tp and entry levels are as shown on chart

LTCUSD 2D chartSleeping LTC working on the breakout. As btc.d is marking a higher low, we have no doubt ltc will make it back into the top 10 of the crypto market by market cap. solid fundamentals support this idea.

LTCUSD Bullish MoveLTC is about to go up, it's currently building up to push the market to the uptrend.

LTC to new highsMy favorite coin I've been investing in lately for what I believe to be one of the lowest risk assets in crypto with some of the highest potential asymmetrical returns. My non-financial advise is to buy now and hold until we break into new all time highs and beyond. Easy 6-10x returns.


Litecoin is showing signs of technical strength and momentumLitecoin is one of the most widely supported coins on exchanges, wallets, ATMs. Used as a liquid bridge asset (cheap, fast transfers).
MimbleWimble Extension Blocks (MWEB) added optional privacy (2022).
It’s a store-and-transfer coin rather than a platform for innovation. It is a 14-years old, and one of the most battle-tested blockchains.
LTC is likely to regain top-5 status and could continue as a legacy payments coin with bursts of cyclical outperformance.

LTCUSDLTCUSDT – 4H Range Breakout with Divergence Setup
Price was consolidating in a tight 4H range.
A clean breakout candle has closed outside the range, confirming momentum.

Litecoin Stabilizes After Liquidity SweepFenzoFx—Litecoin trades sideways, up nearly 1.0% today, currently around $113.80. The recent momentum may stem from the liquidity sweep below $106.80 on September 1st. However, RSI hovers above 70.0, indicating overbought conditions.
Immediate resistance stands at $116.30. Technically, Litecoin hasn’t cleared significant buy-side liquidity, so we remain neutral until price reaches this level. The resistance appears to be the next target following the sell-side liquidity sweep.

LTCUSD Short
MARKET ENTRY 114.99
SL 116.56
TP 113.42
The asset is currently overvalued versus the dollar, gold and bond. I expect a short-term drop-in price soon.

LTC/USD – Rebounding off SMA200🟢 LONG above $113.20 – target $115.40
Litecoin trades at $113.62, sitting right above SMA200 ($113.23). Resistance: $115.40, support: $112.07. RSI recovering at 56, showing buyers are regaining control. Holding SMA200 support keeps the bias bullish.
📊 Keywords: #LTCUSD #Litecoin #CryptoLong #ReboundSetup #BullishBias

LTCUSD H1 | Bearish Reversal off major resistanceBased on the H1 chart analysis, we can see that the price has rejected the sell entry which is a pullback resistance and could potentially drop from this level to the take profit.
Sell entry is at 115.05, which is a pullback resistance.
Stop loss is at 118.19, which is a pullback resistance.
Take profit is at 111.70, which is a pullback support.
High Risk Investment Warning
Trading Forex/CFDs on margin carries a high level of risk and may not be suitable for all investors. Leverage can work against you.
Stratos Markets Limited (tradu.com ):
CFDs are complex instruments and come with a high risk of losing money rapidly due to leverage. 65% of retail investor accounts lose money when trading CFDs with this provider. You should consider whether you understand how CFDs work and whether you can afford to take the high risk of losing your money.
Stratos Europe Ltd (tradu.com ):
CFDs are complex instruments and come with a high risk of losing money rapidly due to leverage. 66% of retail investor accounts lose money when trading CFDs with this provider. You should consider whether you understand how CFDs work and whether you can afford to take the high risk of losing your money.
Stratos Global LLC (tradu.com ):
Losses can exceed deposits.
Please be advised that the information presented on TradingView is provided to Tradu (‘Company’, ‘we’) by a third-party provider (‘TFA Global Pte Ltd’). Please be reminded that you are solely responsible for the trading decisions on your account. There is a very high degree of risk involved in trading. Any information and/or content is intended entirely for research, educational and informational purposes only and does not constitute investment or consultation advice or investment strategy. The information is not tailored to the investment needs of any specific person and therefore does not involve a consideration of any of the investment objectives, financial situation or needs of any viewer that may receive it. Kindly also note that past performance is not a reliable indicator of future results. Actual results may differ materially from those anticipated in forward-looking or past performance statements. We assume no liability as to the accuracy or completeness of any of the information and/or content provided herein and the Company cannot be held responsible for any omission, mistake nor for any loss or damage including without limitation to any loss of profit which may arise from reliance on any information supplied by TFA Global Pte Ltd.
The speaker(s) is neither an employee, agent nor representative of Tradu and is therefore acting independently. The opinions given are their own, constitute general market commentary, and do not constitute the opinion or advice of Tradu or any form of personal or investment advice. Tradu neither endorses nor guarantees offerings of third-party speakers, nor is Tradu responsible for the content, veracity or opinions of third-party speakers, presenters or participants.

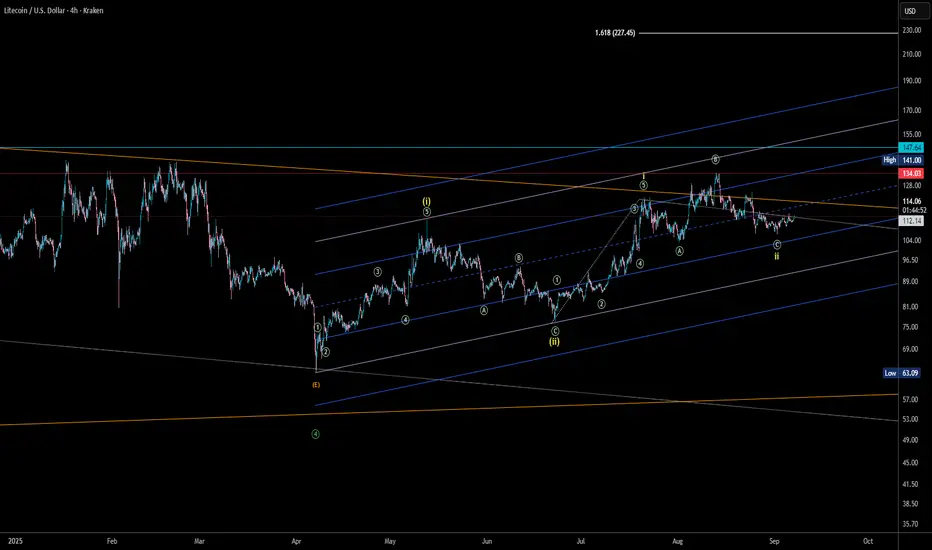
LTC 4H, 1-2 nestedLTC/USD pair seems to getting out of a running flat correction (the last ABC in light green), building a 1-2, 1-2 (nested 1-2). This structure shall give us some ripping candles to the upside very soon. The confirmation of the inner 1-2 is at the 1.6 = 227USD, if we don't build another 5 waves, 3 corrective to keep nesting.
Overall, if we pump, its a very bullish base to pump, if we make a 5 wave corrective and retrace, its just more bullish.
Historical tops where in November, just one time in May. Keep the eyes white open.
Okay, here is a brief analysis of Litecoin (LTCUSD). **FundamenOkay, here is a brief analysis of Litecoin (LTCUSD).
**Fundamental Analysis:**
Litecoin (LTC), as one of the early cryptocurrencies, positions itself as the "lighter version" of Bitcoin or "digital silver," focusing on faster transaction speeds and lower fees. Its value is primarily driven by market liquidity, overall cryptocurrency market trends, and its inherent scarcity (total supply of 84 million coins). Key highlights are mostly related to its payment attributes, such as the MWEB privacy upgrade which enhanced transaction functionality. However, it faces significant challenges: it lacks unique ecosystem applications, has weak smart contract capabilities, is becoming marginalized in the DeFi and NFT waves, and faces immense competitive pressure.
**Technical Analysis:**
LTC's price movement is highly correlated with Bitcoin's but typically exhibits lower volatility than many small-cap altcoins. It shows clear cyclical characteristics, with market attention significantly increasing around its "halving" events (next expected in 2027). Key technical levels to watch involve its ability to hold important psychological barriers (e.g., $100) and historical support/resistance levels. Changes in trading volume are crucial for gauging short-term momentum.
**Summary and Outlook:**
Litecoin's core advantages lie in its simplicity, stability, and time-tested network, but it carries a weak narrative in today's crypto market that emphasizes ecological innovation. Its future performance heavily depends on broader cryptocurrency bull markets and its adoption progress as a payment medium. Investors should be aware of the risk of stagnant ecosystem development.
***
*Disclaimer: The above content is market analysis and does not constitute investment advice. Cryptocurrency investments are extremely high risk; please make decisions cautiously.*

Litecoin (LTCUSDT) 4H – Ready for a Bounce?Litecoin has been respecting the green demand zone around $106–$108 for weeks.
Now price is approaching this zone again, and we could see a bullish reaction toward the descending trendline resistance.
🟢 Support/Demand Zone: $106 – $108
⚫ Trendline Resistance: $125 – $131
📈 Bias: Bullish bounce possible if support holds.
---
💭 What do you think, traders?
Will LTC bounce from demand and push higher? 🔥
Or will bears break the zone this time? 📉
Drop your thoughts below 👇 and don’t forget to like ❤️

LTCUSD H4 | Bearish Reversal at pullback resistanceLTC/USD is rising towards the sell entry which acts as a pullback resistance and could reverse from this level to the downside.
Sell entry is at 115.18, which is a pullback resistance.
Stop loss is at 123.05, which is a swing high resistance.
Take profit is at 103.51, which is a swing low support that aligns with the 78.6% Fibonacci projection.
High Risk Investment Warning
Trading Forex/CFDs on margin carries a high level of risk and may not be suitable for all investors. Leverage can work against you.
Stratos Markets Limited (tradu.com ):
CFDs are complex instruments and come with a high risk of losing money rapidly due to leverage. 65% of retail investor accounts lose money when trading CFDs with this provider. You should consider whether you understand how CFDs work and whether you can afford to take the high risk of losing your money.
Stratos Europe Ltd (tradu.com ):
CFDs are complex instruments and come with a high risk of losing money rapidly due to leverage. 66% of retail investor accounts lose money when trading CFDs with this provider. You should consider whether you understand how CFDs work and whether you can afford to take the high risk of losing your money.
Stratos Global LLC (tradu.com ):
Losses can exceed deposits.
Please be advised that the information presented on TradingView is provided to Tradu (‘Company’, ‘we’) by a third-party provider (‘TFA Global Pte Ltd’). Please be reminded that you are solely responsible for the trading decisions on your account. There is a very high degree of risk involved in trading. Any information and/or content is intended entirely for research, educational and informational purposes only and does not constitute investment or consultation advice or investment strategy. The information is not tailored to the investment needs of any specific person and therefore does not involve a consideration of any of the investment objectives, financial situation or needs of any viewer that may receive it. Kindly also note that past performance is not a reliable indicator of future results. Actual results may differ materially from those anticipated in forward-looking or past performance statements. We assume no liability as to the accuracy or completeness of any of the information and/or content provided herein and the Company cannot be held responsible for any omission, mistake nor for any loss or damage including without limitation to any loss of profit which may arise from reliance on any information supplied by TFA Global Pte Ltd.
The speaker(s) is neither an employee, agent nor representative of Tradu and is therefore acting independently. The opinions given are their own, constitute general market commentary, and do not constitute the opinion or advice of Tradu or any form of personal or investment advice. Tradu neither endorses nor guarantees offerings of third-party speakers, nor is Tradu responsible for the content, veracity or opinions of third-party speakers, presenters or participants.

Litecoin Stock Chart Fibonacci Analysis 090325Trading Idea
1) Find a FIBO slingshot
2) Check FIBO 61.80% level
3) Entry Point > 113/61.80%
Chart time frame:B
A) 15 min(1W-3M)
B) 1 hr(3M-6M)
C) 4 hr(6M-1year)
D) 1 day(1-3years)
Stock progress:A
A) Keep rising over 61.80% resistance
B) 61.80% resistance
C) 61.80% support
D) Hit the bottom
E) Hit the top
Stocks rise as they rise from support and fall from resistance. Our goal is to find a low support point and enter. It can be referred to as buying at the pullback point. The pullback point can be found with a Fibonacci extension of 61.80%. This is a step to find an entry-level position. 1) Find a triangle (Fibonacci Speed Fan Line) that connects the high (resistance) and low (support) points of the stock in progress, where it is continuously expressed as a Slingshot, 2) and create a Fibonacci extension level for the first rising wave from the start point of the slingshot pattern.
When the current price goes over the 61.80% level, that can be a good entry point, especially if the SMA 100 and 200 curves are gathered together at 61.80%, it is a very good entry point.
As a great help, TradingView provides these Fibonacci speed fan lines and extension levels with ease. So if you use the Fibonacci fan line, the extension level, and the SMA 100/200 curve well, you can find an entry point for the stock market. At least you have to enter at this low point to avoid trading failure, and if you are skilled at entering this low point, with the fibonacci6180 technique, your reading skill of to chart will be greatly improved.
If you want to do day trading, please set the time frame to 5 minutes or 15 minutes, and you will see many of the low points of rising stocks.
If you prefer long-term range trading, you can set the time frame to 1 hr or 1 day

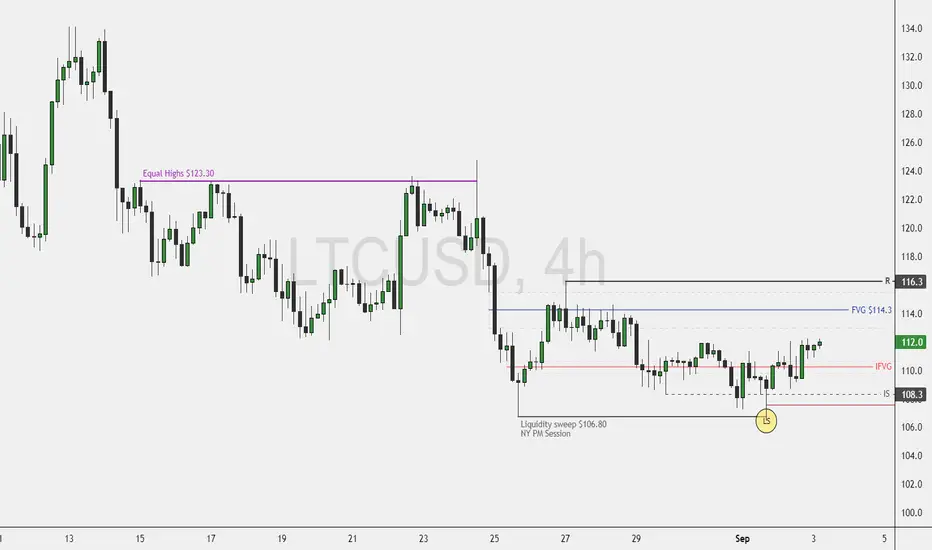
Litecoin Eyes Higher ResistanceFenzoFx—Litecoin’s bearish momentum eased after sweeping the $106.80 low in New York’s late PM session. The price is now stabilizing above the inverted fair value gap at $111.90.
While BCH and XRP surged yesterday, Litecoin lagged. However, equal highs at $114.30 and $123.30 suggest potential upside. LTC/USD could reach $116.30, and if buying pressure continues, a rally toward $123.30 is likely.
Note: The bullish outlook is invalidated if the price dips below $106.80.
LTC in a bullflag LTC is creating a bull flag to finally get to the breakout. This move shall bring LTC to the resistance and allow its price to break it with lower volatility. A breakout with low volatility is the best thing that can happen so that PA can accelerate once the resistance is broken and we get the volume. IMO, over the weekend we will see important PA to the upside.

LTCUSD Will it resume the uptrend and hit $165?Litecoin (LTCUSD) has been trading within a Channel Up pattern since the April 07 Low and in the past two weeks has found itself declining, being on the new Bearish Leg of the pattern.
This decline has hit already the 1D MA50 (blue trend-line), where despite the break-out, the price is consolidating around it. Based on the previous Bearish Leg, which reached the 0.618 Fibonacci retracement level before making a Higher Low and rebound into the new Bullish Leg, LTC can reach 95.00 before initiated the next rally.
However, the 1D RSI just hit its 5-month Higher Lows trend-line, which indicates that the price might reverse now instead of lower. A sound strategy to account for both possibilities would be to split your normal position size into half and enter both now and if the RSI Higher Lows break, use the rest for one final buy lower.
In any case, our long-term Target is the -0.382 Fibonacci extension (like the previous Bullish Leg) at $165.00.
-------------------------------------------------------------------------------
** Please LIKE 👍, FOLLOW ✅, SHARE 🙌 and COMMENT ✍ if you enjoy this idea! Also share your ideas and charts in the comments section below! This is best way to keep it relevant, support us, keep the content here free and allow the idea to reach as many people as possible. **
-------------------------------------------------------------------------------
💸💸💸💸💸💸
👇 👇 👇 👇 👇 👇
