Evening market reviewHello traders,
It's been a while since I saw a high-probable set-up shaping up on a top 10 crypto-pair.
Positioned extremely well.
Also a neutral perspective on USD-pairs.
CRYPTO:LTCUSD
FX:USDCHF
Trade ideas

Litecoin (LTC): Expecting a Good Buy Opportunity Soon | Bullish LTC looks like it's about to break that neckline area so we are waiting for it to happen—as soon as it happens, we are going to get an opportunity for a long!
More in-depth info is in the video—enjoy!
Swallow Academy

LTC 4H Analysis - Key Triggers Ahead☃️ Welcome to the cryptos winter , I hope you’ve started your day well.
⏰ We’re analyzing LTC on the 4-Hour timeframe .
👀 After the sharp and deep drop that Litecoin experienced in 3 candles, it moved toward its key support in the $102 area and was well supported from this zone. Then it formed a higher low and higher high compared to its previous low and high, and it is now moving to break its resistance in the $107 area. With a 4-hour confirmation on this zone (the taker-seller and key resistance), it can move upward.
🧮 Two key zones are considered for the RSI oscillator: the 63 level, which is close to the 70 zone—if the volatility crosses this level, Litecoin can move toward overbought. The second zone is the entry threshold into oversold.
🕯 The size and volume of the candles in the recent drop, which can be considered a price correction, are really significant and large. Scattered sell orders are placed above the area we marked, which causes our green candles below this zone to appear a bit smaller. To break the specified taker-seller area, we need a large candle with relatively high volume that fully confirms (stabilizes) on this zone to shape our bullish and high-momentum trend.
💸 BINANCE:LTCBTC is bearish against the Bitcoin pair and has not turned bullish yet, but it is positioned a bit above its support floor. With a breakout of the taker-seller zone in the USDT pair, the Litecoin/Bitcoin pair might also turn bullish, which would increase the movement momentum and the size of the candles.
🧠 For a Litecoin long position, we have to wait until we confirm above this taker-seller area with a strong whale candle and then examine the available scenarios for the breakout.
↗️ Long position scenario: breaking the taker-seller area and key resistance at $107 along with whale candles, and then observing a multi–time frame indecision candle, which will also give us a smaller stop size.
📉 Short position scenario: if the market wants to give a heavy and strong correction, the $102 area can be a good zone for a floor break and a short position on this coin—but the important point for us is that Litecoin is about to start a good bullish trend.
❤️ Disclaimer : This analysis is purely based on my personal opinion and I only trade if the stated triggers are activated .

LTC/USDT 1h short term 1. The inheritance channel (orange lines) - the course was in the downward trend, but just struck the mountain from the channel. This is a signal of short -term shift Momentum to upward.
2. Horizers of support/resistance (red and green lines):
• Support: 104.64, 103.15, 101.77 - you can see that the course reflected several times from these levels.
• Resistance: 106.05, 107.85, 109.32 - these levels are now key goals with further increases.
3. STOCHASTIC RSI (bottom of the chart) - is in the purchase zone (above 80). This suggests the possibility of short -term correction, but after struggling from the channel, the momentum can still pull the price higher before the stronger pullback occurs.
⸻
Scenarios:
✅ Taurus (continuation of stroke):
• If the price lasts above 106 USDT, subsequent goals are 107.85 and 109.32.
• Closing a few candles above 106.05 will confirm the burst and gives space for growth.
⚠️ Bear (false breakup):
• If the price does not last above 106 and returns to 104.64, the market may fall again to 103.15 and even 101.77.
⸻
Summary:
• The trend has changed to a short -term upward after having broken out of the downward channel.
• Keeping the level of 106 USDT is key - if it succeeds, there is a chance for an attack 107.85 → 109.32.
• RSI is high, so in a short time it is possible to lightly withdraw before we go higher.

Litecoin (LTC): Really Good Buying Opportunity For July 2025 Litecoin has a really good chance to explode anytime now. We noticed a decent uptrend forming so what we are looking for is a break of that trend and full-scale upward movement!
More in-depth info is in the video—enjoy!
Swallow Academy

LTC/USDT 15 minuteClean BOS followed by heavy displacement down — textbook bearish order flow.
Market’s retracing into stacked FVGs, basically a liquidity magnet.
Sell order sits in a solid zone where inefficient price meets bearish order flow.
The risk: current consolidation could sweep higher into the upper imbalance before rejecting. Consider both the mid-FVG and the extreme FVG above as potential short triggers.
Target the lows, but keep in mind if volume dries up here, it could get chopped.
All the best.

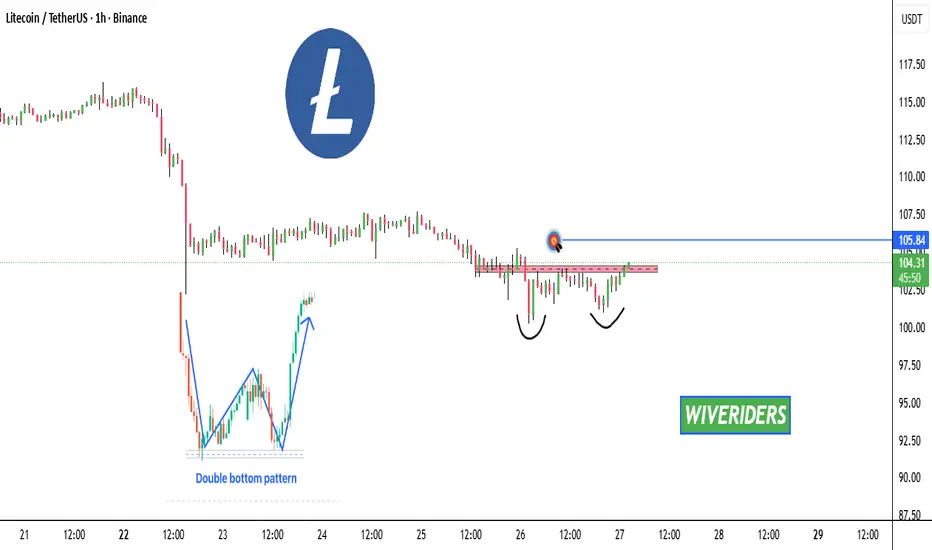
LTC is forming a bullish Double Bottom pattern📊 CRYPTOCAP:LTC Market Update
CRYPTOCAP:LTC is forming a bullish Double Bottom pattern ✅
It’s now testing the red resistance zone 🔴 — if it breaks out with confirmation, the first target will be the blue line level 🎯
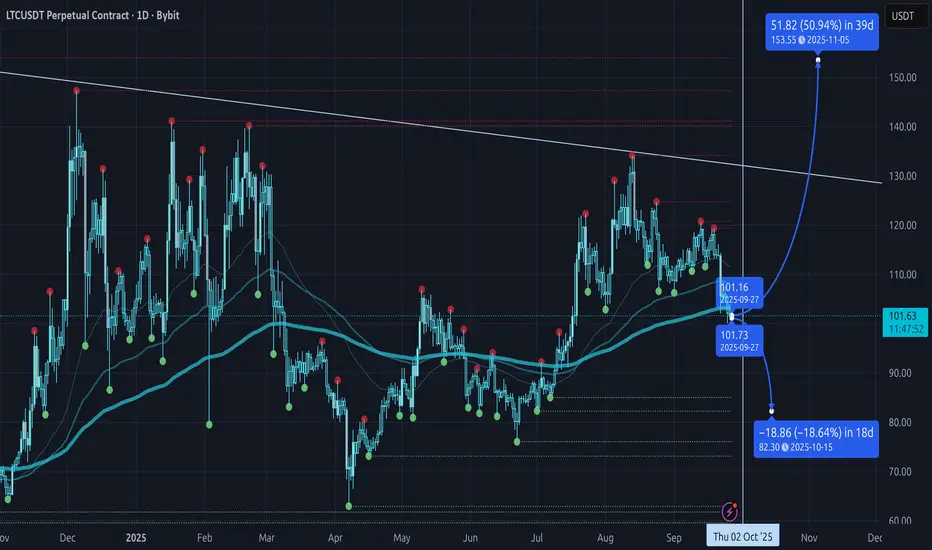
Litecoin: 200 EMA or Bust — Mean-Reversion vs. ETF HypeLitecoin did what Litecoin always does: ripped on big headlines, went sideways, and then gave most of it back. Around the election/ETF chatter we saw that spike, then the whole move basically round-tripped. CRYPTOCAP:LTC BINANCE:LTCUSDT is a mean-reverting machine—great for quick trades, a pain in the ass to hold when the music stops.
Zooming in to now: since the April lows we built up, corrected, built up again into the Aug 13th ~$130 high, and we’re back in correction mode. On the daily, price is sitting on the 200 EMA (right around the psychological $100 area). That’s my line in the sand. Lose the 200 EMA and the $100/$95 shelf, and I think we’re staring at the classic LTC full round-trip into $80 → $70–$65. That would basically unwind the whole April→August leg—again.
On the chart you can also see the macro descending trendline capping every pop (look how those red swing-high dots keep failing under it). Structure still hasn’t reclaimed the December 2024 highs, so bigger picture it’s still a downtrend until proven otherwise. For context, Litecoin has been compressing in a wide $65–$140 range for almost four years. Everyone wants the breakout to $200–$500…but the chart hasn’t confirmed a thing.
Now, we’ve got the Oct 2, 2025 ETF deadline hanging over this. Two ways this can play out:
Bear case (my concern right now): institutions bought April/June, sold the August euphoria to retailers, and are slowly unloading into every bounce while the narrative machine runs hot. That would explain why price can’t hold above the 200 EMA even with “bullish” headlines everywhere. If we lose $100/$95 with acceptance, I’m looking for that mean-reversion magnet at $70–$65 after a stop at $80.
Bull case (needs confirmation): we hold the 200 EMA, ETF news hits positive, and price squeezes back through $120 and on toward $140–$150. That would be the first clean step toward breaking the four-year range, but it still has to beat the trendline overhead. Until then, it’s just another rally into resistance.
Sentiment is noisy: Charlie Lee back on pods, the official accounts pushing hard, maxis loud on X—yet price isn’t following. When expectations are this high and the chart lags, it often means someone smarter is selling into it. Maybe I’m wrong and ETF demand lights the fuse—great, I’ll cheer it on—but next week feels like last resort. If LTC can’t bounce from the 200 EMA into the deadline, and instead rolls under $95, it likely does what it loves most: round-trip the pump.
Bottom line: 200 EMA = line in the sand. Hold it and maybe we squeeze toward $140–$150. Lose it, and the path of least resistance is $80 → $70–$65. The chart, not the headlines, will tell us which one it is.
How to Avoid Massive Losses in Crypto ChaosThe crypto market is full of volatility and excitement these days.
How ready are you to make the right decisions amid this chaos?
Many traders enter without a plan and experience huge losses, but you can be different.
Hello✌️
Spend 2 minutes ⏰ reading this educational material.
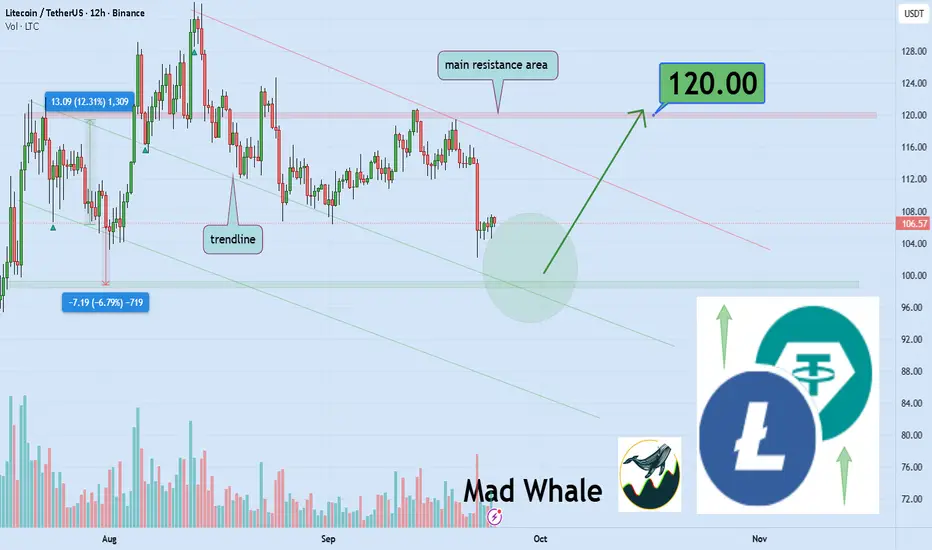
🎯 Analytical Insight on Litecoin:
Litecoin is testing a critical trendline and support zone 📉.
If it holds, a 12% rally could push price toward 120 USD 🚀.
Now , let's dive into the educational section,
Understanding Market Psychology and Trader Emotions 🧠
When the market is chaotic, fear and greed heavily influence your decisions.
Many traders panic sell during sharp drops and suffer major losses.
On the other hand, FOMO can push you to buy at the top and regret it after corrections.
Focusing on collective market behavior and identifying dominant emotions can help you avoid these mistakes.
Strategies to Prevent Big Losses 🚨
Always define your maximum acceptable loss.
Avoid heavy positions and high leverage.
Diversify your portfolio to reduce risk.
Use a combination of technical and on-chain analysis for smart decisions.
Watch whale movements; their large trades can shake the market.
Managing Emotions and Staying Focused ⚖️
Take deep breaths and avoid impulsive decisions.
Have a daily plan to check the market and resist FOMO.
Keep a trading journal to analyze and improve your behavior.
Practical Strategy During High Volatility 🔄
Volatile markets trigger impulsive decisions.
Always identify support and resistance levels.
In extreme swings, trade smaller and safer positions.
Avoid high leverage to prevent large losses in sudden moves.
Focus on the overall trend, not short-term price noise, to protect your capital.
Key TradingView Tools 🛠️
Stop Loss and Take Profit
Limit losses and lock in profits
Set entry and exit points before trading
RSI and MACD
Detect overbought or oversold conditions
Identify short-term trends
Volume Profile
See trading volume at different price levels
Spot real support and resistance zones
Alerts and Notifications
Set alerts on key levels
Stay ahead of sudden market movements
Short Summary 📌
By managing risk, using TradingView tools, and controlling emotions, you can limit big losses and identify safer opportunities.
3 Top Recommendations for Traders 💡
Always have a plan before entering any trade and set your maximum loss.
Avoid following crowd emotions and make decisions logically.
Use analysis tools in combination and practice to minimize risk effectively.
✨ Need a little love!
We pour love into every post your support keeps us inspired! 💛 Don’t be shy, we’d love to hear from you on comments. Big thanks , Mad Whale 🐋
📜Please make sure to do your own research before investing, and review the disclaimer provided at the end of each post
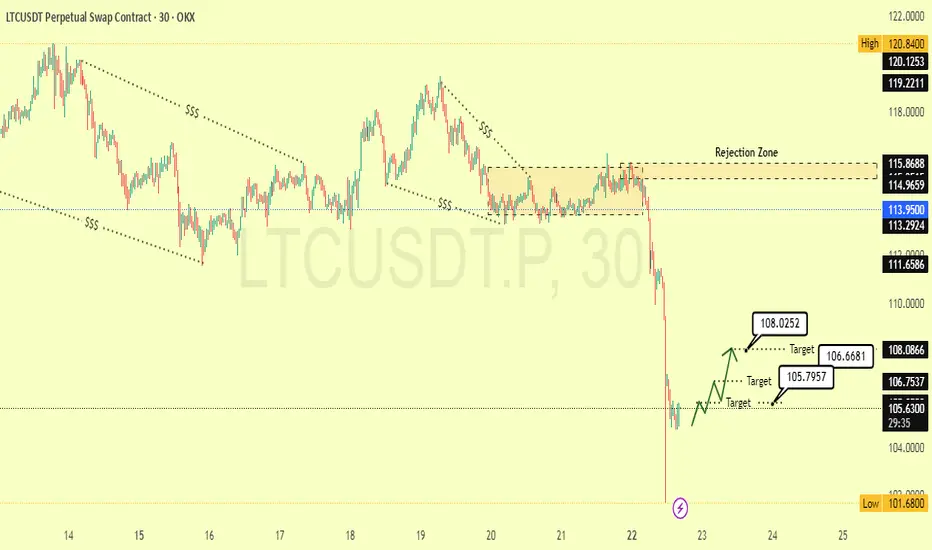
LTCUSDT – Quick Breakdown Loading .....Huge dump after price hit the Rejection Zone (114.9–115.8). This key area acted as strong resistance — sellers took control fast.
Reason for drop:
Price faced strong sell pressure at the top, leading to a sharp move down. Weak hands flushed, high volume sell-off.
Current price: Around $105.25
Bounce expected with short targets:
Target 1: 105.79
Target 2: 106.66
Target 3. 108.02
Watching for bullish reaction here before any recovery. Break below \$104 again could lead to $101.68 (major support).
Litecoin (LTC): Might Be Good Momentum For Buy LTC saw a sharp dump that created a huge gap above for buyers to fill. The move was stopped right at the 200EMA, showing strong buyer defense. With the bearish CME already filled on the downside, momentum now depends on how well buyers hold this 200EMA — if secured, that upside gap is the next target.
Swallow Academy

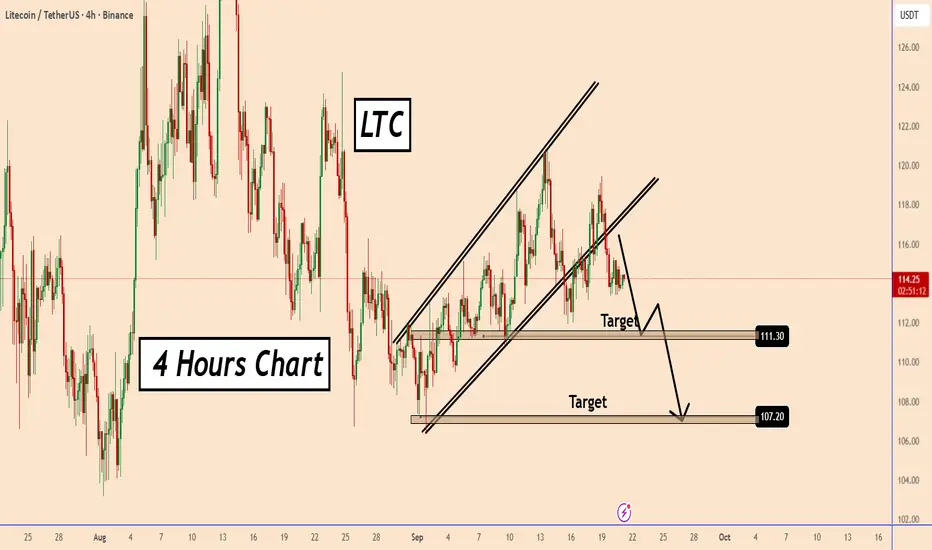
LTC : Bearish Setup-4H Chart AnalysisLTC : Bearish Setup-4H Chart Analysis
Litecoin has broken down from the rising channel, showing weakness. The price is currently around 114.20 USDT and looks set for a correction.
First support/target is near 111.30 USDT, where price may pause.
If this level breaks, the next target is around 107.20 USDT.
The overall momentum is bearish in the short term unless the price moves back above 116 USDT to regain strength.
You may find more details in the chart!
Thank you and Good Luck!
❤️PS: Please support with a like or comment if you find this analysis useful for your trading day❤️
LTC/USDT | Litecoin Consolidating – Can Bulls Smash $150 RSTNCE!By analyzing the Litecoin (LTC) chart on the weekly (logarithmic) timeframe, we can see that after our last analysis, the price successfully reached the targets at $92.5 and $115. Currently, it is trading around $115.
The price now faces a strong resistance zone between $120–$150. Litecoin is consolidating and building enough momentum to attempt a strong breakout of this zone. If it manages to break through, the next bullish targets will be $155, $200, and $268.
Please support me with your likes and comments to motivate me to share more analysis with you and share your opinion about the possible trend of this chart with me !
Best Regards , Arman Shaban

LTC/USDT – Bullish Trendline Support Points Toward $140LTC is currently trading around $113–114 and continues to respect the long-term ascending trendline support. Price action has consistently bounced from this level, forming higher lows and maintaining bullish momentum.
The chart shows two potential scenarios:
Bullish Case (Main Scenario)
If the trendline holds, LTC could rally toward $120, with a breakout targeting $130–140 in the mid-term. This move aligns with the overall ascending channel structure and market sentiment.
Bearish Case (Alternative Scenario)
A breakdown below the $110–105 support box could open the way toward $100–95 before buyers attempt to step back in.
Key Levels to Watch
📈 Resistance: $120, $130, $140
📉 Support: $110, $105, $100
⚠️ Stop Loss Zone: Below $105
Overall, as long as LTC holds above $110, the bias remains bullish with a possible push to $140 in the coming weeks.

Monthly Crypto Analysis: Litecoin (LTCUSD) – Issue 91 The analyst believes that the price of Litecoin will decrease within the time specified on the countdown timer. This prediction is based on a quantitative analysis of the price trend.
___Please note that the specified take-profit level does not imply a prediction that the price will reach that point. In this framework of analysis and trading, unlike the stop-loss, which is mandatory, setting a take-profit level is optional. Whether the price reaches the take-profit level or not is of no significance, as the results are calculated based on the start and end times. The take-profit level merely indicates the potential maximum price fluctuation within that time frame.

Litecoin long now to $119.2Opened up a long position on litecoin a while ago. Aiming for $119.2 full tp
Partial tp at $118.13
Sl: 115.34 area
Time sensitive
DTT strategy used. Learn more on X

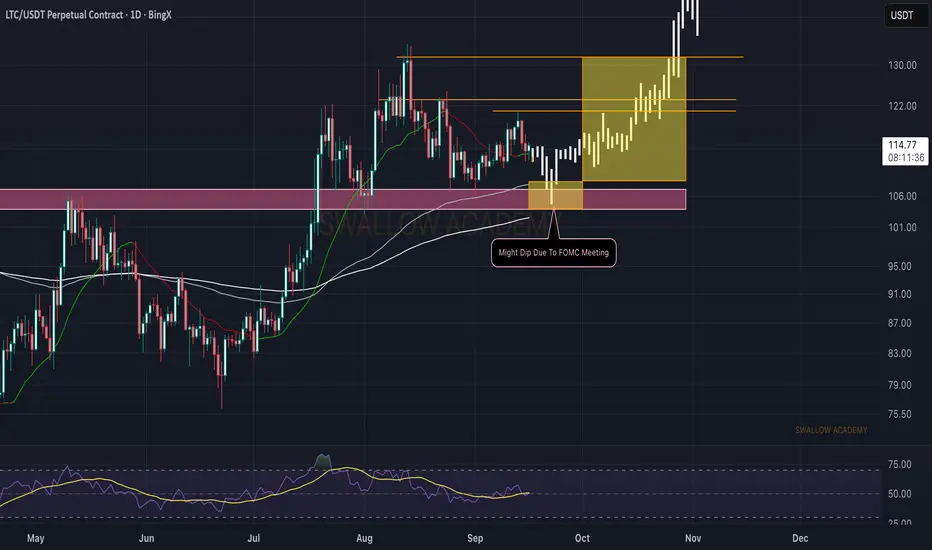
Litecoin (LTC): Expecting Smaller Dip Before Proper BounceExpecting LTC to show some kind of "buy the rumor, sell the news" event very soon (the FOMC meeting).
Lots of volatility can be expected but we are bullish overall!
Swallow Academy
LTCUSDT 1D chart review🔎 key levels
• Resistance resistance:
• 118.92 USDT (local resistance, recently tested several times).
• 126.05 USDT (stronger resistance - if it pierces, the trend is continued).
• Support (Support):
• 113.31 USDT (current level, currently defended).
• 109.28 USDT (SMA as dynamic support).
• 102.38 USDT (key support - if it falls, there may be a stronger decrease).
⸻
📉 Trend
• You can see the yellow inheritance trend line on the chart - the course respected it several times.
• Currently, the price is trying to stay above SMA200 (green line), which is a signal of a potential reflection.
⸻
📊 indicators
• MacD:
• The histogram has gone into a positive zone, which suggests growth moment, but the signal lines are close to each other → possible consolidation.
• RSI:
• Value around 50 → neutral zone, no clear purchase or sale.
• If he pierces 60, he may enter the upward trend.
⸻
📌 Scenarios
1. Bullish
• If it stays above 113.31 and breaks 118.92, the goal will be 126 USDT.
• Confirmation: RSI> 60 and MacD further opening up.
2. Bearish
• If the course drops below 113.31, subsequent support is 109.28 and 102.38.
• Confirmation: Macd Cross down + RSI <45.

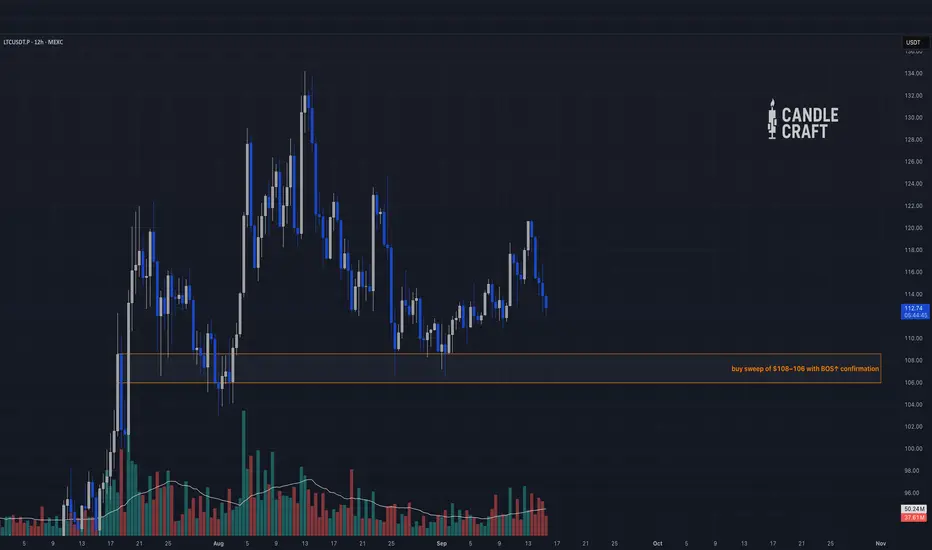
Litecoin — The Old Guard Tests Its RelevanceLitecoin doesn’t scream like new meme coins, but it still moves with power when liquidity lines up. Right now LTC is coiling around $112–115, after a sharp rally and rejection.
What’s interesting? The footprint and derivatives flow. Despite chop on spot, funding is flat, OI steady, and CVD heavy negative — suggesting sellers pressing but not breaking. The market is testing patience before deciding: fresh squeeze higher, or bleed back into old support.
HTF (1W / 2D)
• Price ~$112.7
• Range: $105–125 control band
• Supports: $108 → $96
• Resistance: $124 → $132
MTF/LTF (12H / footprint)
• Absorption prints under $114–112 zone
• Heavy liquidity sits under $108 → likely sweep bait
• Above $124 unlocks clean run into $130+
Derivatives (Velo)
• OI consistent, no major flush
• Funding neutral across majors
• CVD tilted negative → showing sell pressure, but buyers still holding
• Liquidations stacking below $110
Idea Map
• Long idea: buy sweep of $108–106 with BOS↑ confirmation
• Short idea: fade rejection under $124 back to $110
• Invalidations: lose $96 HTF = breakdown, reclaim >$132 = expansion
⚡ Litecoin trades like a veteran — boring until it suddenly isn’t. The trap here will decide the next run.
Candle Craft | Signal. Structure. Execution.
LTCUSDT AnalysisCurrent price around $112–113, consolidating after recent highs near $116–117.
Resistance: $125 zone.
Support: $103-106 immediate
Trend: Neutral to mildly bearish until $117+ breaks.
Short Setup: breakdown under $101 → targets TP-1 $82, TP2 65

LTc Long to $123 BBetter late than never
Sl: 117.49
Tp: 123
At least 1:1 RR
High probability
DTT setup
LEarn more on X

LTC Short to 108$LTC Short to 108$
Enter 120.26
SL 121.36
TP 108.63
LTC possibly does double top and currently in Diamond reversal pattern. 95% on Twitter is bullish. That's all u need to know.
SL would have manually in case of wick wick on 4h above the diamond's top.
Low leverage can enter now

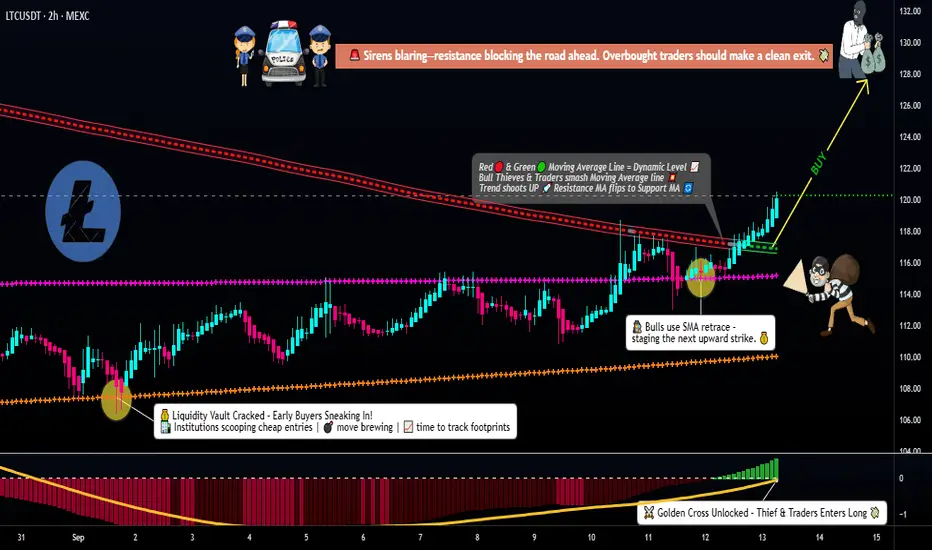
Join LTC/USDT’s Bull Run: MACD Confirms the Move!🚀 LTC/USDT "Litecoin vs Tether" Market Money Looting Plan
📌 Plan
🔹 Buyers enter on Simple Moving Average (SMA) pullback
🔹 Retest push adds momentum for confirmation
🔹 LSMA breakout confirms bullish continuation trend
🔹 MACD golden cross supports bullish strength and entry timing
🎯 Entry Plan
I’m applying a layered limit order strategy (multiple entries) to scale in smoothly instead of going all-in. My layers are:
116.00 💵
117.00 💵
118.00 💵
119.00 💵
120.00 💵
👉 You can always add or adjust based on your own style — layering is flexible.
🛡️ Risk Management
My protective Stop Loss (SL) is placed at 114.00 after breakout confirmation.
⚠️ Important: Risk management is personal. Adjust SL based on your own plan, style & tolerance.
🎯 Target / Exit Strategy
Upside police resistance 🚔 is waiting near 128.00 (strong resistance + overbought zone + possible liquidity trap). The smart play is to escape before getting caught — secure your profits and move! 💨
⚠️ Note: Exit levels are suggestions. You can adapt based on your own strategy.
🔗 Related Pairs to Watch
BINANCE:BTCUSDT → Leader of crypto moves, if Bitcoin pumps, LTC often follows.
BINANCE:ETHUSDT → Strong correlation with LTC, momentum shifts can echo.
BINANCE:BCHUSDT → Competes in similar use case narrative; price moves can align.
BINANCE:DOGEUSDT → Meme momentum sometimes drags mid-cap alts like LTC.
📊 Key Points Recap
✅ SMA Pullback + Retest push = Entry foundation
✅ LSMA breakout = Bullish confirmation
✅ MACD golden cross = Momentum backup
✅ Layered entries (116–120) for scaling in
✅ Exit around 128.00 before “trap zone”
✨ “If you find value in my analysis, a 👍 and 🚀 boost is much appreciated — it helps me share more setups with the community!”
#LTCUSDT #Litecoin #CryptoTrading #SwingTrade #DayTrade #TradingStrategy #TechnicalAnalysis #CryptoCommunity #Altcoins #ChartAnalysis