Indusind Bank 75 Min Analysis , TRIANGLE PATTERN Triangle Pattern Formed .
1) Strong RSI Divergence .
2) Price Reacted From Demand Zone .
3) Entering In Supply Zone .
* Trade Set Up for long . Looking For Bullish Candle Strick Pattern Near Triangle Breakout .(Long Above It )
Preferable Above 428.
* Trade Set Up For Short . Look For Bearish Candle Pattern Near Supply Zone . And Below It Short . With Sl 428 .
Short Trade In this Pattern Not Looking Good Until Last Low Break .
IF SETUP COMPLETE And Market Support Our Direction then Go Long . With Your Bullish Set Up candle Low As A Stop Loss . First Target Will Be 468-475.
IDUSB trade ideas


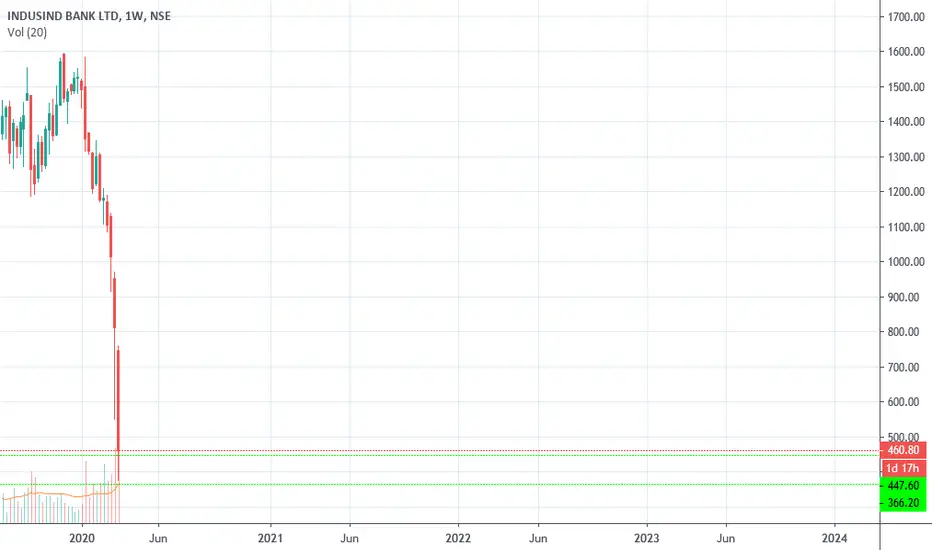
Indusind Bank Near Its Major Support AreaNSE:INDUSINDBK
Indusind Bank today tested its major support area of 447.6-366.25 if its manage to break it down. There is nothing worst to see.
We may see accumulation in above mention area.


Indusind Bank Bullish Divergence on Daily ChartBullish Divergence + Price approaching Support trendline of the channel shown.
Such Divergence on daily chart indicates a strong bounce.
We already saw some buying towards the end of the day.
Buy around 1130 and hold or wait for horizontal support around 1045.

Indusind Bank LimitedIndusind Bank Limited is made low but rsi is trying to go up. This is a divergence .


Indusindbkindusindbk in channel support, trade when you get reversal in one hour. Follow the trend of the nifty and trade according to that, target and stoploss by your own

Indusindbk started to travel in parallel channel, after on hour closing trade according to that. follow the trend the trade

IndusInd Bank looks Bearish on Daily chart.Posted purely for Educational Purpose.!
Views are Welcome.!
Reason for prediction.
1) On Strong Resistance.
2) Below Trend line and will form a channel.

INDUSINDBKTake buy entry when it came to correction resistance level and the target levels in the chart


