DXY ON TODAYS NEWSThe upcoming NFP release is likely to bring heightened volatility across the markets. Based on my analysis, the U.S. dollar shows strong potential for upside movement, supported by prevailing market structure and momentum. While the forecast leans bullish, it is important to remain cautious as NFP d

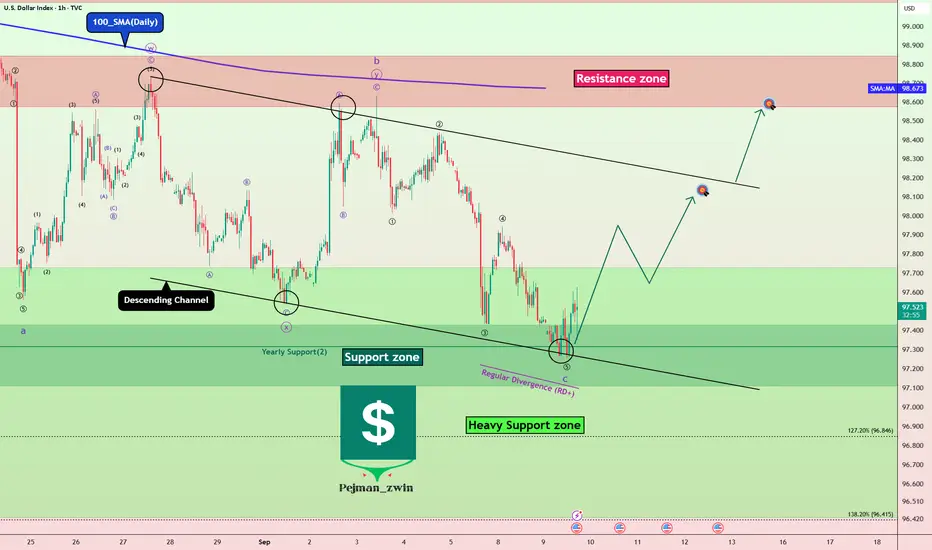
DXY at Major Support – Dollar Ready to Rebound?Today, I want to analyze the DXY index ( TVC:DXY ) for you. First, I must say that this week, US indexes can have an impact on the DXY index trend .
US indexes to be released this week:
Core PPI m/m: Tomorrow
PPI m/m: Tomorrow
Core CPI m/m: Thursday
CPI m/m: Thursday
CPI y/y: Thursday
US Dollar Index Drops to 7-Week Low Ahead of Key Inflation DataUS Dollar Index (DXY) Drops to 7-Week Low Ahead of Key Inflation Data
As the US Dollar Index (DXY) chart shows, the value of the USD against a basket of other currencies has fallen below 97.30 – its lowest level since late July.
The reasons lie in market sentiment ahead of major data releases:
→
DXY Long/Short The movement of the dollar index may be influenced by the dynamic interactions between buyers and sellers, as assessed using the harmonic crab algorithm.

DXY Analysis – Are Bad News Already Priced In?Since Trump entered the White House, the U.S. Dollar has taken a hard hit against its major counterparts, losing more than 10% overall.
But looking closer at the chart, we see a different story: since the April low around 97.80, the DXY has been stuck in a range-bound pattern, with the exception of

Fibonacci confluence signals bullish reversalUS Dollar Index (DXY) is falling towards the pivot and could bounce to the 1st resistance.
Pivot: 97.17
1st Support: 96.75
1st Resistance: 97.86
Disclaimer:
The above opinions given constitute general market commentary, and do not constitute the opinion or advice of IC Markets or any form of per

DXYDXY is expected to give us correction or impulse upside.
Disclosure: We are part of Trade Nation's Influencer program and receive a monthly fee for using their TradingView charts in our analysis.

USD Index Technical Outlook – Key Buy & Sell LevelsThe U.S. Dollar Index (DXY) is currently trading inside a clear downward channel, showing a bearish market structure. Price is hovering near 98.23, just below the key resistance zone between 98.5 – 99.2, where Fibonacci retracement levels (0.382, 0.5, and 0.618) also align, making it a strong supply

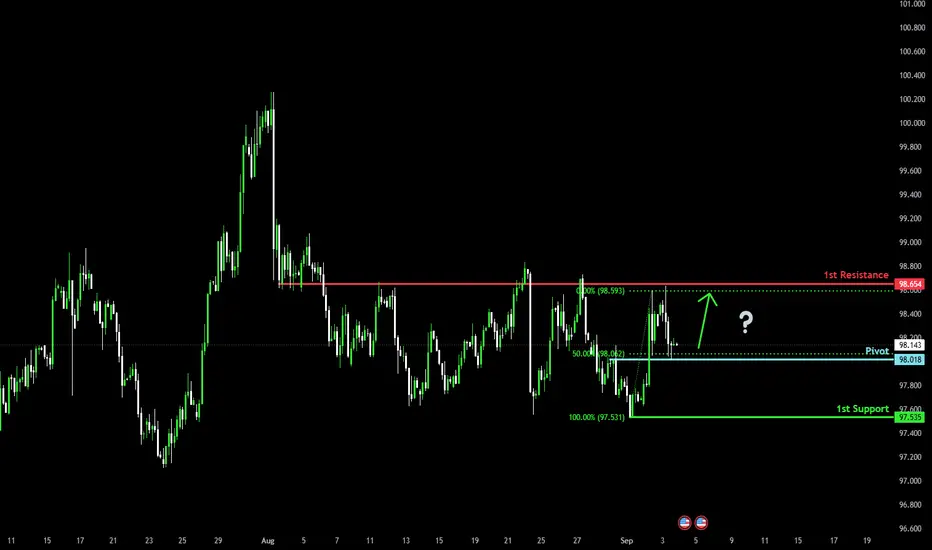
Bullish reversal at pullback support?The US Dollar Index (DXY) is falling towards the pivot, which acts as a pullback support that aligns with the 50% Fibonacci retracement and could bounce to the 1st resistance.
Pivot: 98.01
1st Support: 97.53
1st Resistance: 98.65
Risk Warning:
Trading Forex and CFDs carries a high level of risk
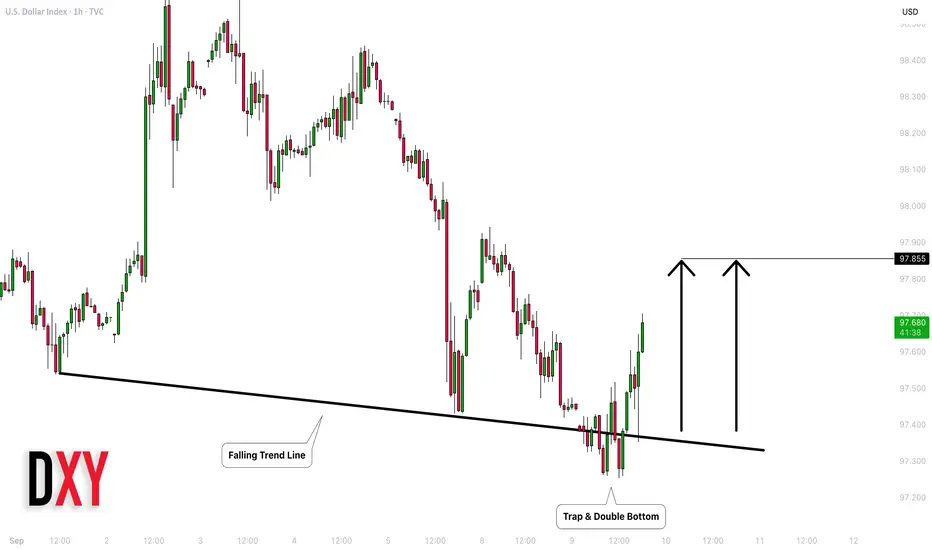
DOLLAR INDEX (DXY): Time to Recover
US Dollar finally shows a strength after a false violation
of a trend line and a formation of a double bottom pattern.
The index will most likely reach 97.85 level soon.
❤️Please, support my work with like, thank you!❤️
See all ideas
Summarizing what the indicators are suggesting.
Oscillators
Neutral
SellBuy
Strong sellStrong buy
Strong sellSellNeutralBuyStrong buy
Oscillators
Neutral
SellBuy
Strong sellStrong buy
Strong sellSellNeutralBuyStrong buy
Summary
Neutral
SellBuy
Strong sellStrong buy
Strong sellSellNeutralBuyStrong buy
Summary
Neutral
SellBuy
Strong sellStrong buy
Strong sellSellNeutralBuyStrong buy
Summary
Neutral
SellBuy
Strong sellStrong buy
Strong sellSellNeutralBuyStrong buy
Moving Averages
Neutral
SellBuy
Strong sellStrong buy
Strong sellSellNeutralBuyStrong buy
Moving Averages
Neutral
SellBuy
Strong sellStrong buy
Strong sellSellNeutralBuyStrong buy
Displays a symbol's price movements over previous years to identify recurring trends.
Frequently Asked Questions
The current value of US Dollar Index Futures is 97.75 USD — it has risen by 0.02% in the past 24 hours. Track the index more closely on the US Dollar Index Futures chart.
US Dollar Index Futures reached its highest quote on Sep 28, 2022 — 114.72 USD. See more data on the US Dollar Index Futures chart.
The lowest ever quote of US Dollar Index Futures is 88.13 USD. It was reached on Feb 16, 2018. See more data on the US Dollar Index Futures chart.
US Dollar Index Futures value has decreased by −0.59% in the past week, since last month it has shown a −0.32% decrease, and over the year it's decreased by −3.43%. Keep track of all changes on the US Dollar Index Futures chart.
US Dollar Index Futures is just a number that lets you track performance of the instruments comprising the index, so you can't invest in it directly. But you can buy US Dollar Index Futures futures or funds or invest in its components.