TQQQ Momentum Meets Options Flow | $92 Call YOLO?”
# 🚀 TQQQ Weekly Options Trade Idea (2025-09-03)
### 📊 Market Recap
* **Weekly RSI**: 🔥 70.9 (bullish)
* **Daily RSI**: 😐 49.7 (neutral)
* **Options Flow**: 💎 Strongly bullish (C/P = 1.78)
* **Volume**: 📉 0.9x (weak confirmation)
* **VIX**: ✅ Favorable (\~16–17)
👉 **Models Split:**
* 🐻 Gemini →
Related stocks
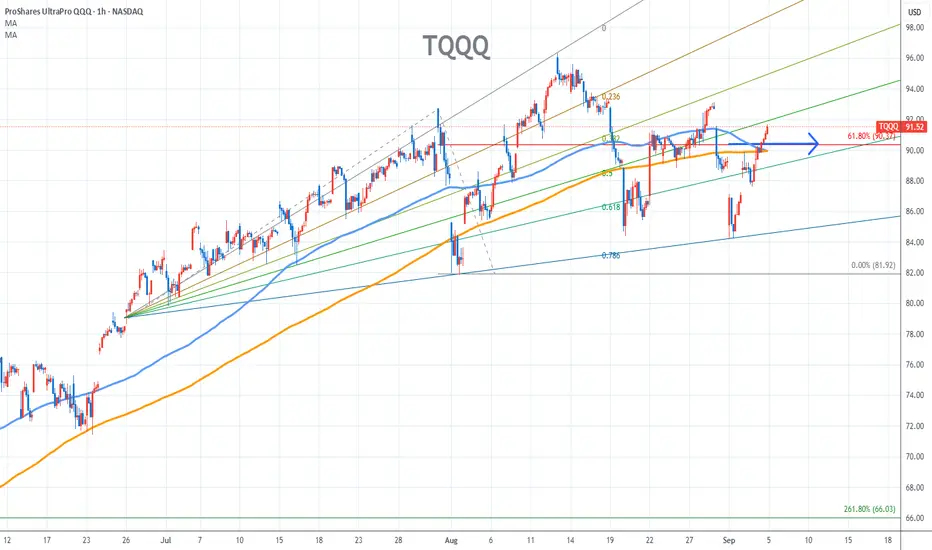
TQQQ Stock Chart Fibonacci Analysis 090425Trading Idea
1) Find a FIBO slingshot
2) Check FIBO 61.80% level
3) Entry Point > 90/61.80%
Chart time frame:B
A) 15 min(1W-3M)
B) 1 hr(3M-6M)
C) 4 hr(6M-1year)
D) 1 day(1-3years)
Stock progress:A
A) Keep rising over 61.80% resistance
B) 61.80% resistance
C) 61.80% support
D) Hit the bottom
E)
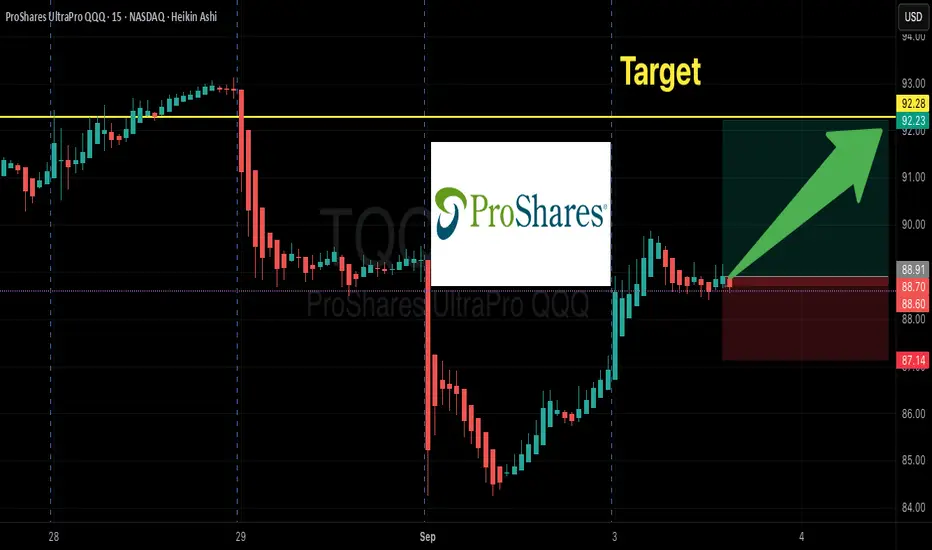
ProShares UltraPro QQQ (TQQQ) LONGThe Technology Sector Continues to Break Records
The tech sector keeps setting new highs, and alongside individual stocks, it's a great idea to consider investing in an ETF that mirrors the profits of the NASDAQ 100 index. One of the most attractive options is TQQQ - it’s more affordable than the i
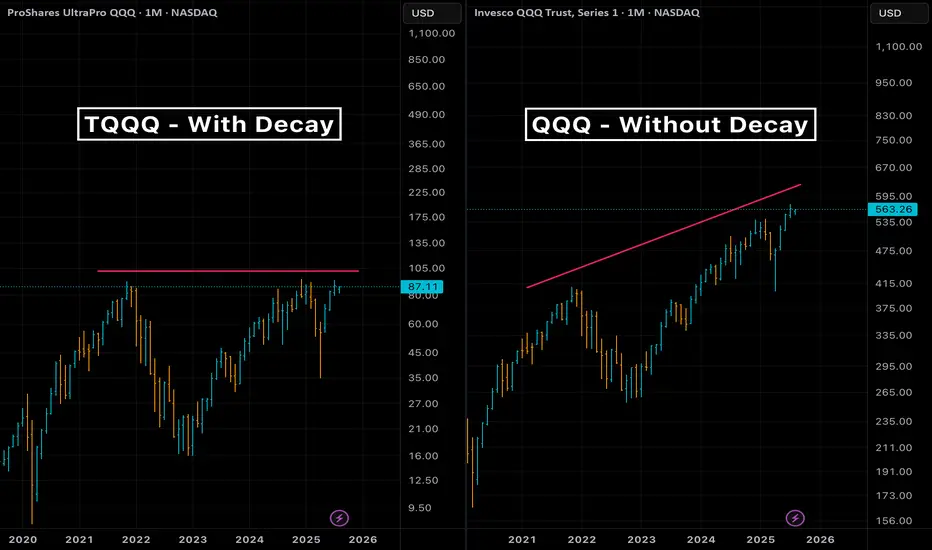
Turning leveraged ETF decay into preyWelcome to this guide on harnessing the natural decay in leveraged ETFs as a strategic edge, rather than fighting against it. We’ll assume you have a basic understanding of options and are comfortable using at-the-money (ATM) strikes as a conservative reference point—advanced users can tailor strike
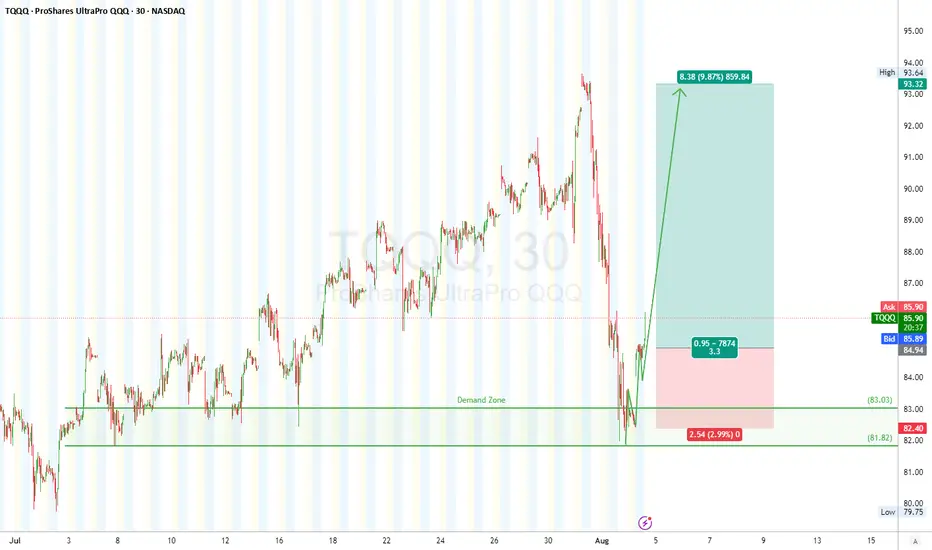
TQQQ Long SetupTQQQ 30-min Chart
Classic textbook move — 5-wave dump, corrective ABC grind, RSI divergence, and now we’re gunnin’ for that sweet Wave (3) explosion. Bulls sniped the bottom like sharpshooters at \$82–83. Strap in — this one’s cookin’ for a breakout!
### 🟩 **Demand Zone (Reversal Area)**
* Stron
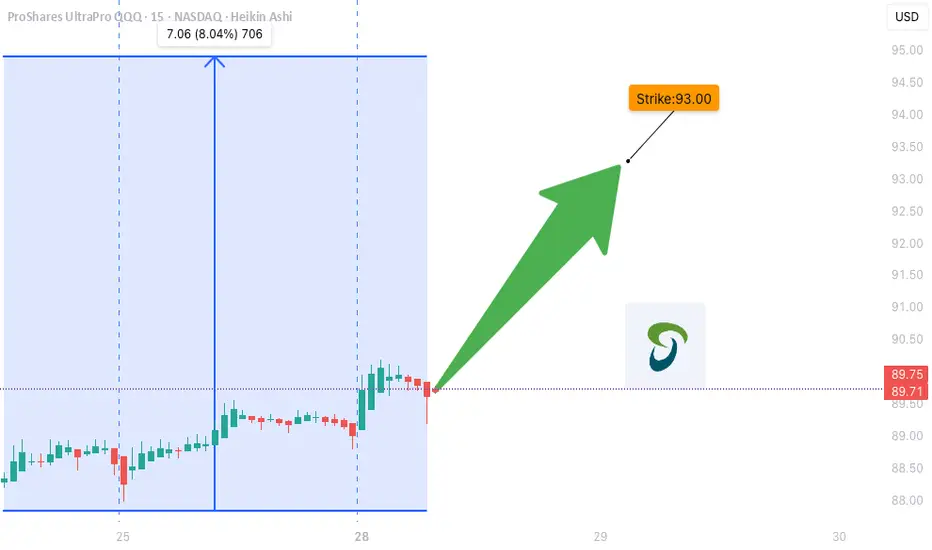
TQQQ WEEKLY TRADE IDEA (07/28/2025)
**🚀 TQQQ WEEKLY TRADE IDEA (07/28/2025) 🚀**
**Triple-Leveraged Momentum Play — But Watch the Volume Trap!**
---
📈 **Momentum Snapshot:**
* **Daily RSI:** 75.0 ⬆️
* **Weekly RSI:** 70.1 ⬆️
🔥 Bullish across **all timeframes** = strong trend confirmation
📊 **Options Flow:**
* **Call Volume:** 2
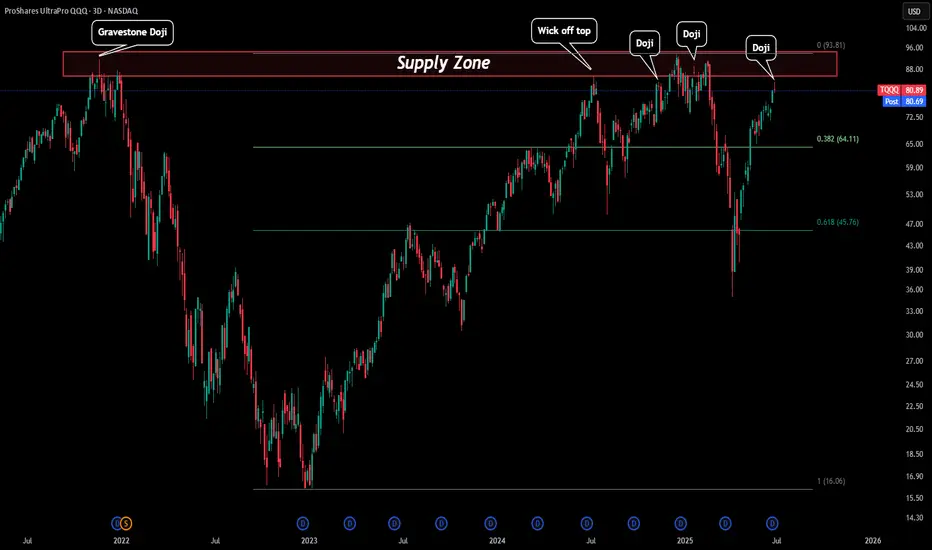
TQQQ - Red Days Ahead?TQQQ just created a 3D doji. The reason this is important is everytime we have seen reversal candles close to or in our red box (Supply zone) usually we see selloffs follow.
Price came very close to the red box and created a 3D reversal doji that could signal some downside price action. If this is
$TQQQ - $78 ishHey guys, the AI helped me ride the wayve from 68 all the way to 76. With a small pullback the AI says we'll see something around the range of 77.5 ish, closer to 78 quite soon.
Would buy all opporutnites below the 75 range. Anything below 72.5 is a crazy buy and anything below $70 for the moment m

$TQQQ Weirdly mildly bullishDon't understand why, don't care. My AI gave of a partial bullishness signal for tomorrow onwards for TQQQ. It believes this a buy the dip moment (Unless it changes it's mind for whatever reason).
This is a signal on 3 out of 16 of my 3.6 sharpe models which is fairly bullish. I also had a UVXY cal

$TQQQ - Small moonThe AI has been triggered on TQQQ and UVXY. Calls on TQQQ and puts on UVXY.
The models i have on these have a sharpe of around 3.4-3.6 which means these are almost guaranteed money making trades as long as your entry point is good.
I'm waiting for confirmation before i go in but i'm likely to enter

See all ideas
Displays a symbol's price movements over previous years to identify recurring trends.