
US30 Pullback Toward 44,600 Within Ongoing UptrendHey Traders, in today's trading session we are monitoring US30 for a buying opportunity around the 44,600 zone. Dow Jones (US30) is trading in an uptrend, with price currently correcting toward this key support/resistance level.
Structure: The broader bias remains bullish, but price is pulling back

SMB - WEEK 2SUNDAY MARKET BREAKDOWN - WEEK 2 of September 2025
Hope you learn one or two. Do like, comment & follow for more content.

US30 on bullish Us30 had confirmed high possibility of buy by supporting with a bullish engulfer and a double bottom on rsi with H4 timeframe

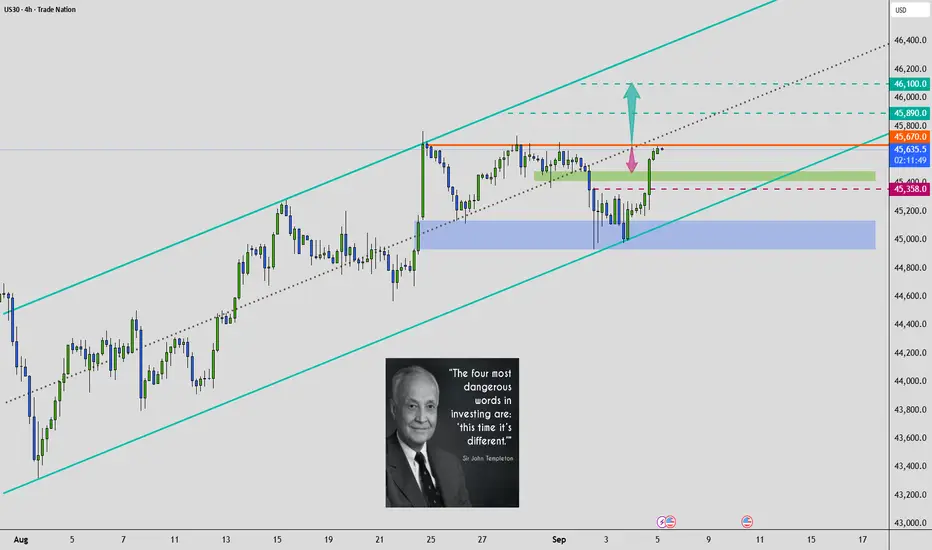
US30 - Potential Outcome This WeekDear Friends in Trading,
“I share only my perspective. In this industry, learning never ends, but progress comes when we learn from mistakes without repeating them.” - ANROC
1) BULL trend prevails.
2) Again, price is running towards the same supply liquidity area pre-CPI release.
3) Can it push th

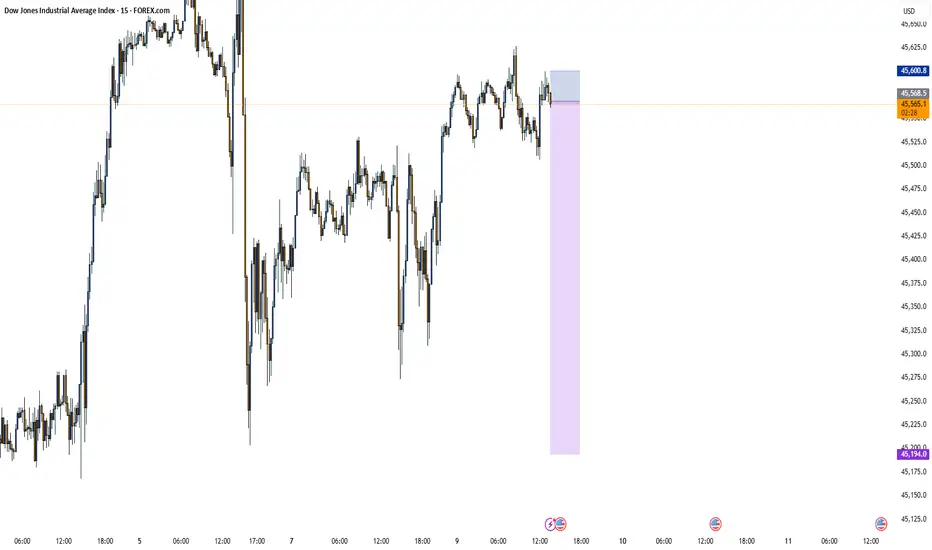
US30 ShortElite Analysis
I will be patient and wait for price to come back up to my OB (orange rectangle)
I will execute from that price point.
All confirmations have been met, now we wait for the market to come to us
Targeting lower liquidity pools

US30 UPDATE: Pre-Post Potential 4 NFPDear Friends in Trading,
1) NFP Today - Be safe.
2) TIP - Post NFP Mondays: (Applies to all instruments - Forex, Indices & Metals)
-----"ASIA + LONDON SESSION's PRICE ACTION IS BIG AND OPEN MOST OF THE TIME"-----
Keynote:
MARKET STRUCTURE = TREND = INTACT
I have highlighted a few possible support
US30 The Target Is UP! BUY!
My dear followers,
This is my opinion on the US30 next move:
The asset is approaching an important pivot point 45417
Bias - Bullish
Safe Stop Loss - 45314
Technical Indicators: Supper Trend generates a clear long signal while Pivot Point HL is currently determining the overall Bullish trend


See all ideas
Summarizing what the indicators are suggesting.
Oscillators
Neutral
SellBuy
Strong sellStrong buy
Strong sellSellNeutralBuyStrong buy
Oscillators
Neutral
SellBuy
Strong sellStrong buy
Strong sellSellNeutralBuyStrong buy
Summary
Neutral
SellBuy
Strong sellStrong buy
Strong sellSellNeutralBuyStrong buy
Summary
Neutral
SellBuy
Strong sellStrong buy
Strong sellSellNeutralBuyStrong buy
Summary
Neutral
SellBuy
Strong sellStrong buy
Strong sellSellNeutralBuyStrong buy
Moving Averages
Neutral
SellBuy
Strong sellStrong buy
Strong sellSellNeutralBuyStrong buy
Moving Averages
Neutral
SellBuy
Strong sellStrong buy
Strong sellSellNeutralBuyStrong buy
Displays a symbol's price movements over previous years to identify recurring trends.
Frequently Asked Questions
The current value of Dow Jones Industrial Average Index is 45,615.54 USD — it has risen by 0.01% in the past 24 hours. Track the index more closely on the Dow Jones Industrial Average Index chart.
Dow Jones Industrial Average Index reached its highest quote on Aug 22, 2025 — 45,761.06 USD. See more data on the Dow Jones Industrial Average Index chart.
The lowest ever quote of Dow Jones Industrial Average Index is 18,170.00 USD. It was reached on Mar 23, 2020. See more data on the Dow Jones Industrial Average Index chart.
Dow Jones Industrial Average Index value has increased by 0.92% in the past week, since last month it has shown a 3.23% increase, and over the year it's increased by 11.70%. Keep track of all changes on the Dow Jones Industrial Average Index chart.
Dow Jones Industrial Average Index is just a number that lets you track performance of the instruments comprising the index, so you can't invest in it directly. But you can buy Dow Jones Industrial Average Index futures or funds or invest in its components.