MASK/USDT — Testing Big Support! Big Rebound or Major Breakdown?
🔎 Overall Analysis
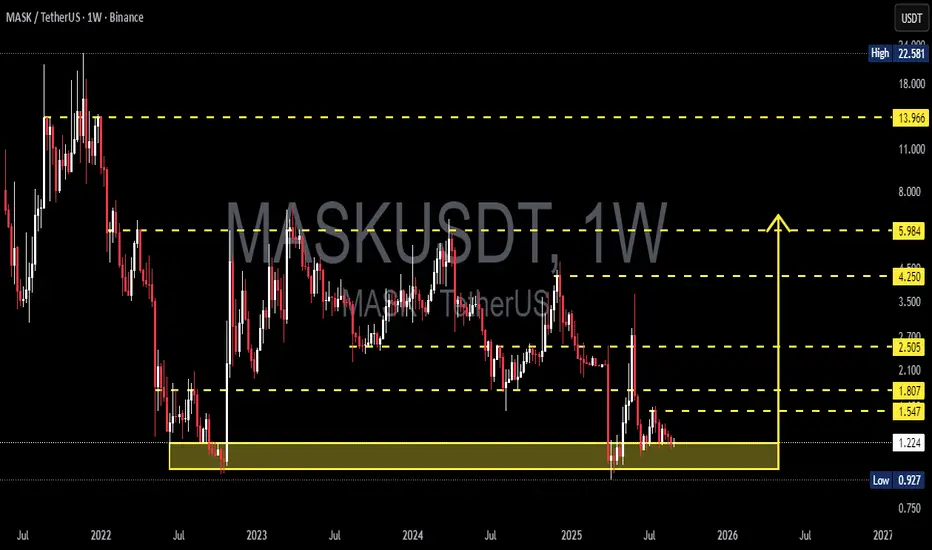
MASK is once again testing the historical support zone at 0.93 – 1.22 USDT (yellow box), an area that has repeatedly acted as a demand zone since 2022. Each time price revisited this region, it sparked strong rebounds.
However, the long-term structure remains bearish with a clear pattern of lower highs. This means that while support is strong, the broader trend is still downward unless we see a confirmed structural shift.
In short, MASK is now at a critical turning point: will this zone serve as a springboard for another rally, or will it finally give way and open the door for deeper downside?
---
📊 Key Technical Levels
Main Support Zone: 0.93 – 1.22 (yellow box).
Nearest Resistances:
1.547
1.807
2.505
4.250
5.984
13.966 (major resistance before ATH).
All-Time High: 22.58
---
🟢 Bullish Scenario
If MASK can hold above 1.22 and confirm a weekly close above 1.55–1.80, upside momentum may return.
Short-term target: 1.807.
Mid-term target: 2.505.
Long-term potential: 4.250 – 5.984 if a strong breakout occurs.
Bullish factors:
1. Historical demand zone (yellow box) has triggered multiple rebounds.
2. Noticeable volume spikes when price tests this support → sign of buyer interest.
3. Possible double bottom / accumulation base formation if price holds the zone.
---
🔴 Bearish Scenario
If MASK closes below 0.93 on the weekly chart, this support zone would break, signaling a strong bearish continuation.
The next downside levels are unclear (no major historical support below), leaving room for a capitulation move.
The bearish trend of lower highs would be further reinforced.
Bearish factors:
1. Larger trend remains down.
2. Every rally so far has ended with sharp rejections.
3. Weak buying momentum during upswings.
---
🧩 Chart Pattern Insights
Current price action shows consolidation within a demand zone — trapped between strong demand (0.93–1.22) and supply (1.55–1.80).
Repeated liquidity grabs / false breakouts (long wicks) suggest whales accumulating liquidity.
A strong base here could mark the beginning of a larger reversal — but without confirmation, it may also be distribution before a breakdown.
---
📌 Conclusion & Strategy
MASK is now at one of its most critical support levels in years.
As long as 0.93–1.22 holds, chances for a rebound remain.
Bullish confirmation requires a strong weekly close above 1.80.
A breakdown below 0.93 would open the door for further downside and potential capitulation.
👉 Best approach: wait for confirmation before committing heavily. Aggressive traders may consider small entries near support with a tight stop below 0.93.
---
#MASKUSDT #MASK #CryptoAnalysis #SupportResistance #WeeklyChart #TechnicalAnalysis #Altcoins #SwingTrading #CryptoCommunity
MASKUSDT.P trade ideas
$mask reclaiming 50 ema on D1
assuming we may wick below before weekly close but recon we good for $3plus quickish
rsi popping up dominance nuking

MASKUSDT - SELLERS ARE IN CONTROLChart shows interesting pumps and dumps, but buyers still haven’t stepped in. The strongest selling area is marked with a black box where sellers remain in control.
Watching how price reacts if it returns there: if sellers stay strong, no trade; if we see footprint absorption + CDV divergence + structure reclaim, it may offer a reversal setup.

MASK Analysis (3D)The correction for MASK has started from the area marked as “Strat” on the chart.
This appears to be forming a symmetrical correction, and we seem to be approaching the end of wave I.
The green zone is considered the most favorable and low-risk area for the completion of wave I.
Targets are indicated on the chart.
A daily candle closing below the invalidation level will invalidate this analysis.
For risk management, please don't forget stop loss and capital management
Comment if you have any questions
Thank You

MASKUSDT 1W AnalysisMASK ~ 1W Analysis
#MASK Buy back gradually from here if you still have confidence in this coin with a short term target of at least 20%+ from this support.

I believe Mask will go bullish up to 50% this week!Mask analysis:
Price has broken the support area and retested it. There is a downtrend line acting as a resistance area. This is a no-trading zone, and we will open new positions only if the price is able to break above the downtrend line.
Resistance Area: $1.8-56

MASK – Critical Trendline Retest and Next MoveMASK is clinging to the descending trendline on the daily chart after a tough rejection on the 4-hour timeframe and a steep 40% drop 📉. This level could be the springboard for a reversal move 🚀, or if it fails, it may open the door to more downside action. Keep an eye on this zone — the next move could set the tone for the broader trend 👀.
GATEIO:MASKUSDT

maskIt has formed a good bottom
But there are many obstacles in its way to throw
The first step is the red box for now
And the most important support that I see now is these two green lines. So for now, be careful not to allow it to drain liquidity until the red box is broken

Mask Network, High Volume & Back To Baseline (More Up Yes!)This is not the only altcoin that has been growing strongly since early April. MASKUSDT hit bottom 9-April and has been growing since, producing a total of 210% growth. There are many, many pairs in this same situation. We've been looking at those.
The crash was really strong in early April producing a huge rounded bottom. You know what I say, when there is a crash, fast down, there is a strong recovery, fast up. The baseline becomes the range before the major move; orange on this chart.
Mask Network moved above the baseline level with really high volume and even broke above the 1-April high, hitting today the highest level since mid-January 2025. That is more than five months of bearish action fully recovered.
This is not the end, truly just the beginning.
For trading purposes, growth potential, you could remove the breakdown portion and start counting as if the market was sideways. Meaning, there is plenty of room available for growth for this pair.
What one does, the rest follows.
The fact that Mask Network is bullish confirms that the rest of the market will also grow.
Everything had a crash in April, everything had a recovery in May, everything will be super bullish in the remaining half of 2025.
Thank you for reading.
Your support is truly appreciated.
I'll you see at the top. That is where you belong.
Namaste.

Mask Network MASK price analysis🤖 Now "they" are trying to “restore” #MASK price after “someone accidentally let it go free.”
After such a sharp drop in the price of OKX:MASKUSDT , probably 80% of long positions have been liquidated.
Those who held this coin on the spot should watch carefully, as there may be a chance to sell it either at "zero" or at a profit!
🍿 Because, looking at the OKX:MASKUSD chart now, we can assume that “those” who are raising the price of #Mask now have announced a "hunt for shorts".
This is, of course, our assumption, but the vendetta against those who shorted OKX:MASKUSDT in difficult times and drowned it in even more “blood” is close at hand.
✔️ $2.10 - $2.70 - $3.50 - $4 - these are the levels that the price of the #MaskNetwork token can reach when the “short squeeze” starts - a cascade of liquidations that accelerates growth.
_____________________
Did you like our analysis? Leave a comment, like, and follow to get more

MASK PERPETUAL TRADE, Sold From $2.86MASK PERPETUAL TRADE
MASK SELL SETUP
Currently $2.86
Sold From $2.86
(Trading plan If MASK go up to $2.99
will add more shorts)
Expecting target $2.77 OR DOWN
In the event of an early exit,
this analysis will be updated.
Its not a Financial advice

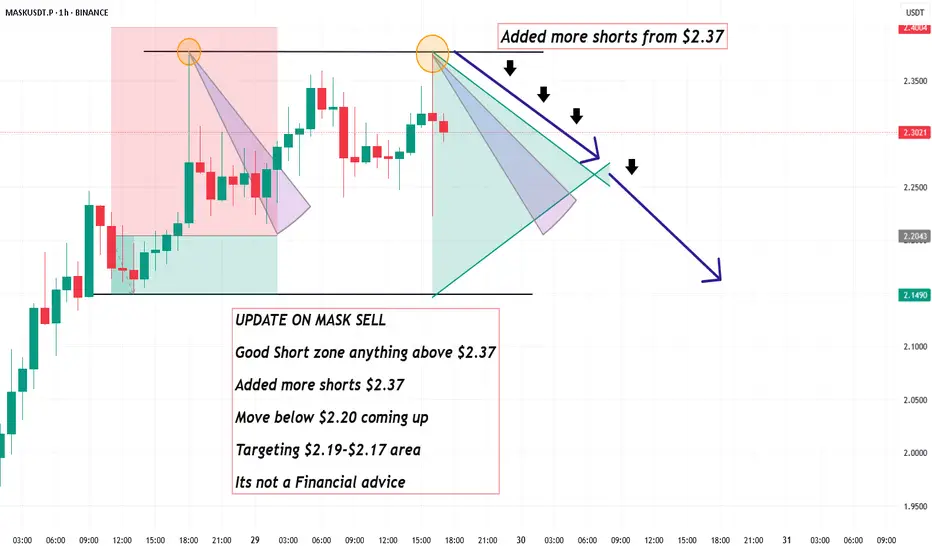
UPDATE ON MASK SELL, Good Short zone anything above $2.37UPDATE ON MASK SELL
Good Short zone anything above $2.37
Added more shorts $2.37
Move below $2.20 coming up
Targeting $2.19-$2.17 area
Its not a Financial advice
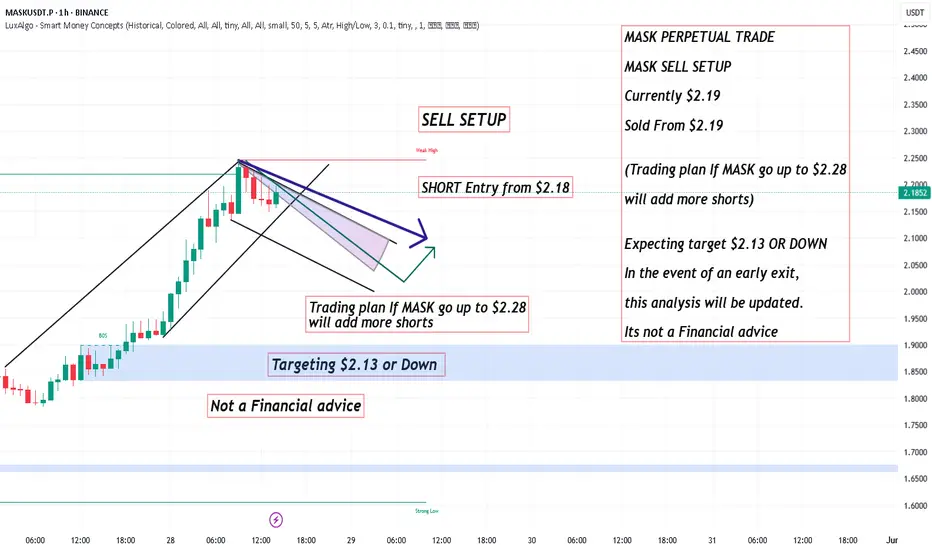
MASK PERPETUAL TRADE ,Sold From $2.19MASK PERPETUAL TRADE
MASK SELL SETUP
Currently $2.19
Sold From $2.19
(Trading plan If MASK go up to $2.28
will add more shorts)
Expecting target $2.13 OR DOWN
In the event of an early exit,
this analysis will be updated.
Its not a Financial advice
MASK/USDT Technical Analysis – Bullish Setup Forming?
🕒 Timeframe: 4H
📈 Exchange: Binance
💱 Pair: MASK/USDT
📌 Overview:
MASK has recently shown strong bullish momentum and is now in a healthy correction phase, pulling back toward key Fibonacci levels. This could present a potential long opportunity – if the structure holds.
🔍 Price Action & Fibonacci:
🔹 Price is retracing from local highs.
🔹 Key Fibonacci retracement support:
🔸 0.5 @ $2.084
🔸 0.618 @ $2.152
These levels act as strong demand zones and may offer a bounce setup.
---
📊 Indicators:
✅ RSI (14):
- Currently holding above 50 → Positive momentum.
- Staying below 70 avoids overbought signals.
✅ MACD:
-
- Watching for continuation or signal line crossover.
✅ EMA:
- Price remains above EMA 50 → Short-term bullish trend intact.
- A break below EMA 50 could signal trend weakness
🎯 Trade Idea:
📌 Long Scenario:
- Entry: $2.08 – $2.15
- Stop Loss: Below $2.05
- Targets: $2.30 → $2.45 → $2.60
📌 Short Scenario (if breakdown):
- Entry: Below $2.05 after retest
- Stop Loss: Above $2.15
- Targets: $1.95 → $1.80
⚠️ Risk Management:
- Futures traders: Watch leverage.
- Monitor BTC/ETH as leading indicators.
💬 What’s your bias – are you buying the dip or waiting for confirmation?
📍 Like & Follow for more setups and updates!

Short MASKUSDT.P🎯 SHORT TRADE PLAN – MASK/USDT
Entry: 1.890–1.895 (wait for PA confirmation)
SL: 1.950 (above POC resistance)
TP1: 1.644
TP2: 1.50 (optional, trail)
R:R = ~1:4
Reasons:
- Bearish market structure (H1)
- Pullback to high-volume node (POC)
- Potential SFP or bearish PA confirmation on LTF
⚠️ Rules:
- No entry without PA signal
- Move SL to BE after 1R
- Cut loss clean if invalidated

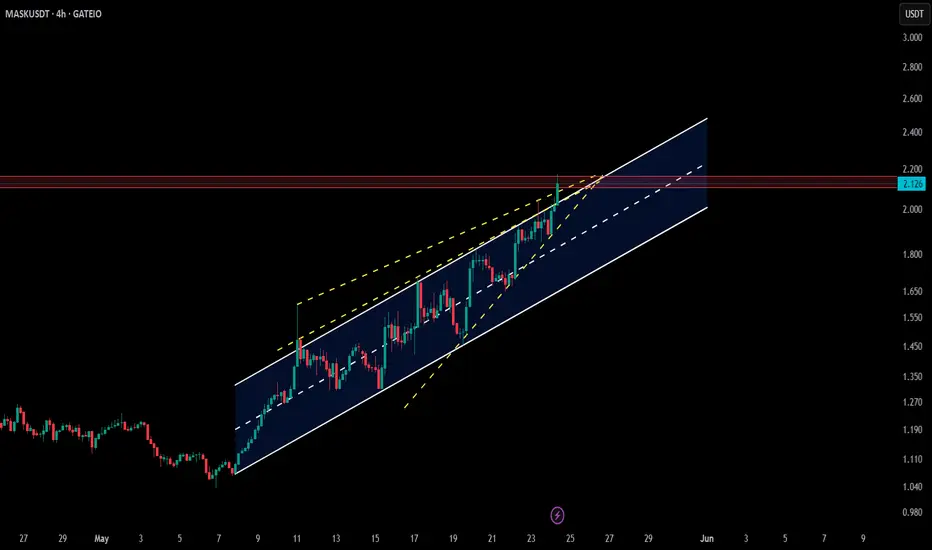
$MASK – Channel Breakout in Motion🔼 NASDAQ:MASK – Channel Breakout Watch (4H)
📈 NASDAQ:MASK has broken above the ascending channel on the 4H timeframe — signaling bullish momentum building 💪
📍 Eyes on the $2.03–$2.08 range for a potential retest and support zone.
🗓️ On the daily chart, a decisive close above $2.20 could unlock the next upside leg 🚀
The structure remains clean, and buyers are showing strength.
👀 Keep it on your radar — this move could extend if momentum holds!
maskusdtmaskusdt
long live the king
It's just an idea please don't take it serious
usual players settlements at 100

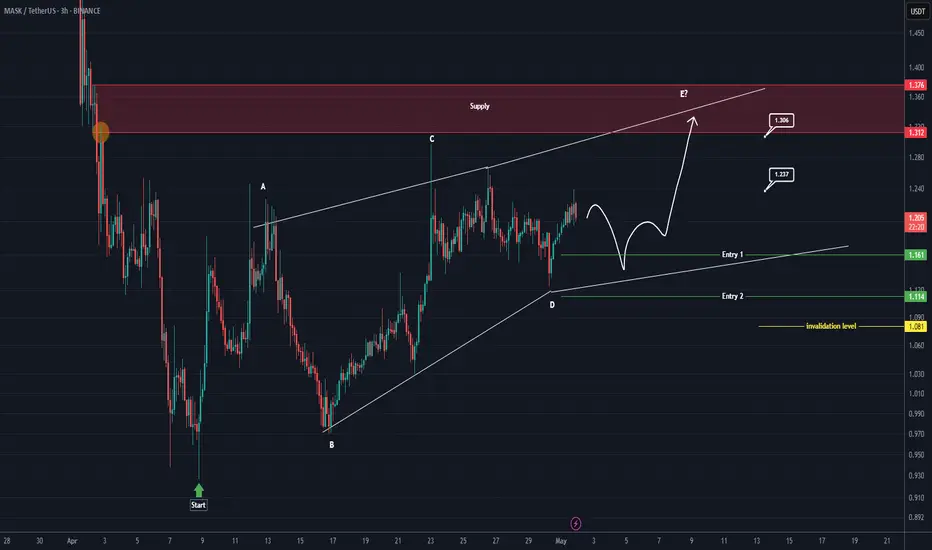
MASK Looks Bullish (3H)Since we placed the red flash on the chart, it seems that the bullish phase of MASK has started. This phase appears to be either a diametric or a symmetrical pattern. We are currently in the middle of wave D. After wave D completes, the price could enter a bullish wave E.
We can look for buy/long setups at the entry points.
The targets are indicated on the chart.
A 4-hour candle closing below the invalidation level will invalidate this analysis.
For risk management, please don't forget stop loss and capital management
When we reach the first target, save some profit and then change the stop to entry
Comment if you have any questions
Thank You
Mask Network (MASK)Mask is moving in a downtrend channel. If price breaks the upper band, theoretically, it can ascend to a level equal to the width of the channel. Although, behavior of price movement may change after the channel breaks; so keep that in mind.

MASKUSDT 1W AnalysisMASK ~ 1W Analysis
#MASK This trade is very high risk Buy from here if you still have a Conviction on this coin with a short -term target of at least 20%+ from here.

#MASK USDTEvery high is an opportunity to get out, don't miss the opportunity to buy at low prices
Don't rush to buy, soon the prices of all coins will return to where they started.
Do not trade futures in this market at all, only spot

MASKUSDT // 0.878 is our strong support point. Cutting losses in possible closings below 0.878 will be the right decision. According to your risk understanding, our first take profit and 8 exponential average. second profit point is the Kaufman indicator.

Mask Network: Early Bullish, Not Yet Confirmed But A Sure ThingDon't tell me you don't see it. If you tell me you can't see it I will not believe you. Can't you see? Can you see it?
MASKUSDT is no longer red, no longer down but sideways. It ended up going sideways after the early February low, why is so?
Why wouldn't a crashing market continue moving down, forever down? More down, give-take down, more and more! Why not? Why would a bleeding market set to crash for years to come, produce zero volume on the drop and stop moving as a long-term higher low, confirming support?
Why, why, why?
Why is the higher low so strong in February 2025 compared to August 2024? Why?
I'll tell you why, because Bitcoin is going up.
MASKUSDT is going up.
The Altcoins are going up.
Cryptocurrency is ready to grow.
Follow to show your support.
Namaste.
