Trade ideas


Remain Bold Remain Bullish Crypt Future is Bright 🌊🏄♀️Levitation like rallies and Apocalyptic corrections.
BTC and by extension Crypto on whole, are in
extraordinary Bullish momentum phases.
As a former sceptic, semi-recent convert to the cause
my struggle was not comprehending what charts were actually communicating.
When the mind opened, wisdom was received.
Buy w/Cash. Buy Dips, Hold, Buy Dips repeat x infinitum
CRYPTOCAP:BTC
COINBASE:BTCUSD
COINBASE:BTCUST
FTX:BTCUSDT
BINANCE:BTCBUSD

btcusdThe main target of the market is on these linesThe main target of the market is on these lines. You can risk these lines in the market

Bitcoin performing parabolic break out Everything is in the chart. You can scalp it all the way to there or just buy and hold.
Due to the SEC having a mostly positive outlook on cryptocurrency.. we are seeing a parabolic break out. We can expect it to retrace once it reaches the area indicated on the chart. This is most likely just the beginning. Pretty much all Crypto will follow bitcoin. Good luck to everyone


BTC W1 CHART SAME TOUCH AS ON 2017Long time no see! As you can see btc touched same trendline as it was in 2017, from there I think we can drop to about 900B Marketcap ($52.000) and after that I expect BTC to explode to new highs.
I have small short position opened from there.
Good luck!

PERGERAKAN KOIN BTC HARI INICoinvestigasi akan update pergerakan koin, jangan ketinggalan berita dari Coinvestigasi !!!

BTC 4H Tight consolidation area market must breakout the zone and up said supply and market distribution auto key zone has ben unfilled
so i am waiting to short more stronger for the are off 4h supply and waiting the market pullback downsaid say key demand Zone for the long term i face market breakout the key up said final supply market turn trend long term
2) the point is selling that .
already bull trend break out and new structure is create that is my lost key try to sell of the high supply

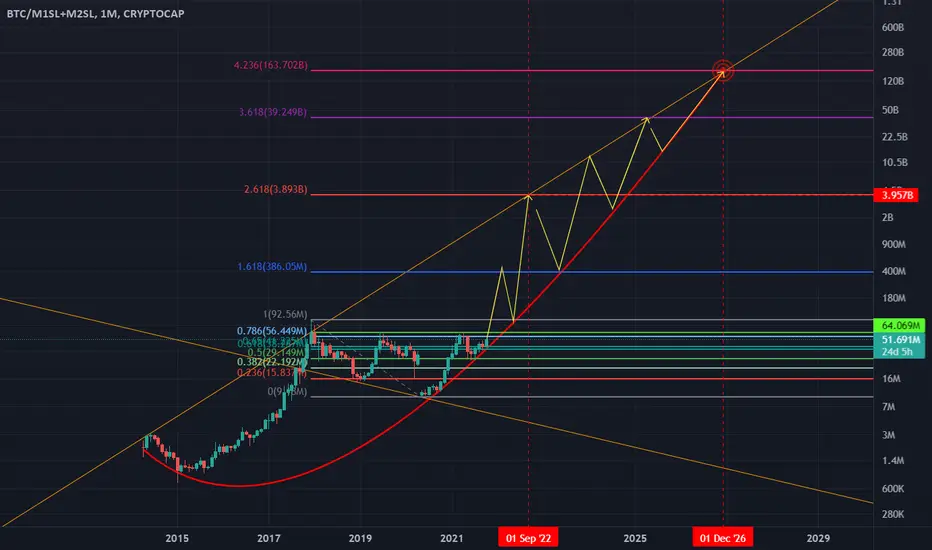
This is what hyperinflation looks likeBTC / M1SL+M2SL
Bitcoin price to ~164 million dollars per coin after the next cycle. As high as ~4 million this cycle.
Ask me how crazy I am.
Yes.
This Cycle Bitcoin Market High and LowStudy the chart
This chart shows a humble Goal for the Bitcoin Market Cap Top at 2.008 Trillion Dollars , a modest goal for Bitcoin that would put the price at roughly 105.000 $
This chart also predict the Bottom at 750 Billions dollars which would signify a bottom price of 39.000$

#BITCOIN MCAP FLIPPENINGHow many assets can bitcoin Flippen before the EOY? I understand that the market cap of each asset will fluctuate, but I think this will be a decent gauge and fun to watch.

Table chart total BTC ALL market capFinancial Investment global average. Ads sponsored chart financial.

BTC - PennantPrice is compressing, on look-out for a triangle. Resistance is at the Bear Flag Break 1.272. The 50 SMA would be next test in a move-up.

BTC - EQ in 3DBTC has found equilibrium with resistance at the four hour eight period exponential moving average (8EMA). The loss of the Fifty Period Simple Moving Average (50SMA) after the HL - HH pattern (highlighted circle) is a spot to look for resistance to the upside. The Bear Flag / Pennant confirmed to only 16.3%, failing to reach the first marker at the .214 break level.

BTC - Four Hour Bear FlagSupported by the .382 of the 64.9-28.8K retracement zone; this is the classic bear flag look. The red line is the eight period exponential moving average (8 being a fib number) and the blue line as the the 50 period simple moving average. The Bollinger Bands are based on a 20 period median with 2 standard deviations as the upper (UBB) and lower (LBB) boundaries.

Watch The Caps And Be Carefull!Everyone is hyped again. But we are near the double top (ATH) resistance in all major marketcaps. There is a big chance to bounce off and fall fast and hard. There is a small chance to ignore all sanity and break through. But well ... Hope dies last ...

this is a good 1 day chart old but a goodie tried n truequick post but if alt hunting think value think L2 think dex's racking up fees and any real cross chain esp if a fiat on n off ramp incorporated easy to use deal is king here... what is usable and will continue to grow and be adopted.
small cool off as we get choppy n market decides where r new support and resistance box will be. do we see sustained positive uptrend overall crypto market primed for alt scalping n dip accumulation orrr do we see a huge pump small dip n then the big pump n dump as we consider some new ATH's. this second narrative seems more likely if we play this out over a longer time span. in the short we know it will be choppy but will the bottom just fall out as we _retail_ falls asleep or do we go up n up then shake out.... whacha all think big funds playn in the waters how will this impact the gen market trend over next week weeks n month or two.... whacha all think????
General crypto Market info_
coinpare.io coinmarketcap.com www.coingecko.com
news aggregator/crypto news feed n more_
cryptopanic.com
all things crypto market announcements etc calendar_
coinmarketcal.com
wallet tracker_
app.zerion.io
Eth wei_gas tracker_
txstreet.com
dex’s we use:
app.1inch.io
uniswap.org
zks.app
some of this below is from last month but still trending and relevant now.
1inch snx uniswap
zks
matic
fantom/ YFI aave mkr aave comp defi in general u cant miss
Voyager vgx
Bch e cash
Thore chain n rune token
Ada occ launch pad n more
Ada n cel link up
Reddit L2 bridge whats the stock token etc etc how does it work how much can u make how does that work
Serum
Injective protocol
Security tokens like z cash
Whats this meme stonner cat nft with ashton Kutcher mily who ever n vitalek butarian
Xrp payment network rumors n huge blocks being bought n put in place kinda gotta spend those bag holders profits with all this sec trouble they doing well tho n that dream team legal squad they got is setting new precadents
Omg
Band
Link
Lina dmst n other video games is it just hype see enj
Social media platforms like theta brave n aave launching twitter for them what else
Uniswap mentions for v3 like uma compound snx of course n who else again
Cross chain gonna be big like badger n keber or even enjin wallet etc enj mana
Open sea saw huge increase in use n traffic need to sell n build nft’s land whatever

man i want to be wrong on some of this_esp past shakeout postsWhat ya all think... Is there a correlation with the eth.d and btc .d _ WEI or eth network traffic_ all tied into the how leveraged or lopsided is the long and short positions. fear n greed indicators when lopsided is the "scene setting" or the narrative to manipulate or trade from ie we need a starting point. so follow me here. markets dropped rite and eth.d put up a bull flag or in btc case last few months btc .d hits 40 .% we might see the markets stabilize_ dump_ whatever =_____but once that btc .d breaks from that 40% we see a btc rally then alts while the money pumps thro etherium network into n out of alts. eth goes sideways up as alts go nuts wei spikes retail piles on and boom that was the run to 39k then 44k now here. That btc pump liquidated or REKT almost 900 billion in over leveraged traders (interesting that glassnode data shoed A LOT of newer wallets.) fear n greed was in full fear. wei was flat like 20wei n some days 10wei (ME n many small fish used this op to get smaller positions out of older pools etc _smart contracts that use lots of gas to get in n out) when the pump started we saw eth network spike harder n faster then ive ever scene b4. 400 like nothing then 600 then retail got in n we went to 700 plus. since then we see sudden wei spikes into the 900s plus then a cool off or steady stream of 100 plus wei traffic (funds taking profits as quite as possible n the spike is the open butt naked pump)
what this ramble is about comes down to 2 things.
BIG MONEY is playing around on uniswap sushiswap 1inch L2 dexs u name it n super deep into defi esp lending etc. that is a fact. whatever there game whatever the theory just keep this in mind. this is a new type of very smart very organized group of killer wales out for blood.
2nd is there is crazy correlation in this market. many many data points. its overwhelming try n tune out the bs the noise and pick patterns that make sense to you n build your style and strategy from there.
there is manipulation but weather shake out or not same place in the end. the race is on the games r just getn started so just be ready to move fast and never be skeeerd to take dem profits.... trade on ya all n be safe-ish out there
PS when in doubt just zoom out... that or just buy da dip ETHHHHHH n then BTC and take a 10 year nap _HGMout YA all love ya humans and all life forms out there that even give a bit of a d@m
timeforcrypto.com
bitcoinik.com
General crypto Market info_
coinpare.io coinmarketcap.com www.coingecko.com
news aggregator/crypto news feed n more_
cryptopanic.com
all things crypto market announcements etc calendar_
coinmarketcal.com
wallet tracker_
app.zerion.io
Eth wei_gas tracker_
txstreet.com
dex’s we use:
app.1inch.io
uniswap.org
zks.app

Macro Cup & Handle Possibly Forming on Bitcoin and Multiple AltsThis chart is related to the recent altcoin charts I made, there may be a trend forming on BTC and Alts, however the chart isn't valid until trend completes.

4hr crypto market capTrying to 200EMA support and 20EMA resistance if break out than may Market bullish if breakdown may 🐻.

Giant cup & handle on BTC adjusted for M1This chart shows BTC adjusted in alignment with the value of USD, when M1 money supply is accounted for.
As we know M1 was discontinued by the Fed allegedly because it paints a less than rosy picture of high inflation. The website shadowstats has done an excellent job of tracking these figures since the 70's.
When BTC is adjusted for this we can see that in this bull run, up to May we didn't even surpass the previous ATH. Ben Cowen covered this on his Youtube channel recently.
I have noticed a massive cup & handle forming on the daily chart & wanted to share it with you guys here. If you have any further ideas on this interesting chart please link in the comments!
NOT FINANCIAL ADVICE

Bitcoin Correction Soon !Bitcoin is showing bearish momentum and a Bearish ( W ) top pattern for weak ! If it breaks down under 47k We are probably in for a correction in September.
