Repeat of the 100B market cap flip at 1 trillion marketcapRepeat of the 100B market cap flip at 1 trillion marketcap
Trade ideas

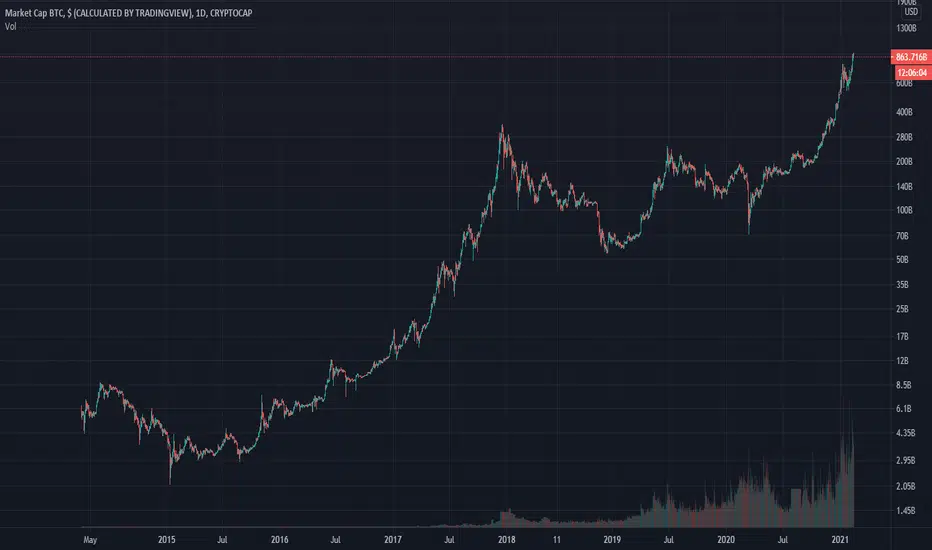
BTC.Total market cap _1 day ://well btc did that_NEW ATHupdated chart _1 day (notice rsi money flow volume patterns marked in orange_ look to prev. 2017 bullrun rsi _ see the aggression compared to last time, nice easy flow_ no sharp or real aggresive flow to the upside like this time ie retail is cereal serious pump'n fiat into cryptoi_BTC
_HGM T3Am


Another leg up for 1T BTC market cap :)Hi All,
What do you think?
Sooner rather than later?
Thnx
Jad


Bitcoin February fractal setup to push us over 1 trillionThis idea is based on a fractal from the Jan/Feb consolidation phase. If the market plays out in similar fashion we should see about a 75% price appreciation by the end of March.

BTCUSD H4 ShortStructure: downtrend
Tendency: downward
Rejected the newly established supply zone.
Candle: engulfing down bar

Bitcoin Blowoff top on Cinco De Mayo.. compare this to NASDAQI have analyzed the entire history of bitcoin price and I can say with certainty we are experiencing a 2x faster cycle than the one we had in 2017.
This will end with a blowoff top in May followed by a 2-3 month bear market.
I've analyzed 100 years of NASDAQ and DJIA charts, and compared them to every tiny mini cycle bitcoin has had, as well as the long term Bitcoin chart as seen here. I can also speculate that the Bitcoin chart from 2009 - 2021 is about 60% of the way through a bigger cycle that should end with a blowoff top in approximately 2030.
If you have doubts feel free to discuss, but this is a very big deal.

In the event of a breakdown to the bottom, I will sell (inchalahIn the event of a breakdown to the bottom, I will sell, but if it rises, I will not buy it, because I see Bitcoin will visit low prices (inchalah)

Bitcoin trillion dollar bull flagplease watch my linked video below in RELATED IDEAS for a detailed description
I think this is a big deal.


CryptoCAP BTCIf wave (b) has really been completed, we are in wave (c). This means that Bitcoin will lose more than 98% of its speculative capital. This would correspond to a price between 900-1000 USD.

Sunset on BTC? - BitPig Terminal SetupI've been both a BitBull and a BitBear recently. I've also been incorrect recently when subjecting my opinion in either direction. Thus, I am going with my most objective BitPig analysis today and providing what appears to be the most likely scenario. Although it is ultimately Bearish, I am not a Bear in this case. Just BitPig with a BitDream is all.
BTC may shock everyone with a sudden reversal soon. The pattern that appears to be forming is a type of terminal fifth wave that ends with a horizontal triangle and subsequent retracement back to the Wave 2 line in red.
Should this happen, we might see a much heavier selloff thereafter.
I'm expecting a sunset, but if the horizontal triangle gets broken to the upside, we could be seeing a new sunrise instead.
-BitPig Rises, BitPig Sets
CME:BTC1!
BITBAY:BTCUSD
BITBAY:BTCUSDT
BITPANDAPRO:BTCEUR
CRYPTOCAP:TOTAL2


#BITCOIN 1 Trillion market cap ✅#BITCOIN 1 Trillion market cap ✅
(and yes, that small peak is 2017 lol)

#BITCOIN 1 Trillion market cap ✅#BITCOIN 1 Trillion market cap ✅
(and yes, that small peak is 2017 lol)


Gauge the crypto market sentiment (Institutional & Retail)Whale and institutional investors initiate the trend in the Crytpo market while retail investors help pushing that trend to its peak.
Of course, there are many more things to look out for, but you will be staying one step ahead of many ppl just by paying attention to these few things in my chart while avoid becoming bagholder yourself.


Nearby repeating pattern? Or a re-test and continue up?Looks like we have a repeating pattern here possibly, or a re-test before continuing up.
I've been learning about Camarilla charting (thank you Gunslinger) and have been trying to add those into my charts without over-powering my own charting. Still a work in progress.

BTC: Market Cap to Thermo Cap Ratio [Overall Bullish]Chart:
I saw an analysis' posted on twitter by Rafael Schultz-Kraft and Geert Jan Cap that puts us in the lower end of the bull cycle and felt I should share on here.
Last bull market $BTC was @ $8500 at the current Market cap:Thermo cap level
Price increased 135% to the top in a month
From the current price 135% is $110,000
To see a better chart of this go the Rafael's twitter to get the full view with current Market cap:Thermo cap data