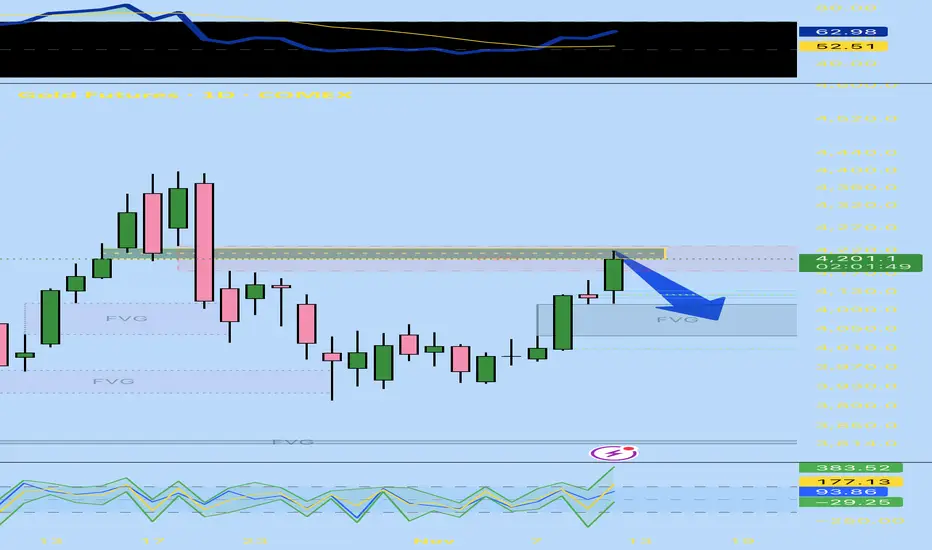
Caught between a Volume Imbalance and 2 FVGsI’m looking at the bullish volume imbalance that is overlapping a bearish fair value gap. Price just made a bullish run leaving a bullish fvg behind. I think we drop out of this fvg and vi and head back down towards the bullish fvg around 4050.
I’m guessing we go back to around 4050 over the next couple days.
Trade ideas
Gold bounce back into value (4217)Starting to come off the bottom of this manipulation phase into what could be the start of distribution. Next week, I think 4217 is very possible.

GOLD: The Daily and Weekly +FVGs Hold The Key! In this Weekly Market Forecast, we will analyze the Gold (XAUUSD) for the week of Nov. 17-21st.
Gold is still strong, but struggled to move higher last week. It is currently inside a bullish FVG, and this would be the key PD Array to watch. If the market shows respect to the +FVG, then expect higher prices. If it fails, and we see the market close below it on a daily close basis, buys should be avoided until the Weekly +FVG is reached.
Enjoy!
May profits be upon you.
Leave any questions or comments in the comment section.
I appreciate any feedback from my viewers!
Like and/or subscribe if you want more accurate analysis.
Thank you so much!
Disclaimer:
I do not provide personal investment advice and I am not a qualified licensed investment advisor.
All information found here, including any ideas, opinions, views, predictions, forecasts, commentaries, suggestions, expressed or implied herein, are for informational, entertainment or educational purposes only and should not be construed as personal investment advice. While the information provided is believed to be accurate, it may include errors or inaccuracies.
I will not and cannot be held liable for any actions you take as a result of anything you read here.
Conduct your own due diligence, or consult a licensed financial advisor or broker before making any and all investment decisions. Any investments, trades, speculations, or decisions made on the basis of any information found on this channel, expressed or implied herein, are committed at your own risk, financial or otherwise.

GOLD: Look For Bullish Breakout From The +FVGIn this Weekly Market Forecast, we will analyze the Gold (XAUUSD) for the week of Nov. 10-14th.
Gold has been consolidating in a +FVG since last week... and it is still holding! Wait for price to break the high of the consolidation and then look for long setups.
Be mindful that price may sweep the sell side LQ before it moves higher.
Enjoy!
May profits be upon you.
Leave any questions or comments in the comment section.
I appreciate any feedback from my viewers!
Like and/or subscribe if you want more accurate analysis.
Thank you so much!
Disclaimer:
I do not provide personal investment advice and I am not a qualified licensed investment advisor.
All information found here, including any ideas, opinions, views, predictions, forecasts, commentaries, suggestions, expressed or implied herein, are for informational, entertainment or educational purposes only and should not be construed as personal investment advice. While the information provided is believed to be accurate, it may include errors or inaccuracies.
I will not and cannot be held liable for any actions you take as a result of anything you read here.
Conduct your own due diligence, or consult a licensed financial advisor or broker before making any and all investment decisions. Any investments, trades, speculations, or decisions made on the basis of any information found on this channel, expressed or implied herein, are committed at your own risk, financial or otherwise.

Breakout Confirmed – Watching for 4H FVG RebalanceAfter a full week of sideways chop, Gold finally broke structure on Monday with a strong bullish impulse. The breakout clears the 7-day range and confirms higher-timeframe bullish intent.
I’m now watching the 4H FVG sitting just below the previous day’s low — that’s where I’d like to see price rebalance before continuing the next leg higher.
If price respects that zone and holds structure, it could mark the start of a sustained bullish push for the week.
Bias stays bullish unless price breaks back below the H4 FVG or fails to hold the weekly open.

Looking for the Sweep leading into a bigger Play! Price bled lower through the entire Asian session after yesterday’s late breakdown, continuing the move away from the prior value area. We’re now trading inside a cluster of intraday inefficiencies with clean liquidity sitting below at 4013 and the psychological 4000 level.
My focus going into London and NY is patience.
Asia’s slow descent is typically a continuation phase, not the actual entry. I want to see:
A sweep of 4013 or 4000
A clear displacement reaction
A retrace back into a fresh M5–M15 FVG
Then structure confirming continuation or reversal
Until that happens, this remains a bearish environment with untested Weekly imbalance still below. If buyers don’t defend 4013 with force, the algo will likely reach for the 4000 liquidity pocket next.
Staying reactive, not predictive.
London will reveal whether this breakdown continues or sets the trap for a reversal.

Waiting on the Sweep – ADP Should Provide the CatalystChoppy week so far with price distributing and grinding lower. Last week’s low still hasn’t been taken, so my macro target remains the same. I’m looking for ADP tomorrow during NY session to provide the volatility needed to run liquidity and complete that sweep.
Not predicting direction on the release itself — I’ll be waiting for a liquidity grab and displacement before considering an entry. If price runs stops above today’s Asia high or drives directly into last week’s low, I’ll be watching for the post-news retrace to an FVG/structural level to participate.
Patience here — the move is close, but confirmation > anticipation.

**“Friday Play: Watching GC for a potential continuation lowerAfter the 4240 liquidity clear. Today’s open (4174.9) is my decision point.
Two scenarios I’m stalking:
1️⃣ Break & retest below 4174 → downside continuation into the H4 bullish FVG (4060–4090).
2️⃣ Sweep above 4200–4215 → rejection → short from premium pricing.
Friday loves completing unfinished business — but only if orderflow confirms. Patience first.”**

Gold Week Opens Inside Daily FVG — Will We Drop Into the Weekly New week, and Gold opened inside last week’s Daily FVG, which was fully rebalanced.
No confirmation yet that this zone will act as support. The larger unmitigated Weekly FVG below may still be the draw on liquidity before any bullish move develops.
Plan for tonight:
Let Asia define the range
Watch for a sweep during London
Bearish continuation is favored if we break today’s open level (4174.9)
Bullish only if Asia low → sweep → displacement → retrace
Levels marked.
Patience. Let the algo show its hand.
#Futures #GC #Gold #FVG #ICT #SmartMoney #DayTrading #NOFOMO

GC UpdateWeird rally last week, looks like it's headed right back to 4k though.
Silver did a double top, so I think that's done.... which may put downward pressure on gold for the next month or so. There will probably be a rate cut in January though.

gold is on some weaker note gold forming some bearish pattern on resistance can see 2-3% fall in short term

MGC ShortShort Active Trade – MCZ (Sell)
📌 Entry: Market execution
🔴 Stop Loss (SL): 4134
🟢 Take Profit (TP): 4117
Discipline, patience, and precise execution…
We trade the iINVICTUS way.

Gold Testing H4 Supply – Eyes on Retrace SetupAfter a clean bullish expansion last week, Gold is now testing a 4H bearish FVG around 4,200–4,240. Price is currently holding below the day’s open (4,203), suggesting potential short-term weakness.
If we stay below 4,203, I’ll look for a corrective move toward the 4H bullish FVG just below the previous day’s low (around 4,060–4,090).
Above 4,220, the bullish continuation remains valid.
Currently in observation mode — waiting for intraday confirmation before engaging any short bias.

Regional Price Differences in the Global Trade Market1. Introduction to Regional Price Differences
Regional price differences refer to the variation in the price of the same or similar goods and services across different geographic regions or countries. In global trade, these disparities influence where goods are produced, how they are traded, and who benefits most from global value chains. For instance, the same smartphone might cost significantly more in Europe than in Asia due to differing taxes, import duties, and distribution costs.
While globalization and digitalization have helped narrow some price gaps, differences remain pronounced because local economic conditions, government regulations, and logistical constraints continue to vary widely.
2. Key Causes of Regional Price Differences
a. Production Costs and Input Availability
One of the most fundamental reasons behind regional price disparities is the difference in production costs. Labor wages, raw material availability, and energy costs differ from one region to another. For example, manufacturing costs in Southeast Asia are generally lower than in North America or Western Europe, primarily because of cheaper labor and more lenient regulatory frameworks. Consequently, products made in Asia often sell at lower prices, giving the region a competitive edge in global trade.
b. Exchange Rates and Currency Valuation
Currency fluctuations significantly impact pricing in international trade. A country with a strong currency will find its exports becoming more expensive for foreign buyers, while imports may become cheaper. Conversely, a country with a weaker currency can sell goods more competitively abroad. Exchange rate volatility, therefore, introduces continuous adjustments in trade pricing across regions.
c. Trade Policies and Tariffs
Governments impose import tariffs, export duties, and non-tariff barriers to protect domestic industries. These policies alter price structures across borders. For example, U.S. tariffs on Chinese goods during the trade tensions of 2018–2020 increased prices for certain products in American markets. Similarly, the European Union’s agricultural subsidies have led to lower food prices in Europe compared to regions where farmers receive little or no government support.
d. Transportation and Logistics Costs
Geographical distance and infrastructure quality play a vital role in determining final prices. Shipping costs, fuel prices, and port handling fees vary widely between regions. Landlocked countries, such as those in Central Africa, often face higher import prices due to their reliance on overland transportation. In contrast, coastal nations with advanced port facilities, like Singapore or the Netherlands, enjoy lower trade costs and more competitive pricing.
e. Taxation and Regulatory Differences
Value-added tax (VAT), sales tax, and environmental levies contribute to price differences. Developed countries often impose higher consumption taxes, making goods more expensive than in emerging markets. Additionally, stricter quality or safety regulations in some regions may require costly compliance, raising production and retail prices.
f. Market Demand and Purchasing Power
Regional consumer behavior and purchasing power also determine pricing strategies. Companies adjust their prices based on what consumers can afford and are willing to pay. For instance, global fast-food chains often sell products at lower prices in India or Indonesia compared to the U.S. or Japan, aligning with local income levels.
3. Economic Theories Explaining Price Differences
Two key economic theories help explain regional price disparities:
a. The Law of One Price (LOOP)
This theory suggests that in efficient markets without trade barriers or transportation costs, identical goods should have the same price globally when expressed in a common currency. However, real-world frictions — like shipping expenses, tariffs, and local taxes — often violate this law, leading to price differences.
b. Purchasing Power Parity (PPP)
PPP adjusts for differences in price levels between countries, asserting that exchange rates should equalize the purchasing power of different currencies. Yet, deviations from PPP are common due to local factors like government intervention, monopolistic pricing, and varied cost structures.
4. Regional Case Studies
a. Asia: The Manufacturing Hub
Asia, especially China, India, Vietnam, and Indonesia, is known for its low-cost manufacturing advantage. The region benefits from cheaper labor, favorable trade agreements, and strong production ecosystems. As a result, products made in Asia — such as electronics, textiles, and machinery — often cost less than similar items made in Europe or the United States. This price advantage has turned Asia into the world’s factory, though rising labor costs in China are gradually narrowing the gap.
b. Europe: High Standards and High Prices
European markets tend to have higher consumer prices due to stringent labor laws, environmental regulations, and value-added taxes. Additionally, many European countries prioritize sustainable production and quality assurance, which increase costs. However, consumers in Europe are generally willing to pay a premium for quality, ethical sourcing, and environmental responsibility.
c. North America: Market Efficiency and Brand Premiums
The U.S. and Canada enjoy advanced infrastructure and technological efficiency, which can reduce costs in some sectors. However, strong brand influence and higher wage levels often lead to elevated retail prices. Moreover, the U.S. dollar’s global dominance sometimes results in price discrepancies when converted into weaker currencies.
d. Africa and Latin America: Infrastructure and Import Dependency
Many countries in Africa and Latin America face higher prices due to weak infrastructure, high import dependency, and limited manufacturing bases. Import tariffs, long shipping routes, and unstable exchange rates further raise costs. For instance, consumer electronics or cars may cost 30–50% more in these regions than in Asia or North America.
5. Implications for Global Trade
a. Competitive Advantages and Trade Patterns
Regions with lower production costs attract multinational corporations seeking efficiency and profitability. This leads to industrial clustering — such as textile hubs in Bangladesh or electronics hubs in Taiwan. However, this concentration can also cause over-dependence and trade imbalances.
b. Consumer Access and Inequality
Price differences can contribute to global inequality. Consumers in poorer nations often pay higher prices for imported goods relative to their income, limiting access to essential products. Meanwhile, consumers in wealthier nations enjoy broader choices at competitive prices due to efficient supply chains.
c. Supply Chain Strategies
Businesses use regional price data to optimize their supply chains, choosing where to source materials and where to sell products for maximum profit. The rise of digital platforms and data analytics allows companies to monitor regional trends and adjust prices dynamically.
d. Inflation Transmission
Regional price differences can also transmit inflation across borders. For example, if energy prices rise in the Middle East, importing regions like Europe and Asia experience higher fuel and transportation costs, which ripple across global supply chains.
6. Technological and Policy Developments Reducing Price Gaps
Digitalization, automation, and free trade agreements are helping reduce some regional price disparities. E-commerce platforms allow consumers to compare global prices instantly, pressuring sellers to maintain competitiveness. Additionally, trade liberalization efforts under organizations like the World Trade Organization (WTO) aim to minimize tariffs and improve market access.
However, geopolitical tensions, such as the U.S.–China trade war or Brexit, can reverse progress by introducing new trade barriers and regulatory costs, widening price gaps once again.
7. Conclusion
Regional price differences are an inevitable and integral part of the global trade system. They reflect each region’s unique combination of resources, policies, consumer preferences, and economic maturity. While globalization, technology, and policy harmonization have narrowed some disparities, complete price uniformity remains unrealistic due to local economic realities and geopolitical diversity.
For businesses and policymakers, understanding these differences is not just an academic exercise — it is a strategic necessity. It influences where companies invest, how governments design trade agreements, and how consumers experience global markets. In the end, managing regional price differences effectively is key to ensuring balanced growth, fair competition, and sustainable globalization.

XAUUSD UPDATE : BREACH 4149.78hi again
Market Analysis
From the previous chart, the price successfully broke above 4149.78. At the current level, the next resistance is identified at 4279.23, while key support is around 4124.81.
Trade Plan
Sell Setup:
Look for rejection at 4279.23 combined with bearish price action confirmation at that resistance level.
Buy Setup:
Look for rejection at 4124.81 combined with bullish price action confirmation at that support level
good luck all
**My trading strategy is not intended to be a signal. It's a process of learning about market structure and sharpening my trading my skills also for my trade journal**
Thanks a lot for your support

Long trade
📘 Trade Journal Entry — Micro Gold Futures (MGC1!)
Date: 12th Oct 25
Time: 12:00 PM
Session: LDN → NY AM
Direction: Buyside Trade
Timeframe: 1H
🔹 Trade Details
Entry: 3978.8
TP: 4290 (+8.06%)
SL: 3924.9 (–1.31%)
RR: 6.15
📌 Technical Narrative
Price formed a macro liquidity sweep, followed by CHOCH and BOS confirming a bullish reversal. A clean inducement below the 4050 zone fueled displacement upward through multiple FVGs, each of which held as re-entry zones. The trade was taken from a discount retracement aligned with the 0.382 and 0.61 fib levels, supported by stacked FVGs and KAMA MA trend alignment.
🔹Model: FVG → Inducement → BOS → Re-entry
Liquidity swept - Price immediately shifted into displacement
Accumulation & Inducement Zone - Between Oct 28 → Nov 5, price carved:
Slow accumulation structure
Multiple small FVGs (stacked)
A clean inducement low at 4050-zone
Equal lows resting near 4084 PD-array
Displacement Leg (Current Move Up) Price breaks:
BOS @ 4148.7 and holds above: 0.382 retracement @ 4140
0.618 retracement @ 4229.
Multiple micro FVGs (confirmed by fills)
📌Market Sentiment Narrative
Gold currently trades in an environment of: Fed dovish shift, Geopolitical uncertainty
Commodity demand rotational flows, Liquidity flight from risk-on assets. This supports a buyside continuation toward HTF premium zones.

goldI'm just like everyone else—I think we are going up :) W pattern for the win —could I elaborate? Yeah, but I want a few more wins under my belt

Gold Confirmed Bullish BiasFenzoFx—Gold is bullish again, confirmed by engulfing above the $4,175.00 resistance. As of this writing, XAU/USD trades inside the bearish fair value gap, testing the $4,230.00 resistance.
Last day, Gold did not dip below $4,103.00 (the bullish FVG) for liquidity. This indicates a strong bullish market. However, going long at the current price is risky because the price has surged already. The ideal level for joining the bull market would be around $4,146.00, which is in conjunction with daily highs and the October 23 and 24 close. This area should provide decent support for Gold.
In the bullish scenario, we expect Gold to form a double top at all-time highs by targeting $4,398.00.

How a Single Put Spread Predicted Gold’s BreakdownSo, gold has broken below the previous bearish zone — meaning we now have a bearish sentiment in play (at least according to my classification).
Now, regarding options flow:
On the chart, I’ve highlighted those lucky (or rather, well-informed) players who entered with a Put Spread — just before the correction started.
Perfect timing.
Their ideal target?
$3,950 — to be reached within 8 days, right around expiry.
Or at least close enough for maximum profit.
p.s. Just to be clear:
We are not teaching options trading as such — even though much of my methodology is built on options market data.
What we are doing is showing you how to read the option sentiment and use that insight to trade more effectively on the markets you already know — like spot Forex.
It’s about understanding why price moves — before it does.
We believe that trading without using options sentiment analysis is similar to fishing with a fishing rod🤦🏻♂️ on the shore while your neighbor has arrived at the river with a sonar on a boat.
We are on that boat, and we want to help you make better trading decision.💰

GOLD (XAU) Outlook - Prediction (12 NOV)GOLD (XAU) Outlook - Prediction
📊 Market Sentiment
Market sentiment for GOLD remains strongly bullish, primarily driven by central bank accumulation. Since 2023, global central banks led by China have been purchasing gold aggressively, creating a durable demand base. With the FED preparing to initiate QE while inflation remains elevated, I think risk assets like GOLD could outperform as the USD (DXY) weakens. This macro setup continues to support a long term bullish narrative.
📈 Technical Analysis
Price has been retracing since October 20, which I think was a healthy correction following a strong expansion. As mentioned in my previous GOLD outlook, price appeared to be retesting the Weekly Value Gap and accumulating within that zone. In my opinion, this accumulation phase seems to have ended, and the market looks ready to continue higher.
📌 Game Plan - Prediction
Price has broken out of the accumulation zone and started expanding upward. I plan to enter after a retest near the key zone around $4060. It may dip toward $4027, which I consider a discount zone. I intend to scale in between $4060 and $3950, with invalidation if the daily candle closes below $3900.
💬 Follow my Substack profile for detailed insights and extended analysis.
⚠️ Disclaimer: For educational purposes only. This is not financial advice.


Gold hold this trendline and we see a move upwards.If gold can hold this trendline at $4000 we could see a move up, wait for the daily open.

Gold sellsWe have a strong resistance we’ve been holding at. Price failed two attempts up on the daily and two attempts on the 12-hour chart, with multiple 312 setups to the downside also ready to trigger. looking to target the 4hr unmitigated OB. this move will happen over next week hopefully the beginning of the week as I feel we are ready for a drop
