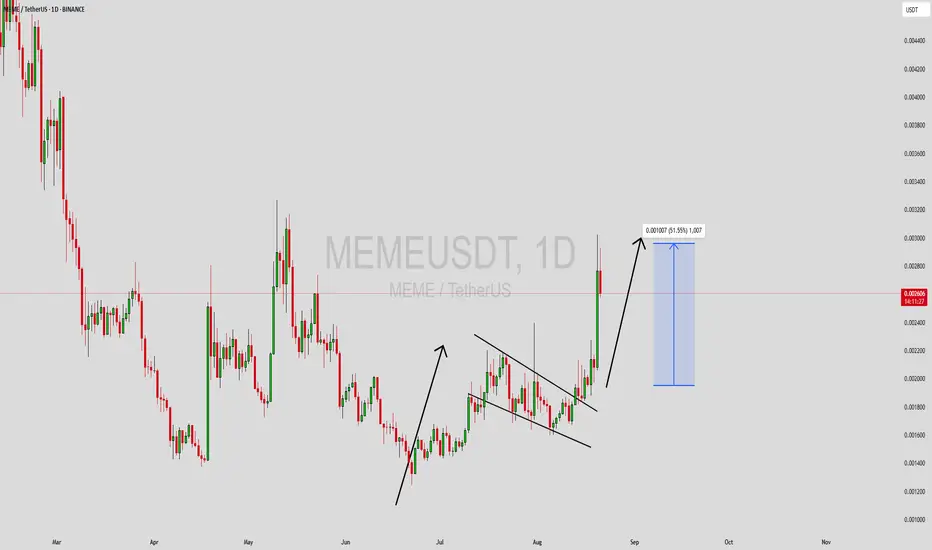
Long MEMEMEME has returned to its consolidation range and is currently bouncing off the range low.
LONG setup is as in chart.
Disclaimer:
This analysis is based on my personnal views and is not a financial advice. Risk is under your control.

#MEME/USDT#MEME
The price is moving within a descending channel on the 1-hour frame and is expected to break and continue upward.
We have a trend to stabilize above the 100 moving average once again.
We have a downtrend on the RSI indicator that supports the upward break.
We have a support area at the low

#MEME/USDT#MEME
The price is moving in a descending channel on the 1-hour frame and is adhering to it well and is heading to break it strongly upwards and retest it
We have a bounce from the lower limit of the descending channel, this support is at a price of 0.00284
We have a downtrend on the RSI indicato

MEMEUSD LONGMEMEUSD crossed 200EMA on daily. It can fail, but where to? lower? Considering that BTC % is dropping to hell, alts suppose to pump, lets see the pump.


MEME Main trend -97% Channel. Reversal or scam zone.Logarithm. Time frame 3 days (less is not needed).
🟡 The price has reached a decline from the highs (not a listing squeeze) -97%. These are practically the maximums of declines after the hype for cryptocurrencies of such liquidity (96-98), after which there is only a complete scam. At the moment, t

15% for MEME soonMEME is showing strength as market is bullish, I am expecting continuation with 15% minimum gain tomorrow.
NOT A FINANCIAL ADVICE
MANAGE YOUR RISK AND ALWAYS USE STOPLOSS

MEMEUSDT Forming Falling ChannelMEMEUSDT has recently broken out from a falling channel pattern, a structure that typically signals a bullish continuation. This breakout is backed by rising trading volume, which further validates the strength behind the move. As the price pushes above the channel resistance, the projected upside s
MEMEUSDT is BullishPrice was in a strong downtrend, however double bottom reversal pattern coupled with bullish divergence on weekly time frame hints the return of bulls. If last lower high is broken with good volume then we can expect a bullish reversal as per Dow theory. Targets are mentioned on the chart.

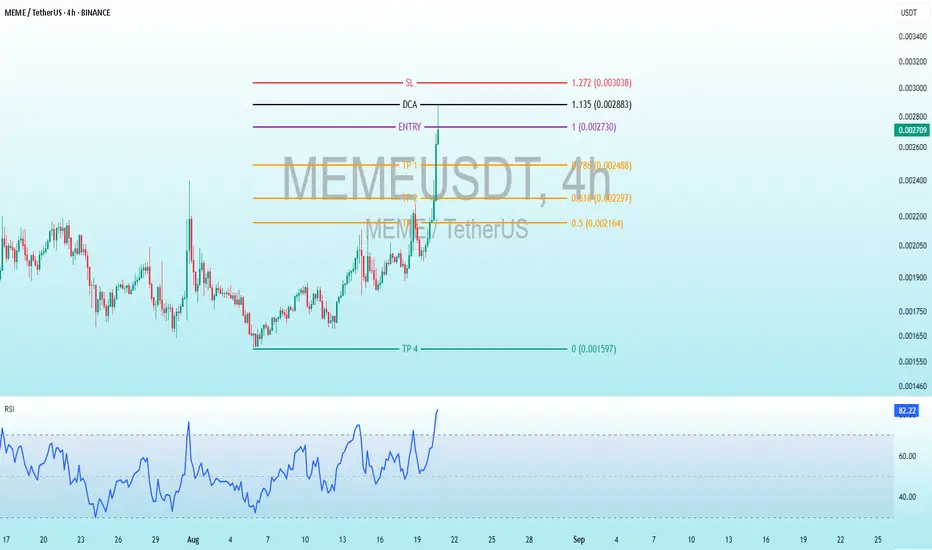
$MEME 4H Analysis: Breakout Potential with RSI Overbought BINANCE:MEMEUSDT
Price Levels and Key Zones:
Entry: 1.00 (0.002730 USDT) - Identified as a potential entry point for a trade.
DCA (Dollar Cost Averaging): 1.135 (0.002883 USDT) - A level for averaging the cost if the price drops.
SL (Stop Loss): 1.272 (0.003036 USDT) - A stop-loss level to protec
See all ideas
Summarizing what the indicators are suggesting.
Oscillators
Neutral
SellBuy
Strong sellStrong buy
Strong sellSellNeutralBuyStrong buy
Oscillators
Neutral
SellBuy
Strong sellStrong buy
Strong sellSellNeutralBuyStrong buy
Summary
Neutral
SellBuy
Strong sellStrong buy
Strong sellSellNeutralBuyStrong buy
Summary
Neutral
SellBuy
Strong sellStrong buy
Strong sellSellNeutralBuyStrong buy
Summary
Neutral
SellBuy
Strong sellStrong buy
Strong sellSellNeutralBuyStrong buy
Moving Averages
Neutral
SellBuy
Strong sellStrong buy
Strong sellSellNeutralBuyStrong buy
Moving Averages
Neutral
SellBuy
Strong sellStrong buy
Strong sellSellNeutralBuyStrong buy
Displays a symbol's price movements over previous years to identify recurring trends.