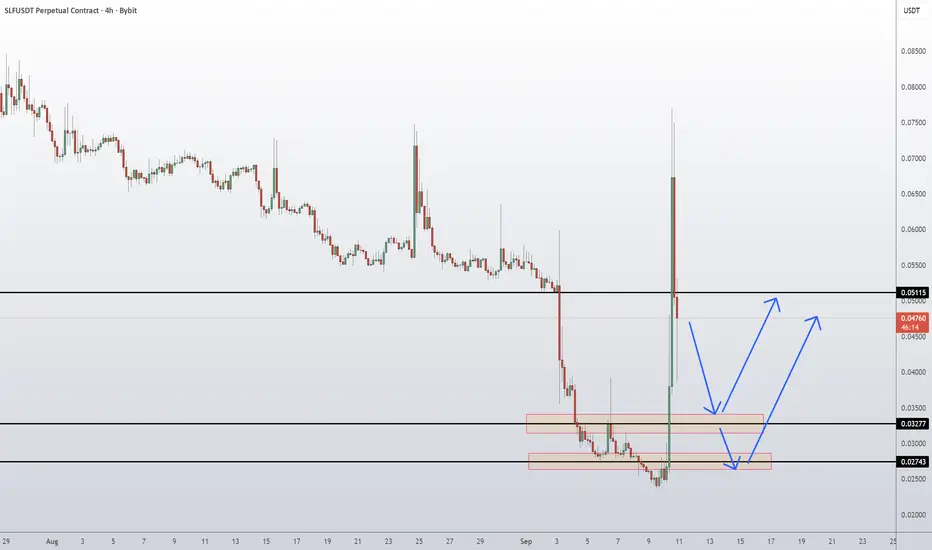
SLF Coin SelfChain Token Price Prediction and Technical AnalysisSLF/USDT has been in a steady downtrend but recently showed a strong spike from the 0.0274 demand zone, reclaiming short-term momentum. Price is now hovering below the 0.0511 resistance, where sellers have re-entered. If bulls manage to hold higher lows above 0.0327 support, another push toward 0.05
SLFUSDT Forming Falling WedgeSLFUSDT is currently exhibiting a classic falling wedge pattern, a bullish formation that typically signals a potential trend reversal. The narrowing of the wedge, combined with consistent price compression and higher lows, indicates that sellers are losing control while buyers begin to step in. Thi
FLS (SPOT)BINANCE:SLFUSDT
#SLF/ USDT
Entry (0.080 - 0.088)
SL 4H close below 0.0756
T1 0.100
T2 0.120
T3 0.147
Extra Target
T4 0.165
_______________________________________________________
Golden Advices.
********************
* collect the coin slowly in the entry range.
* Please calculate your losses

SLFUSDT Forming Falling WedgeSLFUSDT is showing an impressive technical setup that’s catching the attention of traders and investors alike. The crypto pair has formed a clear falling wedge pattern, which is known to be a bullish reversal pattern in technical analysis. This suggests that a breakout to the upside could be imminen

Bullish Divergence SpottedPrice made a lower low, but RSI formed a higher low, signaling weakening bearish momentum. This could indicate a potential reversal or relief bounce.
Always confirm with volume and price action before entering trades. Manage risk, as false breakouts can occur.
What’s your take? Bounce or breakdown

Technical analysis of $SLF asset: growth prospectsAt the moment SLF asset demonstrates quite promising dynamics, which is confirmed by a number of technical signals. Price trading in the green range (the area of positive dynamics) indicates stable demand and confidence of market participants in the growth potential of the asset.
One of the key fac

SLF BINANCE:SLFUSDT
SLF / USDT
4H time frame
analysis tools
____________
SMC
FVG
Trend lines
Fibonacci
Support & resistance
MACD Cross
EMA Cross
______________________________________________________________
Golden Advices.
********************
* Please calculate your losses before any entry.

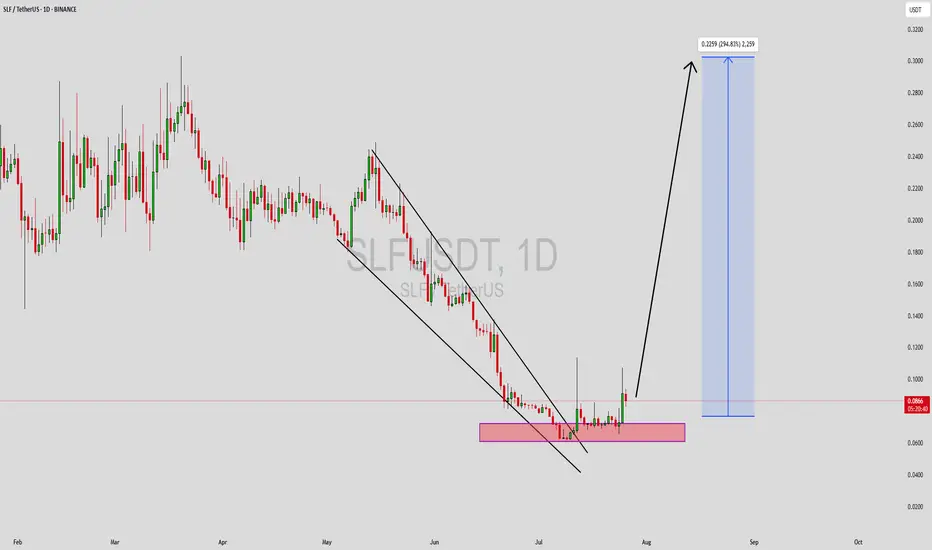
SLF/USDT- BUY SETUP BINANCE:SLFUSDT
✔︎ENTRY : 0.3258 TO 0.3148
🏓TARGETS :
✔︎T1 : 0.3685
✔︎T2 : 0.4311
✔︎T3 : 0.5248
✘STOP : 0.2811
💡Reason for this trade:
This trade gives my trading system a sign of strength:
• My trading system is based on liquidity and reversal zones.
• When the liquidity is swept from one s

SLFUSDT: %500 VOLUME SPIKE | HUGE OPPORTUNITYSLFUSDT has experienced a 500% daily volume increase, indicating heightened interest. However, the price is declining rapidly, and buyers have not yet shown significant activity.
🔵 Demand Zones: The blue boxes on the chart represent potential areas for a price reaction.
📊 Entry Strategy: Monitor f

Slf/UsdtBINANCE:SLFUSDT
**Current Price**: **$0.4442** 📉
**Resistance Area**: **$0.5600** 🔴 (Price has been rejected from this area, so it's a key resistance level to watch)
---
**Key Support Areas**:
- **First Support**: **$0.3800** 🟢 (This is the level to watch for a potential bounce 🚀)
- If

See all ideas
Summarizing what the indicators are suggesting.
Oscillators
Neutral
SellBuy
Strong sellStrong buy
Strong sellSellNeutralBuyStrong buy
Oscillators
Neutral
SellBuy
Strong sellStrong buy
Strong sellSellNeutralBuyStrong buy
Summary
Neutral
SellBuy
Strong sellStrong buy
Strong sellSellNeutralBuyStrong buy
Summary
Neutral
SellBuy
Strong sellStrong buy
Strong sellSellNeutralBuyStrong buy
Summary
Neutral
SellBuy
Strong sellStrong buy
Strong sellSellNeutralBuyStrong buy
Moving Averages
Neutral
SellBuy
Strong sellStrong buy
Strong sellSellNeutralBuyStrong buy
Moving Averages
Neutral
SellBuy
Strong sellStrong buy
Strong sellSellNeutralBuyStrong buy
Displays a symbol's price movements over previous years to identify recurring trends.