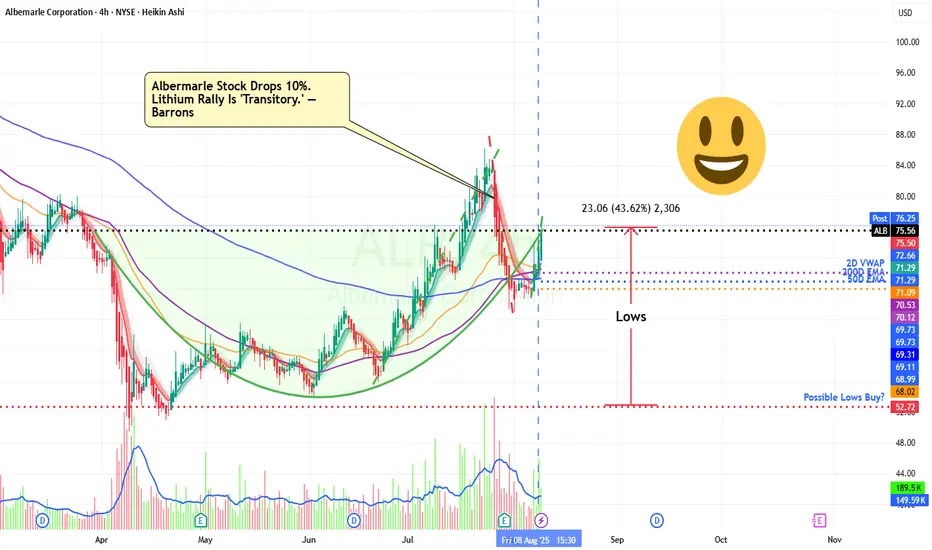
Lithium Potential bottom Seen.Lithium is at almost all time lows and due to a rebound in AI Demand could expect a new surge soon.
1ALB trade ideas
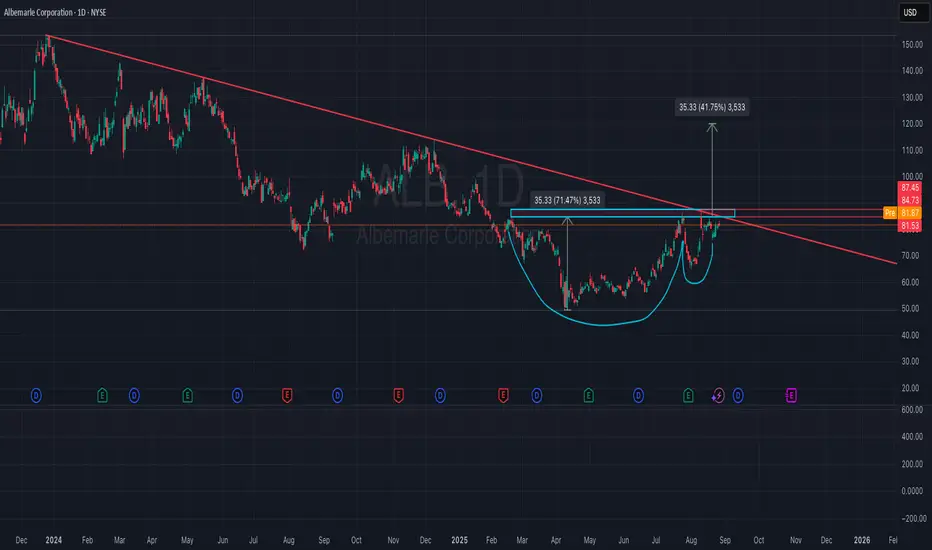
Cup and Handle Breakout – ALB (Albemarle Corporation)ALB is showing a cup and handle formation on the daily chart. Price is now testing the $84–$87 resistance zone which aligns with the long-term descending trendline.
A confirmed breakout above this level could trigger a bullish continuation, with a measured move target near $115 (+41%).
📈 Entry: On breakout and daily close above $87
🎯 Target: $115
🔻 Invalidation: Below $75 (handle low)
This setup suggests strong bullish potential if resistance is cleared with volume.
Not financial advice. No responsibility for any actions taken.
ALB Technical Outlook – Symmetrical Triangle at Key Inflection⚡ ALB Technical Outlook – Symmetrical Triangle at Key Inflection
Ticker: ALB (Albemarle Corp.)
Timeframe: 30-minute candles
🔍 Current Setup
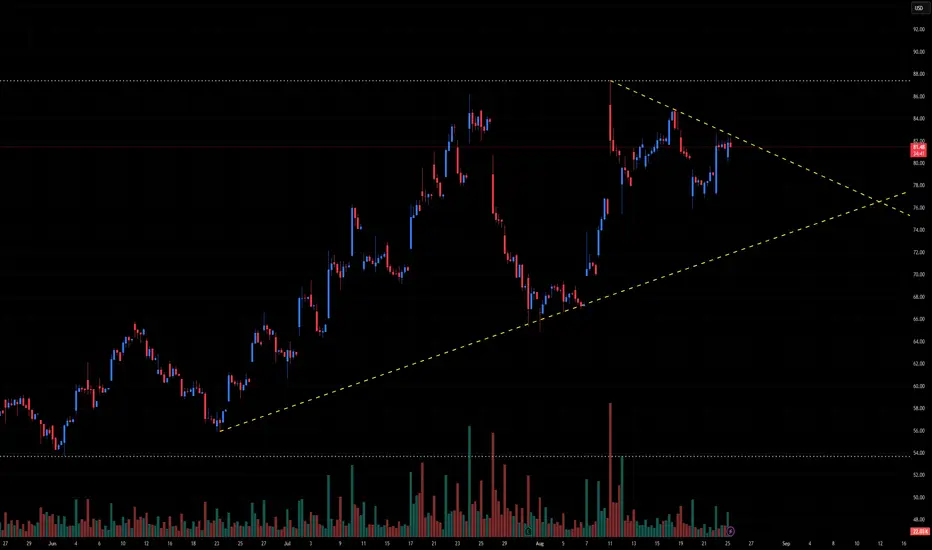
ALB has been in a long-term uptrend, holding an ascending support trendline since late June. After peaking near ~87, price has pulled back and is now consolidating within a symmetrical triangle.
Descending resistance: ~84–85.
Ascending support: ~76–77.
Current price: ~81.40, sitting inside the triangle and nearing the apex.
This structure reflects compression — energy building for a decisive breakout.
📊 Breakout Levels
🚀 Upside (Bullish Scenario)
Trigger: Break and close above 85.
Intermediate Targets:
87–88 → Prior swing high.
90+ → Psychological round number.
Measured Move Target: ~92–94 (triangle height projection).
🔻 Downside (Bearish Scenario)
Trigger: Break below 77, confirmation under 76.
Intermediate Supports:
74–73 → First demand zone.
70–68 → Stronger support.
Measured Move Target: ~67 (triangle height projection downward).
📈 Volume Analysis
Volume has been declining during the triangle formation — normal for consolidation.
Expect a sharp volume expansion once price escapes the triangle.
⚖️ Probability Bias
The broader trend has been upward, which slightly favors a bullish continuation if resistance at 85 is cleared.
However, a failure below 76–77 would invalidate the bullish structure and trigger a breakdown.
✅ Takeaway
ALB is at a critical decision point within a symmetrical triangle:
Bullish Break > 85: Targets 88 → 90 → 92–94
Bearish Break < 76–77: Targets 74 → 70 → 67
The breakout direction — confirmed by volume — will likely define ALB’s next major move.
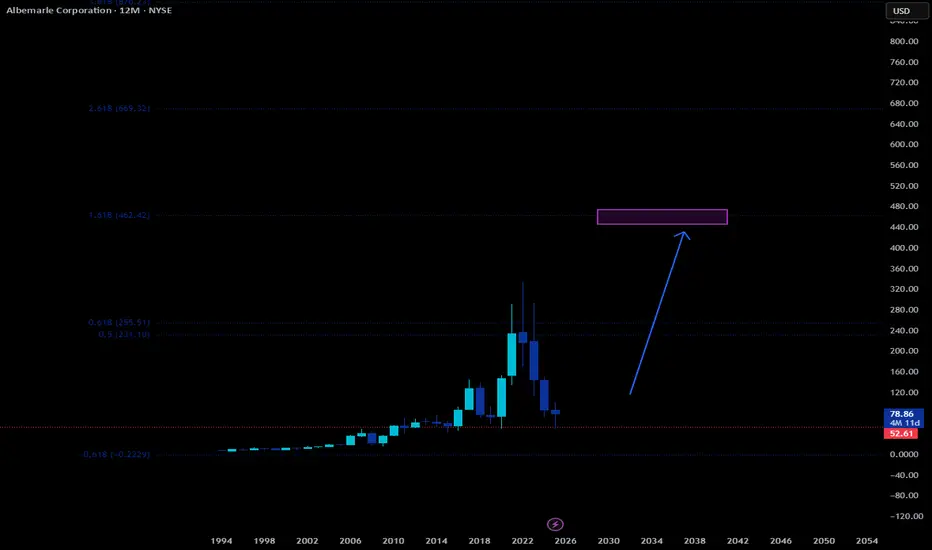
ALB. LONG.Pulled projections off yearly move. We have massive targets higher. I can see it go much higher. Entry is under $80. Will never sell unless we hit the profit target.
The fib pulls are my own proprietary fib pulls.
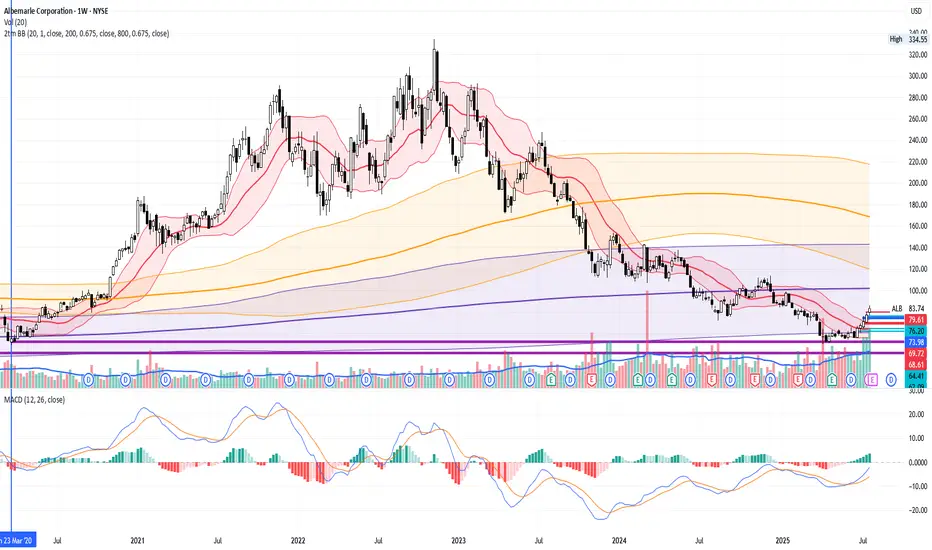
ALB Long, Resurrection of lithium trendALB have started to rise in recent weeks. It's price stays near 5-year lows.
Long-term Price Levels already have worked to bounce the stock by around 50%+.
Most likely funds have started to trade it in Mean Reversion strategies. So, the movement back to 200MA and 800MA on Weekly time-frame is quite possible.
As fast as banks would start to rise stock's rating - it will go sky high.
Recently UBS already cut it's rating to "Sell". Yet, trend already is mighty enough and just kept going higher.
Full margin on every black 1D candle!
Correction over? Worth keeping an eye on itIs this the end of the final 5th wave? It’s hard to tell. This stock has been a disaster for those trying to pick bottoms. I’m waiting for a sign of strength before jumping in. We may be seeing that as the RSI is slowly gaining strength.
Personally I’d like to see it change market structure and take out some resistance levels to the upside.
Keeping an eye on this before I pull the trigger.

ALB | Price PredictionNYSE:ALB is one of my key assets in the stock portfolio. I believe that the price of this stock is highly related to the resource price and cycles. I expect massive upside because of the potential rise in lithium demand. Moreover, new EVs, robots, drones, and next-gen gadgets all need lithium.
Price Prediction is based on my platform, so I'm sharing it here. I believe that the key levels are "Base" and "Bullish".

ALB DCA Opportunitywe are at another significant level from which demand can push the price of this stock up. Our targets are the next two significant supply levels. This is a high return yielding opportunity. Stay ahead of the curve and good luck

Potential Short-Term Rebound for ALB StockALB stock seems to have reached a support around $50. The recent sharp decline has created a setup for a short-term rebound toward the $65-$70 range.

Most likely to bounce towards 75This may have reached its bottom for now (or more room to go down towards low 40s)... most likely it should bounce to $75 and then collapse to lows. This could go sideways for years with small ups and downs in between.

$Albemarle Harmonic Pattern and Short stock infoLooking at the daily chart for Albemarle, it appears to be to have a short sale harmonic pattern. The second pattern finished up today's trading with dramatic fashion. I'm looking for the same rebound to the $110 area in the next few weeks.
First go at publishing an idea!

$ALB suggesting potential undervaluation.Albemarle Corporation (NYSE: ALB) is a leading global producer of lithium, a critical component in electric vehicle (EV) batteries. The company's performance is closely tied to lithium market dynamics, which have experienced significant fluctuations recently.
Technical Analysis:
As of February 15, 2025, ALB's stock price stands at $81.21. The stock has faced a downward trend, with a 52-week price change of -30.95%. The 50-day moving average is $93.35, and the 200-day moving average is $98.91, indicating a bearish trend. The Relative Strength Index (RSI) is at 30.29, suggesting the stock is approaching oversold territory.
STOCKANALYSIS.COM
Resistance levels are identified at $111.30, with support around $85.23.
Fundamental Analysis:
Albemarle's recent financial performance reflects challenges in the lithium market. In Q4 2024, the company reported a profit of $33.6 million, a significant turnaround from a loss of $617.7 million in the same period the previous year. However, adjusted results showed a loss of $1.09 per share, missing analyst expectations of a $0.70 loss. This underperformance is largely due to a substantial drop in lithium prices, leading to a $1.1 billion revenue decline in the Energy Storage division.
In response to market conditions, Albemarle has implemented cost-cutting measures, including workforce reductions and the suspension of expansion projects, such as a key U.S. lithium refinery. Capital expenditures for 2025 are projected to be $700-$800 million, approximately half of the previous year's budget.
Analysts have adjusted their outlooks accordingly. UBS Group recently lowered its price target for ALB from $99.00 to $86.00, maintaining a 'Neutral' rating.
Despite these challenges, the intrinsic value of ALB stock is estimated at $173.10 under a base case scenario, suggesting potential undervaluation.
Investment Considerations:
Given the provided trading parameters:
Target Price: $92.75
Profit Potential: 14.2%
Stop/Trailing Stop: $77.14
Potential Loss: 5%
Profit/Loss Ratio: 2.8:1
These parameters indicate a favorable risk-reward ratio. However, investors should remain cautious due to the volatile lithium market and Albemarle's recent financial adjustments. Monitoring lithium price trends and Albemarle's strategic responses will be crucial in assessing the viability of this investment.

BUY ALB!!!!Significant demand zone reached with the expectation that the overall bullish trend should continue with us setting higher highs.

lithium is going higher notable bottoming formation for this stock on the weekly chart, with clear RSI divergence signaling accumulation
in case price managed to break above 110, expect a move higher to 180$

Brace for Impact? Critical support line being heldCould this be the final leg down, Wave 5 capitulation? I'm watching this closely, the only think holding is up now is a long term trendline. The chart is very nice, a massive 5 wave supercycle which has peaked. We have been in a long bear market and there is no clear catalyst to suggest that a recovery is on the horizon.
Lithium prices have tanked and ALB is sitting on a lot of supply due to overproduction. The Chinese demand for lithium is strong but North America and Europe remain weak.
If we fall out of this wedge pattern and lose the current price, we could easily tumble down to $71 to retest support. If we do get down to that level I expect capitulation down to $63 which is the NPOC.
Keeping an eye on this, i'm not shorting but also not buying.

Albemarle Stock Quote | Chart & Forecast SummaryKey Indicators On Trade Set Up In General
1. Push Set Up
2. Range Set up
3. Break & Retest Set Up
Notes On Session
# Albemarle Stock Quote
- Double Formation
* 146.00 USD | Completed Survey
* 012345 | Wave Count Entry Bias | Subdivision 1
- Triple Formation
* ((Pennant Structure)) | Downtrend Continuation | Subdivision 2
* Numbered Retracement | Short Set Up | Subdivision 3
* Daily Time Frame | Trend Settings Condition
Active Sessions On Relevant Range & Elemented Probabilities;
European Session(Upwards) - US-Session(Downwards) - Asian Session(Ranging)
Conclusion | Trade Plan Execution & Risk Management On Demand;
Overall Consensus | Sell

ALB : very high risk reward - solid stock fundamentally- BUY !ALB is a great stock
US Lithium Producer
Just broken off the trend line .
Risk : 20 $ from current prices( around 80 $ stop loss levels)
reward :20 times of risk at 400 $
Time frame : 2 years or 2026

ALB - Fibonacci extensions add confidence that bottom is inFibonacci extensions add confidence that bottom is in.

alb inverted head and shouldersIH&S ALSO with a double bottom. NICE Gap today on the weekly. Decent bounce off of the 200 sma on monthly. Company does pay a dividend. Buy low, sell high opportunity?! :-)
I am in

ALB LongALB Long
Double bottom + retest, trendline break + retest
Entry 101.5
Stop 90
Target 135, 150
Risk management is much more important than a good entry point.
I am not a PRO trader.
In my trading plan, the Max Risk of each short term trade should be less than 1% of an account.

ALB breakoutALB above $112 could see some legs.
It's trading in a key area and also in a fib zone where the top is at $112. Ascending triangle the past few days shows it's picking up some pressure to break out to the upside.

Robert Shiller Would Be ProudAlbemarle has finally started to show some signs of life over the last few months - up over 50% since August, when its CAPE ratio was at its lowest level since the Global Financial Crisis.
The last three times the Shiller PE was this low, the stock saw returns of not percentages, but multiples over the next few years.

ALB: Strong technical signals suggest upward momentum aheadALB is showing signs of an upward shift, holding above the 200-day moving average, breaking a long-term trendline, and forming a reversal pattern. The upside potential points to a range between 250 and 300, while the downside risk is estimated at 80 to 90.
Last quarter, the stock rebounded from a low of 72, which aligns with a long-term trendline. If ALB stays above the 100 mark, the upward trend is likely to continue.
Albemarle (ALB) shows promise due to increasing lithium demand driven by electric vehicles, cost-saving measures, and operational efficiency improvements. However, challenges include softer lithium prices leading to reduced earnings raising concerns about short-term performance.
