Trade ideas
DDOG starting to retrace Similar to PTON, DDOG is coming off the 200 day MA. It is also on an uptrend so I would play the short side close/quick. I like the $88ps for this week if we can get some momentum downward.


Clear RSI divergence on the 4h DDOG LONG ENTRYRSI divergence shows support has reached + Trend reversal confirmation.
Target 1: 100$
Target 2: 110$ (resistance)
Target 3: 120$ (strong resistance)

Dead Cat Bounce on DDOGDouble top on DDOG is playing out.
Recent bounce failed to reclaim the lower support levels. And with tech / growth dying across the board, I am not expecting any macro force to save doggo here.

DDOG looking weakLooking pretty weak, chart reminds me of PTON. I'm not really seeing signs of a reversal yet so I'll be looking for a slight run-up for an entry short. Around Friday's high will be where I'll be looking for potential entry.

DDOG Analysis $DDOG | #Analysis | #StockMarket
Price Target 102.58 🎯
3 Inside Up ✅
Inverse Head & Shoulders ✅
Break above Golden Zone with Strong Momentum ✅
Higher Low being Made with Bullish Hidden Divergence ✅
Trend Line Confluence from March 2020 Lows ✅
Entry on Break of 92.07 with Confirmation ✅
Invalidated below 82.24 ❌


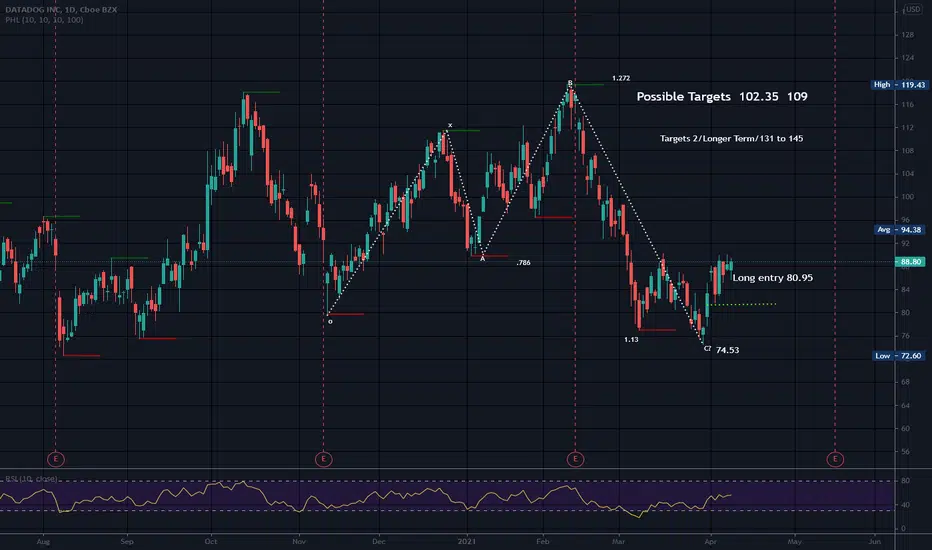
Cypher Pattern Verses the Shark PatternDDOG appears to be trading in a bullish shark pattern and D is the target. It is labeled O, X, A, B, C verses X, A, B, C, D like other harmonic patterns. I am not sure why the Shark is labeled differently than the other harmonic patterns, but maybe to differentiate it from the Cypher pattern as they are similar.
As with other harmonic patterns, the Shark pattern exhibits Fibonacci relationships within its structure. Shark pattern is a five point formation with four primary legs. The shark is often confused with the Cypher pattern as both have a second peak that is above the first peak. In theory, the Cypher's final leg (CD) pulls back only to the 0.786 of XA (1st leg). The Cyper is labeled XABCD verses OXABC like the shark (confusing) The final leg(BC) of a shark pulls back to the .886 or to the 1.13 fib level of OX (1st leg).
The cypher, in theory, can only have it's AB leg (2nd leg) retrace 38 to 61% of it's first leg (impulse leg). The shark pattern has no designated area of retracement (that I know of) by the 2nd leg except it can not go deeper than point O.
The second leg is where you can start eliminaing other harmonic patterns. The third leg is where you can eliminate even more. IE, if the 3rd leg's peak is lower than the first peak in the pattern, you are not looking at a cypher pattern or a shark pattern. This is for bullish harmonic patterns only as there are also bearish versions of these patterns. It seems possible that in some cases (not all), the shark and the cypher could really not be totally differentiated until the Potential Reversal Zone is reached (PRZ). In this particular chart, the 2nd leg pulled back too far to be a cypher pattern.
The hyperextended moves of a shark pattern causes price exhaustion. The supply and demand is interrupted due to the rather extreme price moves, which can trigger a strong reaction when the price reaches the potential reversal zone, especially if that level corresponds with a previously established support level for the bullish shark pattern.
Possible stop below last pivot low.
No recommendation

Long DDOGhave a butterfly pattern on the 8H, long calls above 88.2, stop loss 87, has bounced off a main demand and has been beaten down a little bit

DDOG possible patternDDOG has broken its recent downtrend and it appears to be repeating a cycle annotated on the chart, MACD, RSI with white trend lines where it should test its previous resistance. DDOG got caught up in the IXIC / NDX sell-off but appears to have significant support at the $75 level.
Might be a decent short-term trade if it passes the RSI test at 50. Fundamentals aren't too great but the chart looks good, growth is high, and it has beaten expectations on earnings the last 4 times. Earnings on 5/11.
Its EV-to-EBITDA is ridiculous but if you like to trade off chart technicals this is looking very attractive at least in the short-term. Being underloved & underappreciated in the space is another ace in DDOG's corner as some attention on the street or from a Cathie Woods type could send it flying. The real question is, will fundamentals actually start to matter?


DDOG DATA DOGS, FREE THE DOGS OUT woof woofSee chart. 2 possible scenarios, all bullish. Earnings next weeks, big parternship with Microsoft. Buy any dip.
Price target 130$ minimum
No stop.


DDOG channelDDOG looks like it'll keep moving in this channel either until we have a fundamental catalyst (news) or until we inevitably see a break and retest, which would pose as a good trade opportunity.

What 14 Quarters of Net Retention Above 130% Looks Like14 straight quarters of dollar-based net retention rate above 130%!
finance.yahoo.com
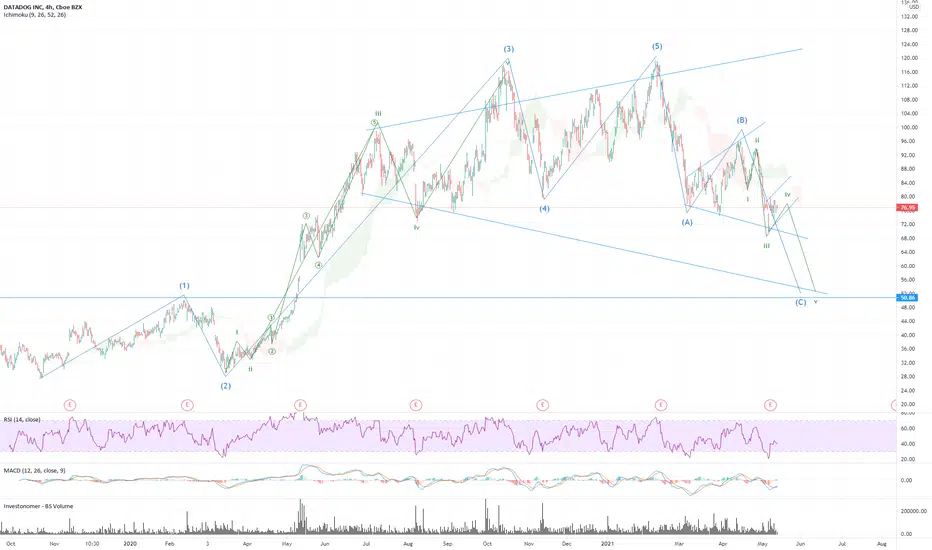
This a long-term trade with a price target of $223 for wave ((3)). The sideways consolidation appears to complete in an ABC flat pattern.


DDOG move into EarningsDDOG is pretty much a stock that runs independent to the overall market. At times it can be manipulated, and vast amount of insider selling happens often.
One thing I have noticed with the stock when it comes to insider selling, it is constant but can be somewhat deciphered when looking into the SEC form 4 filings.
Most of the insiders use an algorithm based selling strategy. They decide how many shares they want to sell that day and the algorithm triggers trades throughout the trading day.
If you look at the filed form 4's, when the algorithm does not trigger enough trades to sell all of the requested shares, it has traditionally meant that the algorithm isn't triggering many strongly sold areas of resistance. Indicating that the stock is showing strength and is likely but not guaranteed to continue to increase in price in the following days.
Another thing to look for is amount and timing of the insider selling.
-for instance the CFO Agarwal Amit usually sells his shares on Wednesday's, usually second Wednesday of the month in the amount of 22,500 shares. In the past, when he reports selling shares on a day other than Wednesday it usually indicates an upcoming volatility of share price. If he sells more than his 22,500, it may show that insiders are looking to take some additional profit while the stock price is nearing anticipated highs.
-additionally the CEO and CTO normally sell their shares the first week of each month, in the same manner.
All time highs have also had the tendency to be hit on a Tuesday leading into a Wednesday sell-off.
I would be surprised if DDOG doesn't make a run to challenge upper $90's in the near future. A rejection of a bounce back leaves the stock with room to trail down into the low 70's and potentially further into the mid 60's

Update on DDOG: should trade up into earningsI reconfigured the parallel channel and if it stays along the median it could hit $123 by earnings.
RSI showing it is not overbought and MACD signaling buy.
Looks like there is a path back to contend with previous resistance at $118.
This was nothing but a healthy market-wide sell-off/correction, mainly in technology, that brought this down. Fundamentals are still intact.
There was a recent bullish cross (annotated on the chart with a note) and Moving averages have maintained separation and strength since then on the 4H chart despite the pressure release.
Whether they break-out on earnings; it's too soon to tell, but it definitely looks set-up to trade up to that point so it could be a good short-term play.
I will have to come back and reanalyze when there are more whisper numbers on the street for earnings. Will also check on similar software/tech stocks that report and see how they react upon earnings as a gauge for how DDOG should react.

DDOG looking to rebound here!!!DDOG has been trending in a nice channel and is looking to bounce off the bottom here.

DDOG waiting for moveI feel like it'll be pretty choppy for a bit for DDOG. Okish bounce off the 100 day, so not much conviction there I'd like to see a double bottom form for another test of the 119.43 high.

DDOG, Time To Buy?Hello fellow traders and investors, DDOG has pulled back to the trendline that serves as a support and previously has always reversed, if DDOG makes a full recovery it offers a 13% ROI.
Technicals:
The Macd is oversold
The EMA's indicate that DDOG is still in a downtrend
DDOG is testing the trendline that acts as a support
When To Buy:
When the Macd crosses its EMA
When the EMA's crossover
I hope you enjoyed the quick analysis and much more to come!
