F: Bearish Harmonic PatternThe area where the price is right now is very strong.
We may see it correcting lower up to $14.19 - $14.62
The price may bounce again from the expected support area.
According to a "barrons" report: " Ford Motor sales dipped in China during the third quarter as the global semiconductor shortage continues to constrain automotive production. But Ford outperformed itself in China compared with its recent U.S. figures
Q3 Down but Year-To-Date sales up"
Thank you and Good Luck!
1F trade ideas

possible low risk trade on FORDThis is just a low risk trade for me cause Ford runs last month's very well (picture) and the worldwide lack of chips is hitting the whole car sector.
Not sure what's the long run for this. But I like the technical setup in my trading timeframe (1D) so far.
After a increase in volume and price, we see a 1:2.4 consolidation. I like to see that there is buying interest after closing the gap up (1) around the golden pocket, accompanied by some volume (2). So it means to me the level should hold. Positive earnings should be always a nice catalyst. Also Ford hits the SMA20 in the weekly (picture).
I think i consider a trade if the gap up level breaks again with volume, and my stop would be half ATR under the 13.62$ resistance. I dont want to see a pullback to the 61 fib again.
13.62-0.25 (half ATR)= 13.37 .. should be an epic stop :/
Sry 4 bad english and some mistakes, just a tradingbeginner from germany
have nice weekend

Ford Back in the uptrend channel. Looking at Ford on the daily chart and you can not get any more bullish than this. Price went back into that uptrend channel, and it broke out of the bullish pennant. Expect Ford to trade sideways a bit, and then we can see a move up higher into the top of the uptrend channel. RSI is just in the borderline of overbought while the MACD is in the green wide open. Giving Ford a 20 dollar price target, but will not be surprise to see it run up higher.

My outlook on Ford Rsi is very oversold on the 4 hour and the daily we also failed to break out of this range even with good news

Ford Bullish or BearishI see two scenarios for Ford in the short term. Today was bullish for the overall stock market and caused many stocks to push up from this week's lows. I think if the overall market stays bullish then Ford will follow suit. Otherwise, it may continue following this week's megaphone pattern and reatrace back to the bottom of the channel if it keeps hitting its head on this resistance area.

fordpushing the electric car dream ,chart b/o. Trading view will not let me publish this until I chat a bit more. ford makes vehicles, they sell cars and trucks. sheesh

Buy Ford 14/9/2021Stock above EXMA 200 and still in uptrend and Trading volumes increase with rises
So you can buy target 15.6 stop losses 11.8
Good luck

Ford Now trading in a noticeable range. couldn't even break above with momentum from news of sales .. Could be the early stages of consolidation .
let's see


F hoping it can get back in the uptrend channel. Haven't posted for a while as work has been a bit busy for me. I still trade when i get the opportunity and continue to read and study about charts when i can. F has woken up today and hoping it can continue upward and get back into the uptrend channel. Recent news that they are building battery plants and production plants for EVs is very bullish in my opinion, and if you look at the volume it is obvious that buyers are buying Ford. RSI is heading up towards the overbought territory while the MACD is widening green. Ford is a long hold for me and the rest of this year will be interesting to see where Ford will go in terms of price.

F - M :: Ford MA Crossover (20/10) :: Update IdeaBecause, the analysis is for the long term, it includes a crossover average indicator to help with the follow-up. The previous analysis was kept so the value for TP1 was not modified.
It is important to note that the price at this time is close to the resistance zone, so there may be a pullback in the price before proceeding with the possible bullish movement.
---------------------------------------------
Devido a análise ser para longo termo, inclui um indicador de média crossover para ajudar no
acompanhamento. A análise anterior foi mantida então o valor para TP1 não foi modificado.
É importante observar que o preço neste momento está próximo a zona de resistência, então pode ocorrer um recuo do preço antes de seguir com o possível movimento de alta.

F 1HRBearish Bat
set up becomes valid only when RSI IS BELOW 70
Price need to follow GREEN TREND LINE and hit Target 1 & 2 , else if Price BREAKS RED TREND LINE is EXIT
POTENTIAL BUY SELL

$F Breakout with confirmationFord looks like a good long idea with a break out and today confirmation. Call sweepers and blocks pretty active this and last week - OCT and NOV opex
Long 10/15 14C
Cheers !

F Return to TrendIn Oct 2020, Ford installed a new CEO, Jim Farley. Farley plans to reshape the American auto manufacturer. Under his leadership, they have unveiled multiple new EVs, including an electric F-150. This new leadership has brought the stock price out of a six-year decline.
Recently, Ford has been in a down-channel correction. This extended correction has provided an opportunity to open or increase positions. Price action on Sep 23 showed a break out of the down channel. On Sep 24, price action produced a possible reversal shooting star candle. However, the proportions of the candle were not quite right to make a shooting star, and today's price action has confirmed the breakout.
Looking at ADX and RSI, we also see confirmation of the breakout. The daily ADX shows DI+ greater than DI-. RSI on the daily time frame shows a positive trend and is below 70. RSI on the weekly timeframe advises caution. It shows that the correction lost momentum around 50. Whether this bounce holds on the weekly RSI is still undecided.

Ford poised up for growth Ford is poised up for growth on Monday. With major resistance ceilings at 13.93, 13.95 and 13.97. If it brakes trough to 14.01 there will be no major resistance point till 14.50

Ford climbing down. FFord Motor Company, had a nice upswing over the last number of months, and we it looks like we tipped not to long ago. It seems to be just at the beginning of the drop on this one, and there is plenty of time to climb down. Anyway, venture at your own risk.
Fibonacci goals are in green, reversal or invalidation is in red. This post is not financial advice, make your own financial advice or pay a certified professional ( you are to statistically faire better at blindly longing SnP500 incase of the latter). Playing on the market whether you are an investor or a trader is risky. No good thing is ever without. Good luck out there.

F headed to $17.65 to test monthly resistance going back to GFCFord been making good technical progress and recently broke out on the daily. Monthly here looks like it's set to test $17.65 which has been a resistance level going back to the global financial crisis.
Rivian IPO in should be coming up in a few weeks and F has been a meaningful investor there. At $80B valuation expected for Rivian and 0 vehicles delivered yet, Ford should get a nice bump at its ~$56B mkt cap.

Multi time frame analysis for FordMulti-Timeframe Analysis:
Hourly Chart: Getting out of a trendless (sideways) phase after 5 weeks. Bullish
Daily Chart: Getting out of a downward channel. Bullish
Weekly Chart: Price reacted to the trend line and bounce back. Bullish
Monthly Chart: first sign of recovery after 3 months of correction
Daily average trading value
Conclusion: In the price pattern we have shreds of evidence that Ford's correction is finished but Volume and Price volume do not support this idea and make it likely to be a Bull trap followed by whipsaw..!
I would rather wait and see if volume supports this breakout!
What Is a Bull Trap?
A bull trap denotes a reversal that forces market participants on the wrong side of price action to exit positions with unexpected losses.
Bull traps occur when buyers fail to support a rally above a breakout level.
Traders and investors can lower the frequency of bull traps by seeking confirmation following a breakout through technical indicators and/or pattern divergences.
What Is Whipsaw?
Whipsaw describes the movement of stocks in a volatile market when a stock price will suddenly switches direction.
There is no set rule as to how to manage whipsaw movements in a volatile market as it is an unexpected movement.
Whipsaw in trading securities often results in trading losses.
Day traders expect whipsaw movements and often assume long-term, buy and hold positions to ride out the fluctuations in price to avoid a loss.
Educational Articles:
www.investopedia.com
www.investopedia.com

F is good bullish !It's in the third wave now.
Ford and Redwood Materials also today announced they are working together to build out battery recycling and a domestic battery supply chain for electric vehicles.
Ford and Redwood say their goal is to make electric vehicles more sustainable, drive down the cost for batteries and ultimately help make electric vehicles accessible and affordable for more Americans.
Ford Motor Co. manufactures automobiles under its Ford and Lincoln brands. The company has about 14% market share in the United States and about 7% share in Europe. Ford has about 186,000 employees, including about 58,000 UAW employees, and is based in Dearborn, Michigan.

ABC BullishTarget is D. Stop under C.
Targets are calculated using the AB leg and fib levels.
This is not to long entry level of 13.
The 20 crossed under the 100 which is a bearish crossover and price is below the 50 which is sloping down. F needs some UMPH right now. Moving averages are lagging indicators.
The 100 and the 200 are sloping up which can mean long term this is okay right now.
No recommendation.
We do not always win, but success can be failing without losing enthusiasm )o:

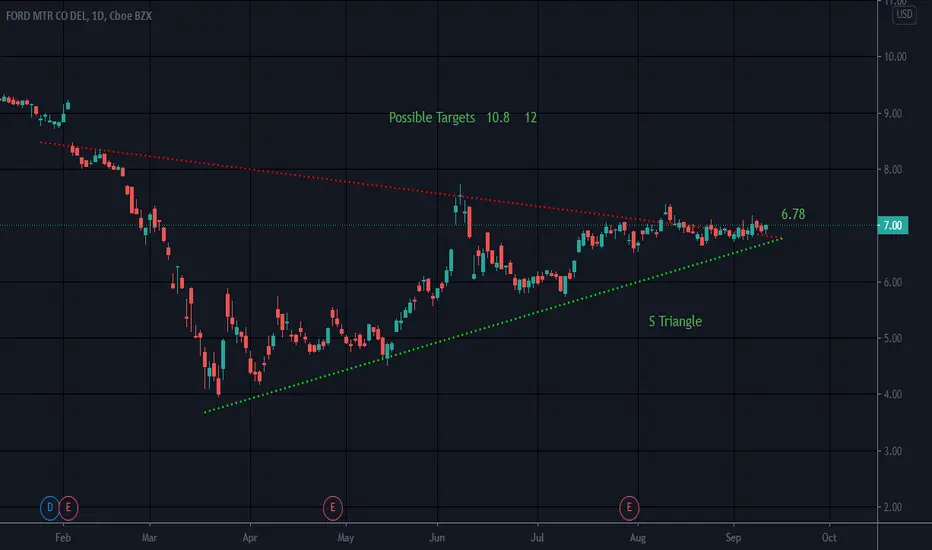
Symmetrical triangleS Triangles can break up or down
This one looks to be trying to break up..I am guessing
Needs to consistently break the upper trendline and seems to be doing so
Hard to believe..lol. This one is one that just seems to struggle
Not a recommendation
FMID-TERM: 4hr hidden bullish divergence, bouncing off demand zone, broke supply line, double bottom. (not financial advice)

