After Big Profit Prediction On $FCX, Here Is The Next Money MakeJust a month ago, I stated that Freeport-McMoRan Inc (NYSE:FCX) would bounce off a gap fill stock chart support at $12.15 and bounce sharply higher. This was a quick trade. Sure enough, within days, Freeport-McMoRan jumped from $12.15 to closed to $14.00. This was a beautiful trade worth 15%. Since then, Freeport-McMoRan has started to fall again, back to the $12.15 level. While it is support, this is just a minor level. Instead, the next big buy level is $11.15. Smart investors and stock traders should be ready to pounce on Freeport-McMoRan here. This will be the next big bounce, likely as much as 20%.
Trade ideas


IS THE RECENT FCX HOURLY BREAKOUT SOMETHING BIGGER?Recently highlighted a successfully retested breakout on the fcx hourly chart, but expanding to the larger time frame reveals that this breakout may represent resumption of a larger bullish structure. New targets of $14.80 and $16.50 added.


Light at the End of the Tunnel for FreeportThe Grasberg mine dispute cannot hold Freeport-McMoran bulls forever

FCX BREAKING OUT!FCX exploding through key $13 resistance level on strong volume. Already in this name. Looking for $13.65 and $14.30 in short order.

BULLISH PATTERN FCX HOURLYBullish pattern developing in FCX on the hourly chart. Watch for upside breakout!

Looking for a setup on FCXWaiting to see what FCX does here. If it breaks the 13.14 support I'll be looking for it to retest and break higher. If it breaks the trend and goes bearish I'll be looking for a bearish setup. I'm not in any trades on FCX just yet.

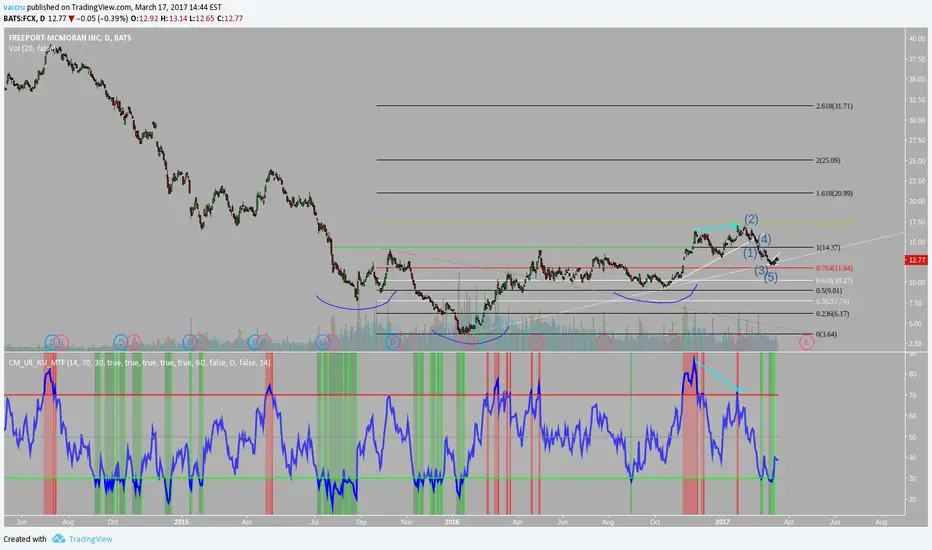

$FCX ShortAnother fairly easy and simple short. Don't complicate your trading, just look at the chart. Best of luck to all.


Long FCX here- Daily charts are quite oversold
- Possible double bottom of the old inverse H&S neckline, seems like a support level
- Copper remains in an uptrend after recent 2 month correction
- Buy 13.56, Stop below 13.00
5% of portfolio, 4% risk, portfolio risk 0.2%
If the global economy doesn't implode this should do well long term. If there is a currency crisis this should also do well. Who knows? Seems like good setup here.

Bullish Bat FormingSuggest to buy at SMA 200 levels..around 12.50
Cut loss @ 11.80 levels, TP 14.50
Reasoning :-
1) SMA 100 has broken
2) formation of bullish bat before rebounces
3) upward trendline

FCX - Possible head & shoulder formation, short from $14.83FCX came up in capture in crush scan. It seems forming a head & shoulder formation. It can easily break down to $13.43 area.
* Trade Criteria *
Date First Found- February 16, 2017
Pattern/Why- Head & shoulder, Capturing the crush
Entry Target Criteria- Break of $14.83
Exit Target Criteria- $13.43
Stop Loss Criteria- $15.33
Please check back for Trade updates. (Note: Trade update is little delayed here.)


FCXLong 3 units, max from the 15.5 area, stop under the 50 DMA, scale to 10 units, target F16, sell all.


HELD SUPPORT WELL TODAY FOR ADDITIONAL BUYING OPPNOW IT HELD SUPPORT AREA POST EARNINGS, HUGE HAMMER LOOKING TO GO HIGHER TOM


FCX FCX is starting vth wave down for the next 2-3 months to new lows. After that, new up long term trend should begin
