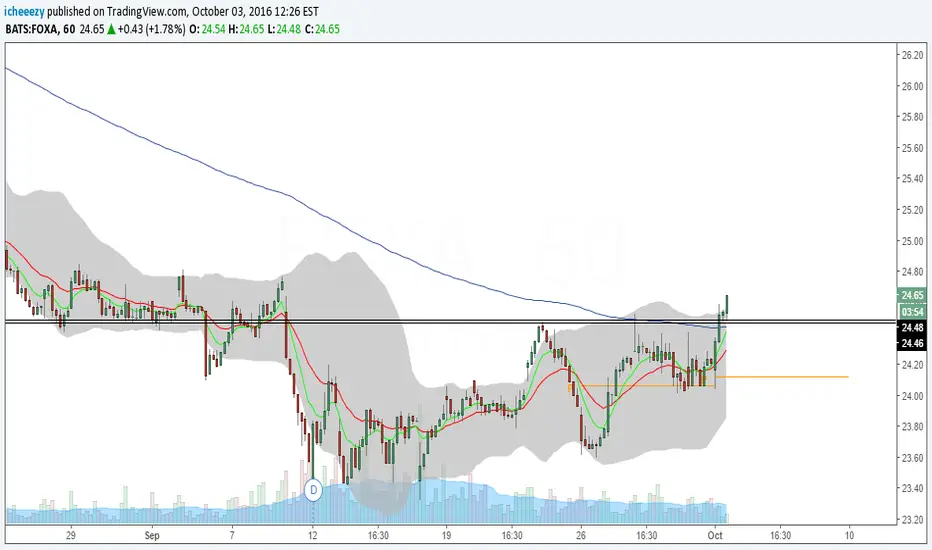
1FOXA trade ideas


FOXA showing all signs it might go down againThe reasons it's likely to go down at this moment:
-SMA: a top below the line and a reversal setup is forming.
-S/R: against resistance.
-RSI+BB: just jumped below the 50 line, and a lot of room to go down.
-MACD: crossing, meaning it's likely to go down.

FOXA - Potential bottom19.05.17
Signal for a potential bottom from one of my dBFIs
Awaiting confirmation (almost there)


FOX T.V.- Short At This TimeFOX 1 daily chart, being of April ended an bullish Elliot Impulse Wave (12345). Starting this month stock has lost $2.00 a share, related to negative news related to Bill O'Reilly firing. I believe bears will be in control of FOX stock until June, then recheck at that time situation.
SUPPORT areas: First noted support area is S1 $29.35, S2 $28.50 & S3 $ 27.08.
Please do your own research and make any trading decisions based on sound strategy and research.


Long foxagotta see how we close today, but $foxa lookin very bullish wouldnt be surprised to see it trade above 26 this week

FOX : 21 CENTY FOX INC, 6 MONTHS MOVEMENTthis strategy is based on trends, william %R and WT -LB (10, 21, 60.). After sharp increase in the first part of the semester to approximately 30,99, the shares ploughed. this shows a steady pattern movement of the shares therefore i am expecting an increase around 30,20 per shares in the coming semester. NASDAQ:FOX


(D) Some support near S1 pivot and 28. Local OBV bottomIf bulls still in, might be a small bullish trend. Obey your rules


PRICE ACTION + VOL LONG ON FOXAThis is a methodology that a friend and I have been collaborating on for the last couple of weeks. It combines Wyckoff, S/R, and price action (plus 2 indicators 200 ema and stochastics). Here we go.
1. New swing high on 12/23/14, also showing a divergence between stochastic and price (often a continuation of trend on pullback)
2. Gradual sloping uptrend based on 200 ema (uptrend)
3. 2 bar reversal candle pattern on 1/22/15
4. Support at white line, with 3 prior reversals at that level
5. Fib retracement to 0.618
6. Support at 200 ema
7. Divergence between volume and price on 10/15/2014; and confirmation with volume on new swing high and current pullback
Entry/stop:
4 different scenarios
1. R:R 1:5.31, if minor swing low holds prior to a new high
2. R:R 1:1.34, if minor swing low fails, but major swing low holds prior to new high (this is the key assessment, must be 1:1 or better, since this is the worst profitable outcome)
3. R:R 1:2.09, if major swing low holds with a target AB=CD (this could change if price further pulls back)
4. R:R 1:3.53, if major swing low holds with a fib extension target at 1.618 (this could change if price further pulls back)


FOXA Earnings TradeLooking at bullish order flow ahead of FOXA earnings we elected to buy FOXA Feb 33-34 Call Spreads looking for a move higher through February.
