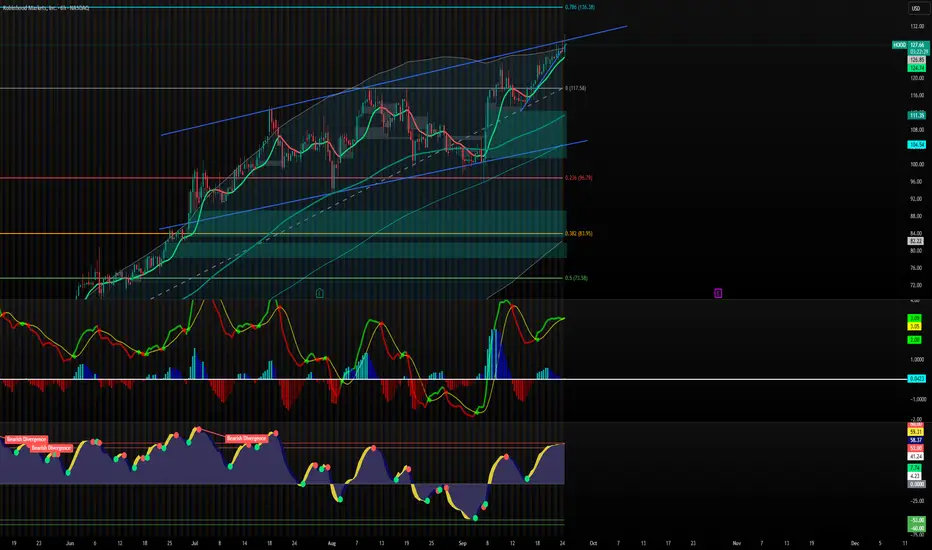
HOOD - Will it have a pullback ? Chart Breakdown
1. Price Action & Trend
Current price: ~128.19
The stock is moving inside a rising wedge channel (two converging upward blue lines).
Price is testing the upper resistance of the wedge — often a spot where momentum can stall or reverse.
Strong uptrend since late August, but this steep climb may be overextended.
2. Fibonacci Levels
Major retracement levels marked:
0.236 (~96.79) = First key support if price pulls back.
0.382 (~83.95) = Deeper support zone.
0.786 (~136.38) = Next potential target/resistance above.
The price is approaching the 0.786 Fib target at ~136, which could act as a ceiling.
3. Indicators
MACD (middle panel): Positive momentum, but the histogram shows it’s starting to flatten. It could mean slowing momentum.
Oscillator (bottom panel):
Shows previous bearish divergences (price made higher highs, oscillator didn’t).
Currently in the overbought zone.
Signals potential for a pullback soon.
4. Volume / Strength
The recent move up came with strong buying volume (supporting the rally).
But rising wedge patterns usually break downward once buyers are exhausted.
📊 Sentiment & Prediction
Short-Term Sentiment:
🔼 Bullish momentum (trend is still up, targeting ~136).
⚠️ But overbought indicators + wedge resistance suggest caution.
Medium-Term Sentiment:
If HOOD fails to break above 130–136 resistance, a retracement toward 117 support (channel midline) or even 96–100 (Fib 0.236) is possible.
Long-Term Sentiment:
Still overall bullish trend intact unless price breaks below the wedge support (~117 → 96 zone).
✅ Summary:
Bullish but overextended.
Watch for rejection near 130–136 → could trigger a pullback.
Key support levels = 117, 96, 84.
Break above 136 with volume = strong bullish continuation.
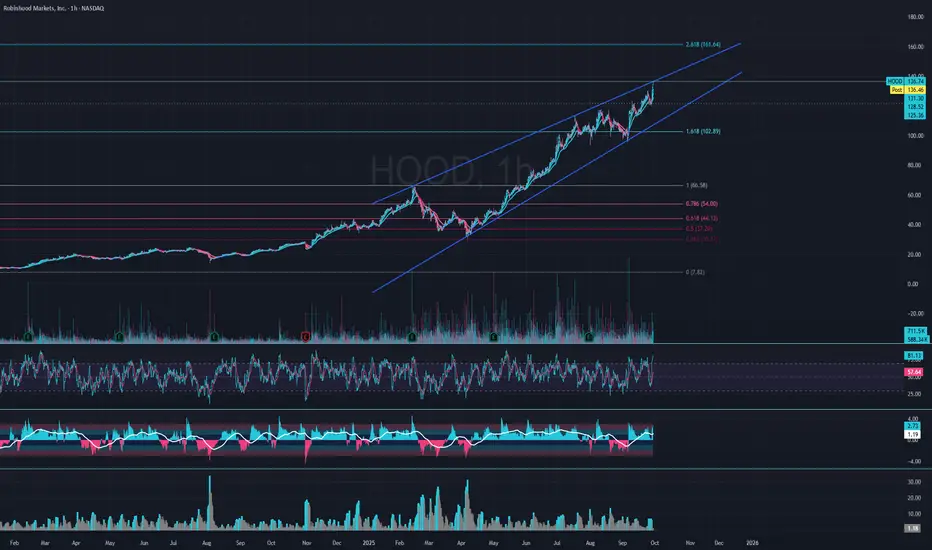
1HOOD trade ideas
$HOOD at Top of ChannelTime for a pullback on $HOOD. Believe that we ultimately hit the next Fib target at $161 but everything lines up here
HOOD – TA for Sep 29HOOD – Slipping in a Channel as Gamma Points to Big Floors and Ceilings ⚠️
1-Hour Technical Outlook
Robinhood continues to grind inside a descending channel, with sellers controlling the short-term structure. Price is hovering near $121.8, caught between lower highs and the key $120.6 pivot. MACD is negative but flattening, while the Stoch RSI is trying to rebound from mid-range, hinting at a possible pause or minor bounce before the next big move.
Upside resistance stands at $122.6 (immediate trendline cap) followed by $125 and $130. On the downside, the most critical support is $120–$119, with the next strong floor at $112.5.
Gamma Exposure (GEX) Confirmation:
Options positioning underscores these chart levels:
* Massive Call Resistance is stacked at $125 and $130, with ~94–96% call concentration there, forming heavy topside gamma walls.
* Strongest Put Support / Highest negative GEX lies at $112.5, creating a powerful downside cushion.
* Mid-range gamma pivot near $120 aligns with the channel floor, making it a key inflection point.
If HOOD can reclaim $125 on volume, dealers may be forced to hedge by buying, opening a path toward $130. A decisive break under $120 would likely trigger hedging pressure toward $115–$112.5.
Trade Ideas & Option Plays for This Week
* Bullish Play: Long on an hourly close above $125, targeting $130. Options: 1-week 125 calls or 125/130 call spreads to limit premium.
* Bearish Play: Short below $120, aiming for $115–$112.5. Consider 120/112.5 put spreads or short-dated puts for defined risk.
* IVR near 21 and IVx around 62 suggest premiums are moderately rich—good for credit spreads if you expect continued chop.
My Take
HOOD is still in a short-term downtrend, but gamma positioning shows very clear lines in the sand. Bulls must flip $125 into support to change momentum, while bears will press for a $120 breakdown to unlock lower targets.
Disclaimer: This analysis is for educational purposes only and does not constitute financial advice. Always do your own research and manage risk before trading.

Weekly Shooting StarKeep it simple, this looks topped for the near term. Short to green box. Ask for my cashapp if you crush and pay for my next lap dance. Bearish divergence on the RSI, helps the case.

HOOD BUY SET UPHOOD has been on an uptrend lately with strong trading volume. It has broken out of an ascending triangle on Daily chart, supported by growth factors such as its upcoming S&P 500 inclusion, increased CRYPTO trading on its platform and the launch of Robinhood Ventures Fund I. Looking ahead to next week, I’m optimistic it could reach $150

Potential Buy Setup – $HOOD Breakout on High VolumeKey points:
• Growth of 293% in the previous 4 months
• Consolidation phase of nearly 1 month after the growth, with low volume and respecting the EMA21
• Beginning of a flag breakout with average volume surging more than 50%
• Continuation breakout above the previous high with another volume surge
-------------
Dear friends,
I trade the markets using a structured, multi-stage strategy that combines technical analysis, price action, and market psychology. My approach includes key concepts such as candlestick patterns, trendlines, support & resistance, Elliott Wave theory, and price channels. I also integrate strategies from O’Neil’s CANSLIM, Minervini’s SEPA, Oliver Kell’s momentum trading, and Qullamaggie’s breakout setups.
Good luck!
Robinhood Markets, Inc. 1W NASDAQ NASDAQ:HOOD is exploring new highs. #HOOD is targeting $162.69, which is the target price based on the chart pattern. It's amazing how the crypto world is gaining more and more adoption every day. The top 5 digital currency exchanges (BNB, Coinbase, Robinhood, etc.) seem to be aiming for a price of $1000.There's a significant price gap in the range of $106 to $110.

HOOD — In Key Macro Resistance ZonePrice has reached a major resistance zone, with the 110 level marking an ideal spot where downside pressure may begin to dominate and a mid-term top could start forming. Macro support for the macro-uptrend structure is at the 80–65 area.
Hedging near current levels may be prudent - especially ahead of earnings and while volatility remains relatively cheap.
Weekly view
Daily view:
Thank you for your attention and I wish you successful trading decisions!
Hood techincal support I see exhaustion of sales in the stock, possible buying opportunity, as it is in the balance of the structure.

9/11/25 - $hood - Seems kinda expensive no?9/11/25 :: VROCKSTAR :: NASDAQ:HOOD
Seems kinda expensive no?
- why are people valuing banks like tech stocks?
- 50x PE? 12x book?
- if you say so. no thanks.
- great company. great product. zero interest in owning this stonk here
V

HOOD 3Hour Time frameHOOD 3-Hour Snapshot
Current Price: $118.50
Change: +1.21% from the previous close
Market Cap: $82.63 billion
P/E Ratio: 46.21
EPS (TTM): $1.96
🔎 Key Levels
Resistance:
R1: $120.00 (recent high)
R2: $125.00 (next resistance zone)
Support:
S1: $115.00 (immediate support)
S2: $110.00 (next support level)
📈 Technical Indicators
RSI (14): 43.40 — Neutral
MACD: 0.69 — Bullish momentum
Moving Averages:
5-period SMA: $116.00 — Buy signal
10-period SMA: $113.00 — Buy signal
20-period SMA: $110.00 — Buy signal
50-period SMA: $105.00 — Buy signal
📌 Market Sentiment
S&P 500 Inclusion: Robinhood is set to join the S&P 500 index on September 22, 2025, replacing Caesars Entertainment. This milestone reflects the company's growth and stability in the financial technology sector.
Reuters
Recent Performance: The stock has gained approximately 496% over the past 12 months, driven by strong financial performance and increased user engagement.
Barron's
Analyst Outlook: Analysts maintain a positive outlook on HOOD, with a consensus rating of "Buy" and a 12-month price target suggesting potential upside.
TipRanks
📅 Outlook
Bullish Scenario: A breakout above $120.00 could lead to a push toward $125.00 and higher.
Bearish Scenario: A drop below $115.00 may test support around $110.00.
Overall Bias: Moderately bullish, with positive momentum but facing near-term resistance.

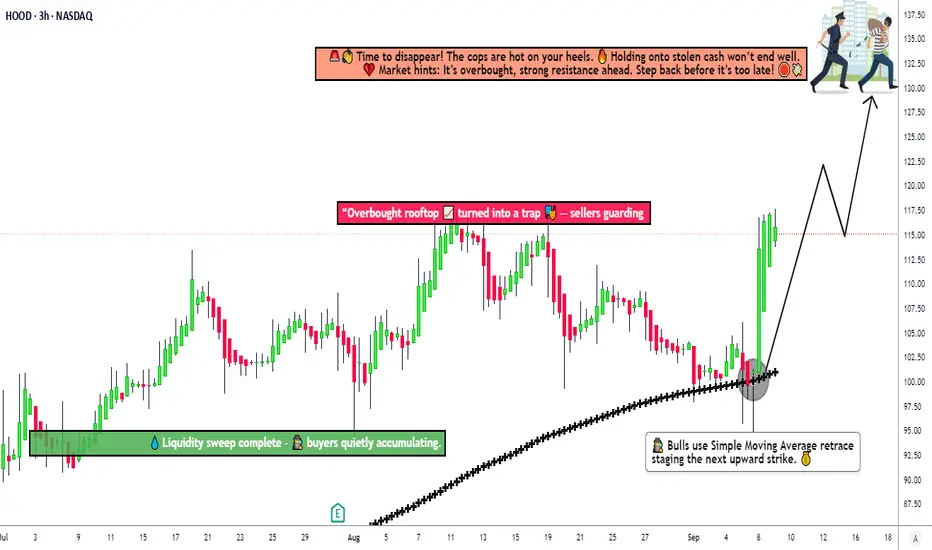
Is Robinhood (HOOD) Set To Soar? Analysis & Entry Plan.HOOD: The Money Heist Plan 🎭💰
Asset: ROBINHOOD MARKETS INC (HOOD)
Timeframe: Swing Trade / Day Trade
Direction: Bullish
🎯 The Thief's Entry Plan (Layered Strategy)
Ladies & Gentlemen, Thief OG's! 🎭 The plan is to enter using a layered limit order approach. This allows for scaling into the position and optimizing your average entry price.
🛒 Layer Buy Zones: 108.00 | 110.00 | 112.00 | 115.00
Pro Tip: You can add more layers based on your capital and risk appetite.
⛔ The Escape Route (Stop Loss)
Every good thief needs an exit strategy. This is mine, but adjust based on your own risk!
🚨 Thief's Stop Loss: $102.00
A break below this level suggests the heist is compromised.
🎪 The Getaway (Take Profit)
The strong resistance and potential trap (overbought signals) are near our target. Escape with the stolen money before the "police barricade" forms!
💰 Primary Target: $130.00
Disclaimer: This is my plan. I am not recommending you use only my SL/TP. Manage your risk and take profits at your own discretion.
🔍 Why This Heist? The Bullish Case:
This isn't a random grab; it's a calculated plan based on multi-factor analysis.
📊 Fundamental & Technical Fuel:
🚀 Rocketing Performance: YTD +208.29%! Trading near 52-week highs shows immense strength.
💪 Blowout Earnings: Q2 EPS of $0.50 smashed estimates by +41%. Revenue growth is explosive at +71.54% YoY.
💰 Profit Machine: A stunning 50.13% profit margin – this company is highly profitable.
📈 Technical Momentum: Price is in a powerful uptrend, using key EMAs as support.
🧠 Sentiment & "The Crowd"
😰 Fear & Greed Index (Neutral 52/100): The overall market is not in extreme greed, leaving room for upside.
Sub-indicators show Greed in Momentum, Volatility, and Junk Bond Demand – a risk-on environment.
Institutional Demand: Net institutional adds are positive (702 increased positions vs. 427 decreases), with major players like JPMorgan adding significantly.
Retail Buzz: Mixed sentiment post-earnings can create opportunities; the crowd is often late.
⚠️ Risks & The Bear Case (Know Before You Go!)
High Beta (2.36): HOOD is highly volatile and will amplify any market moves. Watch related indices: SP:SPX , NASDAQ:NDX , AMEX:IWM
Macro Events: The upcoming CPI Report (Sep 11) and Fed Meeting (Sep 16-17) are key risk events that could cause market-wide volatility.
Valuation Concerns: High P/E ratio (58.45) suggests the stock is priced for perfection; any misstep could lead to a sharp pullback.
Insider Selling: Executives have been net sellers. Always a note of caution.
📈 Related Pairs to Watch
Broader Market: SP:SPX , NASDAQ:NDX
FinTech Sector: AMEX:XLF , AMEX:IPO
Meme/Retail Sentiment: NYSE:GME , NYSE:AMC
🎭 Final Heist Debrief
Short-Term: Neutral market sentiment suggests cautious optimism. Watch the macro cues (CPI/Fed).
Long-Term: Bullish fundamentals are strong, but high volatility and valuation require smart risk management.
The plan is set. The layers are in place. Execute like a pro, manage your risk, and may the odds be ever in your favor!
✨ “If you find value in my analysis, a 👍 and 🚀 boost is much appreciated — it helps me share more setups with the community!”
#HOOD #Trading #SwingTrading #DayTrading #Bullish #Stocks #Investing #FinTech #TradingPlan #MoneyHeist #TechnicalAnalysis #Fundamentals
Robinhood Markets, Inc. (HOOD) Expands Commission-Free TradingRobinhood Markets, Inc. (HOOD) is a financial services platform best known for pioneering commission-free trading of stocks, ETFs, options, and cryptocurrencies. With a mobile-first approach, Robinhood has attracted millions of retail investors and continues to expand into new financial products like retirement accounts and credit cards. The company’s growth is fueled by user-friendly technology, democratization of investing, and increasing participation from younger generations entering the markets.
On the chart, a confirmation bar with rising volume shows strong buying interest. The price has entered the momentum zone after breaking above the .236 Fibonacci level. A trailing stop can be placed just below this Fibonacci line using the Fibonacci snap tool, helping traders secure gains while leaving room for additional upside.

HOOD Bull, then bear? I’m not a professional… but looking for other opinions! Always interested in others views and thoughts.
My thoughts on HOOD are, I think we could potentially see a run up to $140/$150. At that area is would be “overvalued”. IMO. Would that be a good area (if met) so begin looking for shorts?
Lmk what your thoughts are!

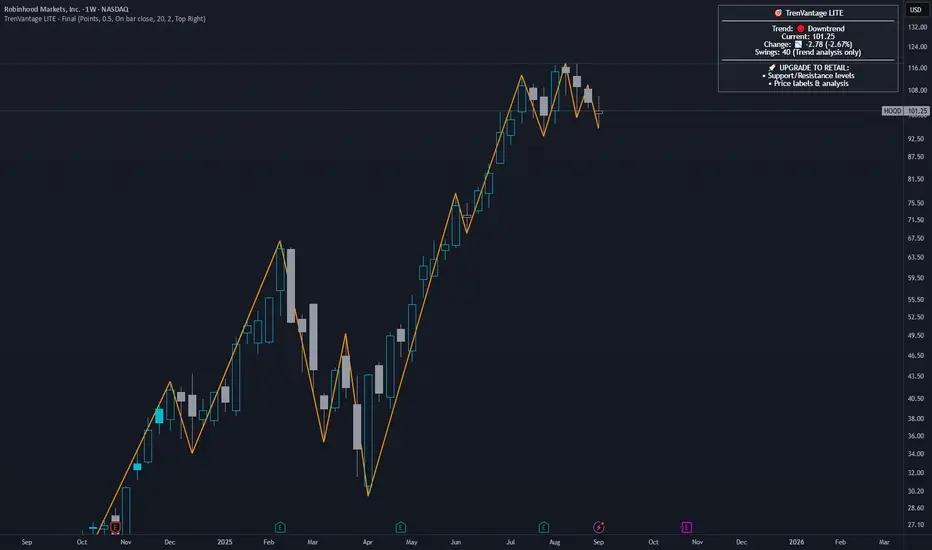
RobinHood Weekly Chart with TrenVantage LITERobinHood Weekly Chart with TrenVantage LITE plotted.
Indicator status box showing the clear downtrend, trends being autoplotted by the indicator as well.
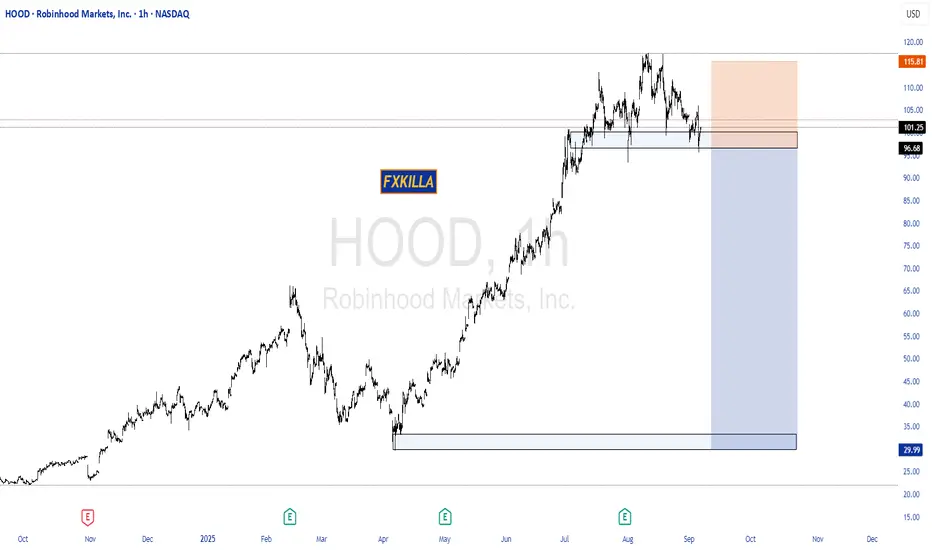
ROBINHOOD HIGH PROBABILITY SETUP SOON!!!🚨 HOOD HIGH PROBABILITY SELL SETUP 🚨
* Here We Can See Clearly The Next Potential Move For HOOD Coming Hours/Days.
* Keep Your Eyes Close On Your Trading Positions.
* Happy PIP Hunting Traders.
FXKILLA.
HOOD S&P 500 Inclusion = Gamma Squeeze Incoming?
# 🚀 HOOD Weekly Setup (Sep 5, 2025) 🚀
**Catalyst:** 🔥 S\&P 500 inclusion → forced buying
**Options Flow:** 📊 C/P = **3.15** (extreme bullish)
**Volatility:** 😴 Low VIX → cheap calls
**Technical:** RSI mixed but catalyst > chart
---
### 📈 Trade Idea
* 🎯 **Buy \$106C** (Sep 12 Exp.)
* 💵 Entry ≈ 2.44
* 🎯 Target: 4.00 (+64%)
* 🛑 Stop: 0.98 (-40%)
* 📅 Exit: by Thu, Sep 11
* 🔥 Confidence: 75%
---
### ⚡ Bonus YOLO Play
* 🎯 \$114C (0.81) → cheap lottery ticket
* ⚠️ High risk / lower win rate
---
📌 **Consensus:** ALL models bullish (flow + catalyst)
📊 Heavy OI at 105 → dealer gamma squeeze setup
---
\#️⃣ NASDAQ:HOOD AMEX:SPY NASDAQ:QQQ AMEX:IWM #SP500#NASDAQ #OptionsTrading #UnusualWhales#GammaSqueeze#OptionsFlow#FlowTrading#WeeklyOptions#CallOptions#StockMarket#TradingView #Bullish#SP500Inclusion#StocksToWatch#MarketMoves#EarningsSeason#MomentumTrading#RiskReward

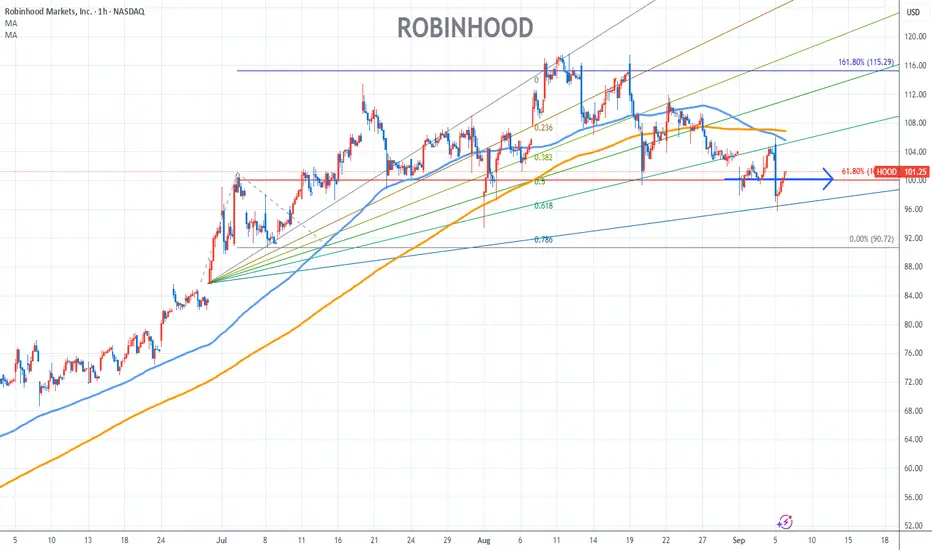
Robinhood Stock Chart Fibonacci Analysis 090625Trading Idea
1) Find a FIBO slingshot
2) Check FIBO 61.80% level
3) Entry Point > 101/61.80%
Chart time frame:C
A) 15 min(1W-3M)
B) 1 hr(3M-6M)
C) 4 hr(6M-1year)
D) 1 day(1-3years)
Stock progress:A
A) Keep rising over 61.80% resistance
B) 61.80% resistance
C) 61.80% support
D) Hit the bottom
E) Hit the top
Stocks rise as they rise from support and fall from resistance. Our goal is to find a low support point and enter. It can be referred to as buying at the pullback point. The pullback point can be found with a Fibonacci extension of 61.80%. This is a step to find an entry-level position. 1) Find a triangle (Fibonacci Speed Fan Line) that connects the high (resistance) and low (support) points of the stock in progress, where it is continuously expressed as a Slingshot, 2) and create a Fibonacci extension level for the first rising wave from the start point of the slingshot pattern.
When the current price goes over the 61.80% level, that can be a good entry point, especially if the SMA 100 and 200 curves are gathered together at 61.80%, it is a very good entry point.
As a great help, TradingView provides these Fibonacci speed fan lines and extension levels with ease. So if you use the Fibonacci fan line, the extension level, and the SMA 100/200 curve well, you can find an entry point for the stock market. At least you have to enter at this low point to avoid trading failure, and if you are skilled at entering this low point, with the fibonacci6180 technique, your reading skill of to chart will be greatly improved.
If you want to do day trading, please set the time frame to 5 minutes or 15 minutes, and you will see many of the low points of rising stocks.
If you prefer long-term range trading, you can set the time frame to 1 hr or 1 day
Is $HOOD headed to $85 on this pullback? Robinhood has had a great rally which is warranted given its revenue growth and innovation in the brokerage space.
Stock is currently consolidating the move from 30 to 116 - I think the current pullback can get us to ~$85 which I believe is buyable for the next move higher. With further innovation, continued revenue and profit growth, and potential S&P 500 inclusion, I think the stock can hit $120-$130 in 2026.

Robinhood - This is still not the end!🏹Robinhood ( NASDAQ:HOOD ) is not done yet:
🔎Analysis summary:
After creating a quadruple bottom formation back in 2023, Robinhood managed to rally an incredible +1.400%. It seems to be obvious that Robinhood has to correct soon, but that's not how markets work. Momentum tends to continue for much longer so Robinhood will just rally more.
📝Levels to watch:
$150
SwingTraderPhil
SwingTrading.Simplified. | Investing.Simplified. | #LONGTERMVISION

$HOOD Crash Alert? Put 94C Traders Loading Up
# 🔻 HOOD Weekly Outlook: Neutral → Bearish Tilt? (Sep 2, 2025) 🔻
### 📊 Multi-Model Consensus
* **Momentum**: Daily RSI 37.1 → bearish 📉 | Weekly RSI 65.5 falling 🟡
* **Volume**: 0.6x prior week → weak liquidity ⚠️
* **Options Flow**: C/P ratio = 2.17 → strong **bullish skew** 🐂
* **Volatility**: VIX 18 → favorable environment
👉 **Net View**: **Neutral w/ Bearish Tilt**
* Price momentum & weak volume = downside risk 📉
* Heavy bullish call flow = potential contrarian fade 👀
---
### 🧠 Model Breakdown
* **Gemini / Grok / Llama / DeepSeek** → 🚫 No Trade (low conviction)
* **Claude** → ✅ Tactical Bearish PUT (contrarian call vs. flow)
---
### 🎯 Trade Setup (Tactical Play)
* **Instrument**: \ NASDAQ:HOOD
* **Direction**: PUT 🟥
* **Strike**: 94.00
* **Expiry**: 2025-09-05 (3DTE)
* **Entry**: \$0.97 (market/open)
* **Profit Target**: \$1.45 (+50%) 💰
* **Stop Loss**: \$0.48 (–50%) 🛑
* **Size**: 1 contract (small / tactical)
* **Confidence**: 60% ⚖️
⏰ Exit by **Thursday close** to avoid Friday gamma risk.
---
### ⚠️ Key Risks
* Heavy call flow → possible squeeze 💥
* Weak volume → illiquid / erratic moves
* Time decay (theta burn) accelerating 🕒
---
🔥 **Summary**:
\ NASDAQ:HOOD sits in a **neutral-to-bearish zone**. Most models = "NO TRADE", but one high-conviction model spots a contrarian PUT setup. Risk small, manage tight stops, and exit early if momentum stalls.

HOOD. Drop first before the pump. I believe we will come down early next year (bottom box) before we pump to test some important daily levels (top Box). Thoughts?
