Robinhood and USDC: Cryptoland Predicting the FutureIon Jauregui – Analyst at ActivTrades
Robinhood (NASDAQ: HOOD) is not only focused on stocks and cryptocurrencies; it is now taking a bold step into sports prediction markets. Thanks to its integration with Kalshi, the app will allow users to bet on NFL and NCAA outcomes throughout the regular season. This move, presented as a “prediction market” to avoid conflicts with the CFTC, demonstrates Robinhood’s intention to become the “one-stop shop” for the modern investor, combining finance, entertainment, and cryptocurrencies.
Kalshi, Robinhood’s technology partner, accepts payments in USDC, Bitcoin, Solana, and WLD, directly integrating the stablecoin ecosystem into betting and predictions. This approach highlights the growing importance of stablecoins as a vehicle for liquidity and digital transactions.
Interest in USDC is accelerating alongside the regulatory clarity provided by the recent GENIUS Act, which establishes federal standards for stablecoins. According to a Goldman Sachs report, the global stablecoin market, valued at $271 billion, could see a significant boost for USDC, with projected growth of $77 billion between 2024 and 2027. Circle, the issuer of USDC, stands to benefit from reserve transparency and a favorable regulatory environment, positioning itself against Tether in the so-called “stablecoin gold rush.”
Robinhood (Ticker AT: HOOD) continues gaining ground.
Robinhood has confirmed that it is still in full expansion. In Q2 2025, the platform reported revenues of $989 million, a 45% increase compared to the same period last year, while net profit doubled, rising 105%, demonstrating that its business model remains profitable.
The company is not only focused on stock trading but has diversified its offerings. With premium services such as Robinhood Gold, a new credit card, the Robinhood Legend platform, and the acquisition of Bitstamp, Robinhood aims to consolidate its presence in the cryptocurrency and futures markets, diversifying its revenue streams. The company’s ambitious goal is to capture a significant share of the estimated $84 trillion wealth transfer to younger generations over the next two decades.
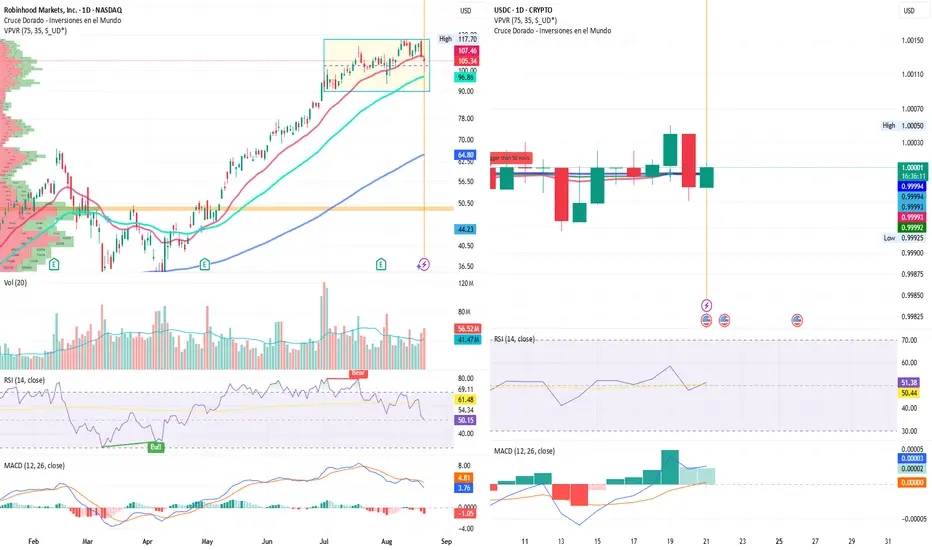
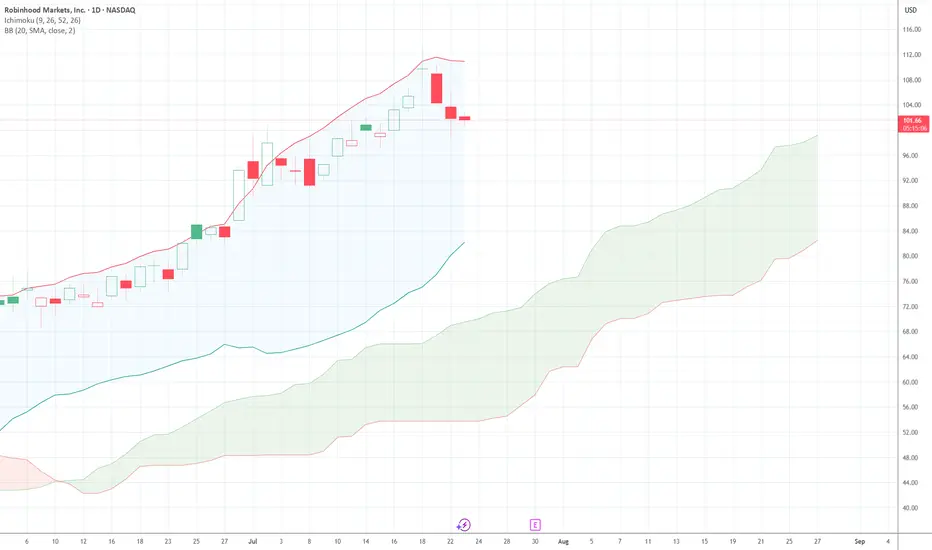
From a technical perspective, HOOD shares are trading at $105.34 as of yesterday, up 182% over the past year, confirming a sustained upward trend.
Technical
Currently, Robinhood shares trade at $105.34, with a P/E ratio of 46.21 and EPS of 1.96. Over the past year, the stock has risen 182.72%, showing a strong upward trend. Yesterday’s bearish close after hitting a high of $117.70 for the second time in August suggests the bullish momentum may require more volume to continue. The RSI at 50.15% and MACD entering negative territory, along with a Point of Control (POC) at $49.11 (less than half of the current price), could signal a potential price correction despite the hype and high expectations. The volume over the last two sessions has been relatively high (56.52M vs. 41.47M), suggesting a possible pause in the rally, provided strong support levels at $90 and $96.86 hold. The price has lost support from the 50-day moving average but remains above the 100-day moving average.
USDC: The Stablecoin That Keeps Growing
In the cryptocurrency world, USDC continues to strengthen its position. The stablecoin issued by Circle has seen its circulation exceed $65.2 billion, a 90% increase over the past year, reflecting growing confidence from both institutional and retail investors. Although Circle reported revenues of $658 million in Q2 2025, up 53% from last year, it still shows a net loss of $482 million due to accounting adjustments related to its IPO. However, recent stablecoin regulation (GENIUS Act) has provided greater security for users and boosted institutional adoption of USDC as a payment method and store of value.
Technical
Practically speaking, USDC continues to fulfill its goal: maintaining parity with the US dollar, trading steadily at $1, offering confidence in a volatile market. Its stability, backed by liquid and secure assets, reinforces its position as one of the most reliable stablecoins. Yesterday’s session saw a correction from a high of $1.00050 to today’s price of $0.99997. The RSI today is around 50.79%, and the MACD indicates an expansion of the bullish trend.
Looking Ahead: Innovation and Stability Hand in Hand
Robinhood and USDC are not just individual market movements but part of an interconnected financial ecosystem. While Robinhood expands into prediction and financial entertainment markets, USDC solidifies its role as a reliable stablecoin, driven by regulation and institutional trust.
The combination of technological innovation, product diversification, and regulatory stability is redefining how we interact with markets. For investors, this is not just a trend—it is a clear signal that digital finance is evolving from an experiment into global infrastructure. Those who identify these opportunities could benefit from both growth in prediction markets and the widespread adoption of regulated stablecoins.
In short: Robinhood predicts, USDC supports, and the digital market moves toward a more integrated and secure future.
*******************************************************************************************
La información facilitada no constituye un análisis de inversiones. El material no se ha elaborado de conformidad con los requisitos legales destinados a promover la independencia de los informes de inversiones y, como tal, debe considerarse una comunicación comercial.
Toda la información ha sido preparada por ActivTrades ("AT"). La información no contiene un registro de los precios de AT, o una oferta o solicitud de una transacción en cualquier instrumento financiero. Ninguna representación o garantía se da en cuanto a la exactitud o integridad de esta información.
Cualquier material proporcionado no tiene en cuenta el objetivo específico de inversión y la situación financiera de cualquier persona que pueda recibirlo. La rentabilidad pasada y las estimaciones no sinónimo ni un indicador fiable de la rentabilidad futura. AT presta un servicio exclusivamente de ejecución. En consecuencia, toda persona que actúe sobre la base de la información facilitada lo hace por su cuenta y riesgo. Los tipos de interés pueden cambiar. El riesgo político es impredecible. Las acciones de los bancos centrales pueden variar. Las herramientas de las plataformas no garantizan el éxito.
1HOOD trade ideas
HOOD Momentum Setup — Buy $122 Calls
# 🚀 HOOD Weekly Options Trade Idea (2025-08-18)
📊 **TRADE DETAILS** 📊
* 🎯 **Instrument:** HOOD
* 🔀 **Direction:** CALL (LONG)
* 🎯 **Strike:** 122.00
* 💵 **Entry Price:** 0.67
* 🎯 **Profit Target:** 1.00 → 1.34 (+50% to +100%)
* 🛑 **Stop Loss:** 0.36 (\~46% premium)
* 📅 **Expiry:** 2025-08-22
* 📏 **Size:** 1 contract
* 📈 **Confidence:** 65%
* ⏰ **Entry Timing:** Market open
* 🕒 **Signal Time:** 2025-08-18 09:43:26 EDT
---
### 🔎 Quick Summary
* **Momentum:** Daily RSI 62 → bullish, but weekly RSI 82 → potential pullback risk
* **Options Flow:** Call/Put ratio 2.28 → strong institutional bullish positioning
* **Volume:** Weak weekly volume → trade with caution
* **Volatility:** VIX < 20 → favorable for options trading
* **Market Bias:** Moderate bullish overall

Party Over? Time to get back to senses!- NASDAQ:HOOD valuation is way stretched and it should correct to a reasonable valuation.
- This needs correction. Let's see how it folds out in next 6-12 months

TradeUSAsignals Recommendations
Supports and Resistances:
The main support level is around $100–$102, which forms a strong price base preventing further decline. The key resistance is near $112–$113, which needs to be broken for the uptrend to continue.
Relative Strength Index (RSI):
The RSI is near the neutral area or slightly above 50, indicating positive momentum without yet reaching overbought territory. This leaves room for potential price increases without immediate correction signals.
MACD Indicator:
The MACD shows positive signals with the gap between the fast and slow lines remaining in an upward direction, supporting the continuation of the bullish trend and current momentum strength.
Moving Averages:
The 50-day moving average lies below the current price, supporting the short-term upward trend.
The 100-day moving average also acts as support from a lower level, indicating a positive medium-term trend.
The 200-day moving average is well below the current price, reinforcing a strong long-term bullish trend.


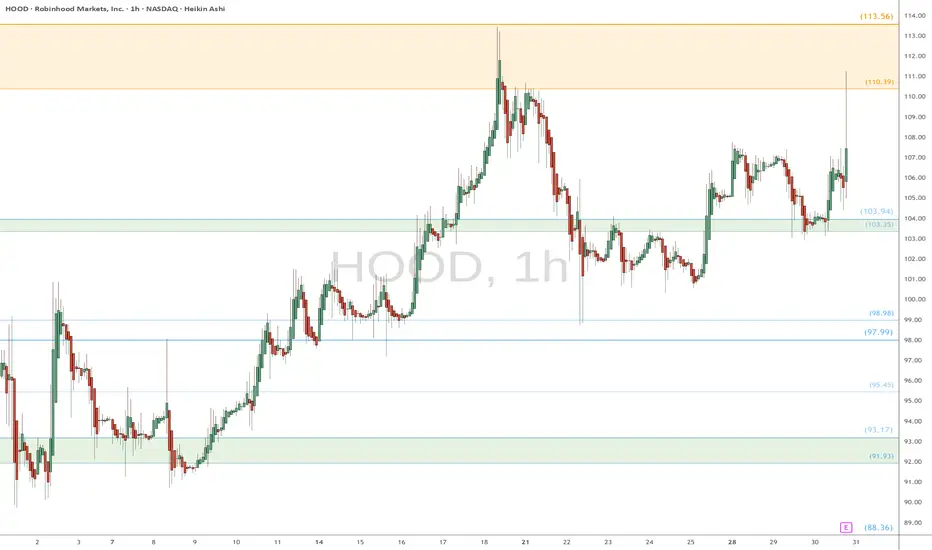
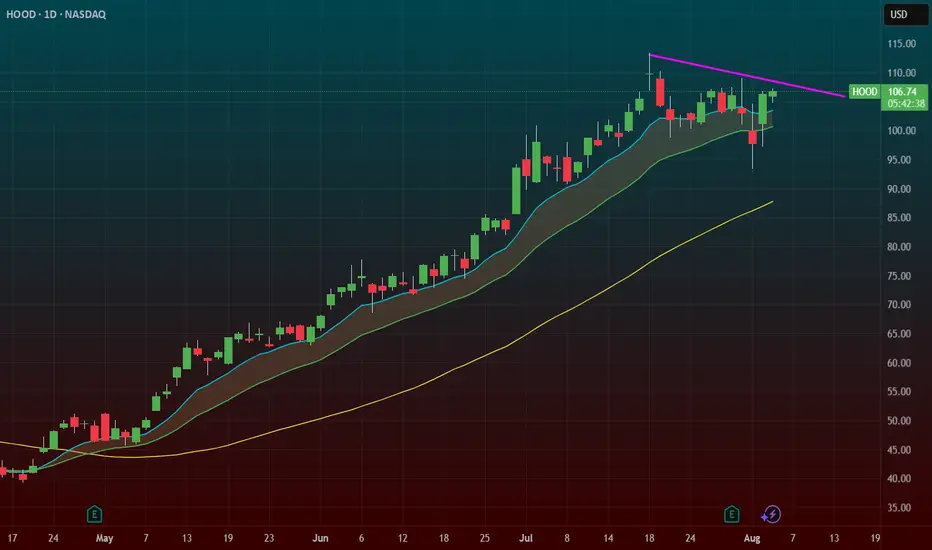
HOOD watch $110 then $113: Dual Golden fibs trying to TOP itHOOD has been a massive bull run since April lows.
Now battling a dual Golden fib zone $110.39-113.56.
Top of the zone is a well proven Golden Genesis fib.
See "Related Publications" for previous charts ------->>>>>>>
Such as this PERFECT catch of a serious bounce:
Hit BOOST and FOLLOW for more such PRECISE and TIMELY charts.
=========================================================
.
$HOOD 20ema Dip Buy! Over Reaction from $blsh ipoadded this 108.4 thinking this is an over reaction from the NYSE:BLSH ipo. I got a stop at low of days lets see if it picks up steam.

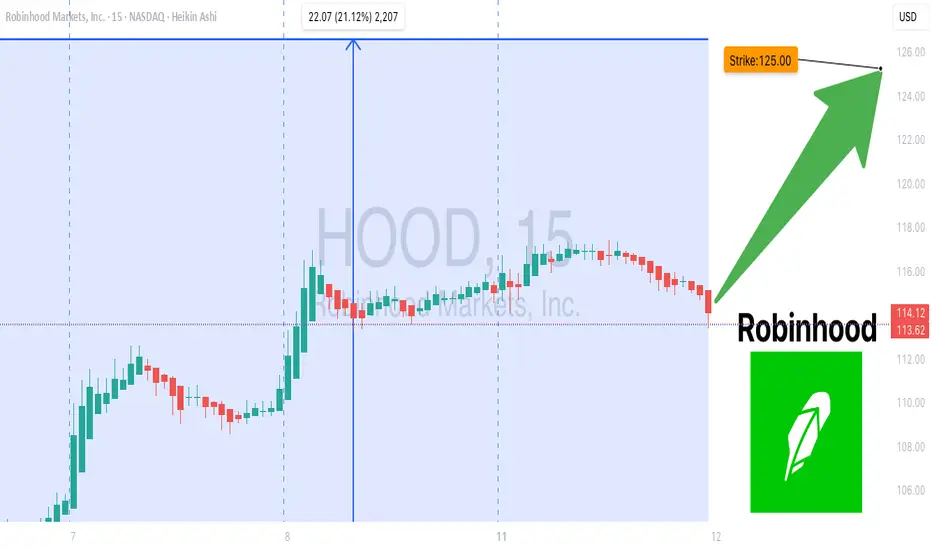
Get Ready: HOOD’s Bullish Wave Is Here — Ride It to Profit! 🚀 HOOD Weekly Options Play (08/11/2025) — Bullish Momentum Incoming! 🚀
**🔥 Key Signals:**
* **RSI:** Daily 70.6 / Weekly 80.1 — Strong bullish momentum
* **Options Flow:** Call/Put ratio at 2.41 — Heavy institutional call buying
* **Volatility:** VIX low at 15.54 — Perfect calm for upward moves
* **Volume Warning:** Weekly volume down 0.8x last week — Caution advised
---
**📈 Trade Setup:**
* **Trade:** Long Call
* **Strike:** \$125
* **Entry:** \$0.84 (market open)
* **Stop Loss:** \$0.42 (50%)
* **Profit Target:** \$1.68 (100%)
* **Expiry:** August 15, 2025
* **Risk:** Up to 3% of portfolio
---
**⚠️ Watch Out:**
Volume dip could challenge the move — stay alert & respect your stop!
Low volatility environment favors smooth upside moves.
---
**Summary:**
Strong bullish bias driven by institutional calls + momentum RSI — expect upside next week! Perfect time to ride the wave, but keep volume risk in check.
---
🔥 **Trade Smart, Trade HOOD!** 🔥
HOOD - Consolidation & Re-EntryLooking for a Healthy Consolidation for HOOD back to the $107s to get a better entry in positioning for the long-term stride, reclaim of support above the higher lever resistance that I estimate to usher in the beginning of that consolidation.

HOOD TIME FOR BOUNCE?HOOD on a 4 day pullback. Some big call flow just came in 105C 8/1/25 @ 4.40 $3.5 million in 4 orders.
HOOD Lifetime Setup--Will You Miss It Again?### 🟢 **HOOD Options Flow Explodes: 2.05 Call/Put Ratio Sparks Bullish Firestorm 🔥**
**Will \$114 Be Breached This Week? Smart Money Thinks So.**
📈 **HOOD Weekly Options Breakdown – Aug 5, 2025**
---
#### 🔍 Market Snapshot:
* **Total Calls**: 178,756
* **Total Puts**: 87,243
* **C/P Ratio**: 2.05 → **BULLISH**
* **RSI**: Daily – 60.2, Weekly – 77.3 → **Uptrend Confirmed**
* **Volume**: 1.5x Previous Week → **Institutional Flow Detected**
* **Gamma Risk**: 🟡 Moderate
* **VIX**: 17.5 → Ideal for Weekly Plays
* **Time Decay**: 🔥 Accelerating
---
### 🧠 Consensus:
✅ All models confirm **strong bullish momentum**
⚠️ Some debate: Is rising volume accumulation or distribution?
---
### 🎯 Recommended Trade Setup:
> **Naked Call – HOOD \$114C (Exp: 2025-08-08)**
* **Entry**: \$0.79
* **Stop Loss**: \$0.40
* **Profit Target**:
* 🥇 Base: \$1.03 (+30%)
* 🥈 Stretch: \$1.58 (+100%)
* **Confidence Level**: 80%
* **Timing**: Enter @ market open
---
### 🔖 Tags (Hashtags for TradingView & Socials):
`#HOOD #OptionsFlow #CallOptions #BullishSentiment #WeeklyOptions #TradingStrategy #VolumeBreakout #RSI #Gamma #Robinhood #SmartMoneyMoves #HOODTradeIdea #TechnicalAnalysis #StockOptions #ViralTradeSetup`
$HOOD – Flag Breakout Setup with Post-Earnings Shake & BakeNASDAQ:HOOD – Hot Momentum + Crypto Tailwind + Flag Breakout in Motion
Robinhood ( NASDAQ:HOOD ) is setting up for a momentum breakout after delivering a perfect post-earnings shake & bake — and now it’s reclaiming key levels with force.
🔹 The Setup:
After earnings, NASDAQ:HOOD flushed under $100, shaking out weak hands and triggering stop runs.
Since then, it's remounted the moving averages and is now pushing through the $107 breakout zone.
Price is flagging cleanly — compression before expansion.
🔹 Why It’s Got Juice:
Strong bounce post-earnings = real buyer interest.
Flag breakout forming with crypto sector strength ( CRYPTOCAP:BTC , CRYPTOCAP:ETH running).
NASDAQ:HOOD often rides crypto momentum — it’s a sleeper sector sympathy play.
🔹 My Trade Plan:
1️⃣ Position: Picked up $105 calls on the morning dip.
2️⃣ Add: Eyeing $110 calls with a few weeks out if we clear the flag.
3️⃣ Stop: Under today’s low or 9 EMA, depending on how it behaves into the breakout.
Why I Like It:
Shakeout + reclaim = powerful combo.
Flag structure is clean, volume is stabilizing, and crypto sector tailwinds add fuel.
When NASDAQ:HOOD runs, it runs fast — and it loves trending when sentiment flips.
Hood Targeting The Hights
📈 **HOOD BULLISH SETUP - WEEKLY TRADE IDEA (08/03)** 📈
**Ticker:** \ NASDAQ:HOOD | **Bias:** 🟢 *Moderate Bullish*
🔁 **Call/Put Ratio:** 2.13 = **Strong Bullish Flow**
💼 **Volume:** 166K Calls vs. 78K Puts = Institutional Interest
📉 **Gamma Risk:** LOW | ⏳ **Time Decay:** Moderate
🔥 **TRADE SETUP** 🔥
• 💥 **Buy CALL @ \$109**
• 💰 *Entry:* \$0.85
• 🎯 *Target:* \$1.70 (100% ROI)
• 🛑 *Stop Loss:* \$0.43
• ⏰ *Expiry:* 08/08/25 (5DTE)
• 🧠 *Confidence:* 65%
• 📈 *Size:* 5 contracts
• 🕒 *Entry Timing:* Market Open
💡 **Why it matters:**
Despite mixed RSI and conflicting trend models, **massive call volume + low gamma risk** supports a short-term breakout play.
📌 **Watch for confirmation at open. Tight risk/reward. High upside if momentum holds.**

$HOODif the next couple of months get ugly my plan on NASDAQ:HOOD though nice bounce off support so far
Hood 5th wave looks toppyHood is one of my larger holdings and I have been riding the wave waiting for a pullback for months. I believe the time is now. This is chart I posted elsewhere that I forgot to share here. I think 65$ is a real possibility. The last four pullbacks were all over 40%. Not the stochastic monthly is starting divergence and the BBWP has remained elevated for a long time.
My plan:
Sit on my shares.
Close my covered calls into 2027 if we dump a lot
Buy zone between 65-75$

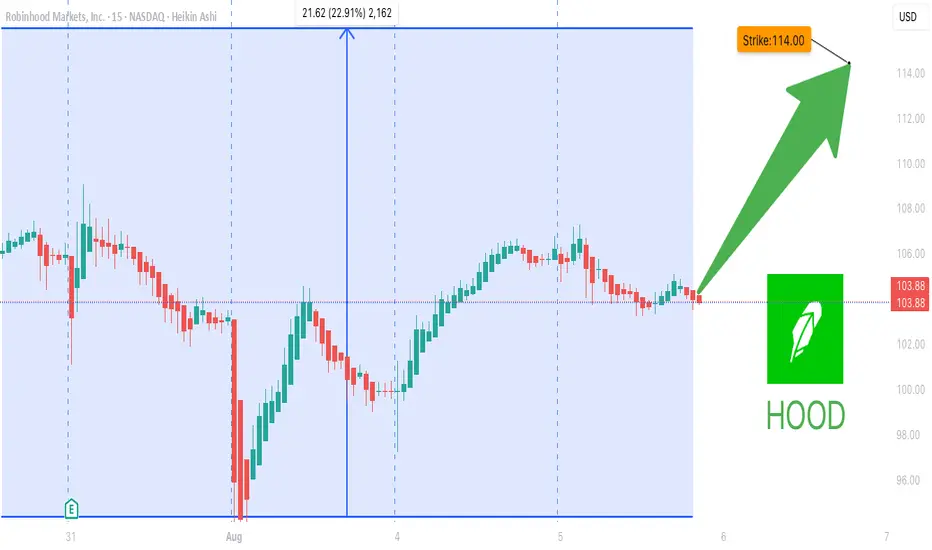
HOOD WEEKLY OPTIONS TRADE (7/31/25)
### ⚡️HOOD WEEKLY OPTIONS TRADE (7/31/25)
📈 **Setup Summary**
→ Weekly RSI: ✅ Rising
→ Daily RSI: ❌ Falling (⚠️ Short-term pullback risk)
→ Call/Put Ratio: 🔥 **1.89** (Bullish flow)
→ Volume: 📉 Weak — fading conviction
→ Gamma Risk: 🔥 High (1DTE)
---
💥 **TRADE IDEA**
🟢 Direction: **CALL**
🎯 Strike: **\$110.00**
💰 Entry: **\$0.82**
🚀 Target: **\$1.62** (+100%)
🛑 Stop: **\$0.41**
📆 Expiry: **Aug 1 (1DTE)**
🎯 Entry: Market Open
📊 Confidence: **65%**
---
🧠 **Quick Insight:**
Mixed signals = *Scalper’s Playground*
✅ Weekly trend favors upside
⚠️ Weak volume & daily RSI divergence = TRADE LIGHT
---
📌 Posted: 2025-07-31 @ 11:53 AM ET
\#HOOD #OptionsTrading #WeeklyPlay #GammaScalp #TradingViewViral #HighRiskHighReward

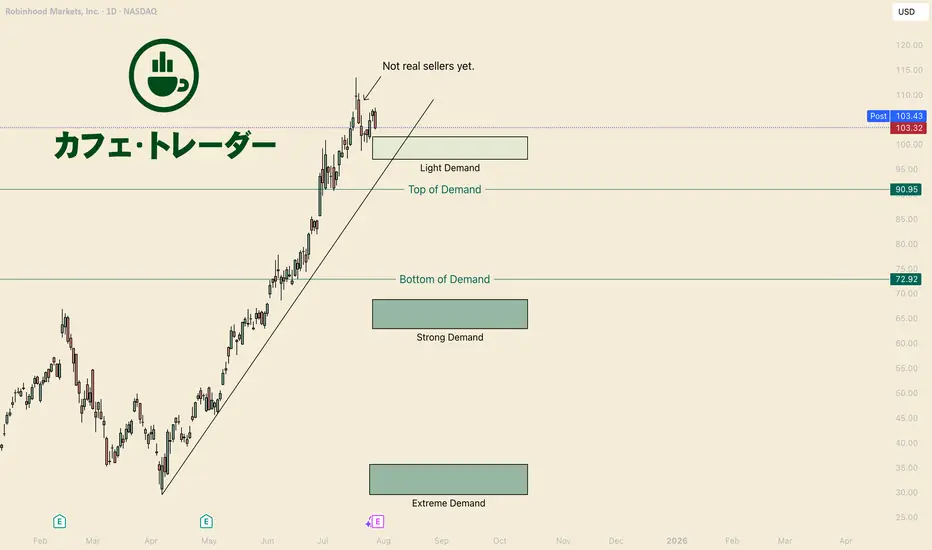
How to Buy HoodHello I am the Cafe Trader.
Since visiting that Extreme Demand back in April, Robinhood has essentially moved strait up.
If you have not seen my previous post on HOOD, we were able to identify EXACTLY where the buyers were. I strongly encourage you take a look at that article.
Today I'm going to give you a Short Term and Long Term perspective.
Short Term
What we do Know
"Light Demand" have the most aggressive Bulls, but we have to assume that they are the most fragile .
We know this selling hasn't been shown to be an aggressive Bear yet. This also assumes there is no reason to short this until sellers gain some control.
1) With these things in mind: Until the trend breaks or bears close below the "Light Demand" zone, II find no reason, and would even say its daring to short HOOD.
2) Yes it's overextended when it comes to a channel, a fib, an MA... No one can confidently tell you where the top is. Unless you are looking at the footprint seeing an absurd amount of absorption IMO.
With these things in mind, all I can say is to be patient, and wait for the market to give you more information that you can do something with.
Day Traders like myself will have the best odds to make intra-day plays, but that's not this articles focus.
Long Term
If you got in early and you are still holding, Great work!
for those who feel like they missed the move, or are looking to add some to your long term, don't worry we are position you for success.
This list of areas is according to your personal sentiment. The "Good Price" is where I think they best position is going to be.
Hyper Aggressive = 97.50 - 101.50 (Light Demand)
Aggressive = 91 (Top of Demand)
Good Price = 62 - 68.5 (Strong Demand)
STEAL = 31.50-36.50 (Extreme Demand)
Exciting times for HOOD! I am bullish myself, and I hope to see better and bigger things from Robinhood.
Thank you for reading, Follow for more evaluations and live trades.
Happy Trading!
@thecafetrader
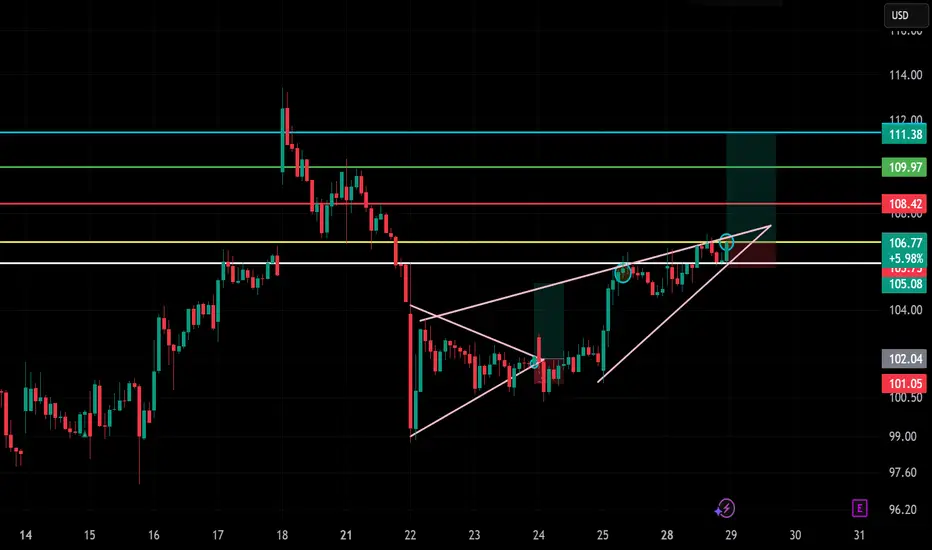
Trade Setup: LONG on HOOD!📈
🕰️ Timeframe: 30-minute chart
🔍 Pattern: Ascending wedge breakout
📉 Previous Trend: Bullish continuation from bottom
🧭 Setup: Breakout retest and continuation toward resistance zone
🧩 Technical Breakdown:
Breakout Zone:
Wedge breakout confirmed around $106.00–106.50
Current price near $106.77, retesting breakout (bullish)
Support Zone:
$105.00–105.50 (yellow zone and wedge bottom)
Resistance / Target Zones:
TP1: $108.42 (red zone — recent rejection area)
TP2: $109.97 (green zone — supply)
TP3: $111.38 (cyan line — extended target)
Stop Loss:
Below $104.50–105.00, just under wedge base or yellow zone
Risk-Reward Estimate:
~1:2 to 1:3 R:R, depending on entry near $106 and target at $109–111
⚠️ Key Watchpoints:
Price holding above breakout line and yellow support zone
Momentum volume increasing (not shown in image, but essential)
Clean move past $108.50 can unlock $111
✅ Summary:
HOOD is setting up a momentum continuation play from an ascending wedge breakout. If the price sustains above $106, it has room to run toward the $109–$111 zone. Solid bullish structure with breakout + retest = high-probability long.
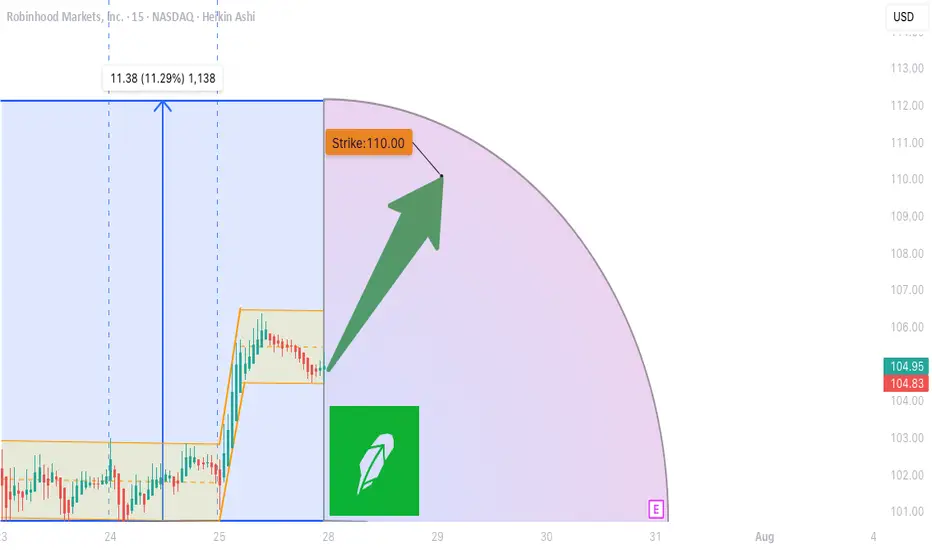
HOOD WEEKLY TRADE IDEA (07/27/2025)
**🚨 HOOD WEEKLY TRADE IDEA (07/27/2025) 🚨**
**BULLISH OPTIONS FLOW MEETS EVENT RISK CAUTION**
📊 **Options Flow Snapshot:**
📈 **Call Volume > Put Volume**
🧮 **Call/Put Ratio: 2.30** → **Institutional Bullish Flow**
📈 **Momentum Readings:**
* 🟢 **Daily RSI: Bullish**
* 🟡 **Weekly RSI: Mixed to Weak**
➡️ *Momentum is short-term positive, but not confirmed long-term*
📉 **Volume Insight:**
* **Only 0.7x** last week’s volume
➡️ *Lack of participation = ⚠️ caution*
🌪️ **Volatility Environment:**
* ✅ **Low VIX = Great Entry Timing**
* ❗ Fed Meeting ahead = Binary Event Risk
---
🔍 **Model Consensus:**
All 5 models (Grok, Claude, Gemini, Meta, DeepSeek) say:
🟢 **Moderately Bullish Bias**
✅ Bullish options flow
✅ Daily RSI uptrend
⚠️ Weak volume + Fed caution
---
💥 **TRADE SETUP (Confidence: 65%)**
🎯 **Play:** Long Call
* **Strike**: \$110
* **Expiry**: Aug 1, 2025
* **Entry**: ≤ \$2.90
* **Profit Target**: \$5.80 (🟢 100%)
* **Stop Loss**: \$1.47 (🔻50%)
📆 Entry: **Market Open Monday**
📦 Size: 1 Contract
📈 Risk-Reward Ratio: \~1:2
---
🧠 **Key Risks:**
* 📉 Volume Weakness = No confirmation
* ⚠️ **FED Event Risk** = Watch for Wednesday volatility
* ⏳ Theta decay as expiry nears
---
📌 **JSON TRADE DETAILS (for bots/scripts):**
```json
{
"instrument": "HOOD",
"direction": "call",
"strike": 110.0,
"expiry": "2025-08-01",
"confidence": 0.65,
"profit_target": 5.80,
"stop_loss": 1.47,
"size": 1,
"entry_price": 2.90,
"entry_timing": "open",
"signal_publish_time": "2025-07-27 15:09:35 EDT"
}
```
---
🔥 Stay sharp. Ride the flow, respect the risk.
👀 Watch volume + Fed headlines!
💬 Tag your team: \ NASDAQ:HOOD Bulls loading?
\#HOOD #OptionsTrading #UnusualOptions #FedWeek #WeeklyTradeSetup #TradingView #StockMarket
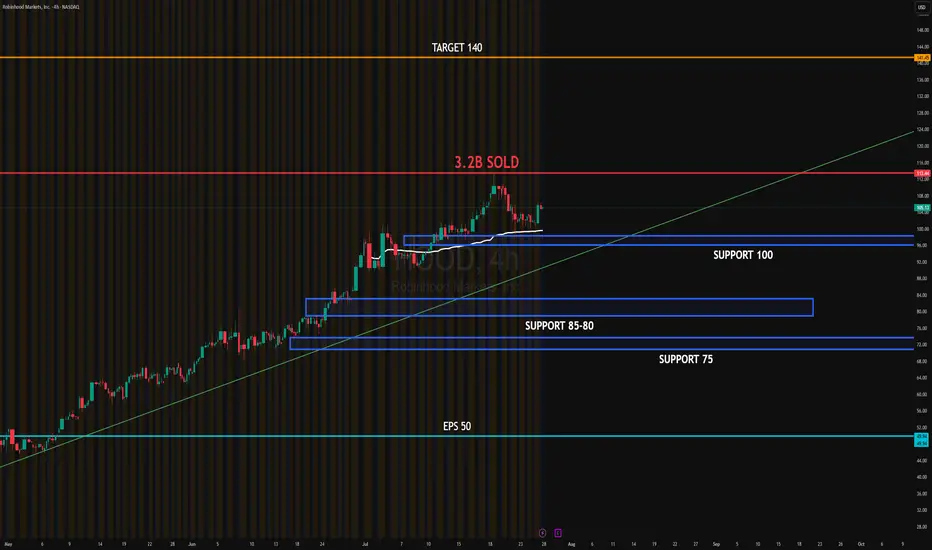
HOOD EARNINGSHOOD is holding the 100 support zone after a high-volume sell zone near 114 from a $3.2B unload. Market makers defended the 100 level with PUT selling, suggesting institutional absorption. Price is consolidating above trendline support and may trigger a gamma squeeze if it breaks above 106 with volume.
Upside target: 140
Downside target: 100, then 85–80 if broken
#HOOD #globaltrade #investment #investing #stockmarket #wealth #realestate #markets #economy #finance #money #forex #trading #price #business #currency #blockchain #crypto #cryptocurrency #airdrop #btc #ethereum #ico #altcoin #cryptonews #Bitcoin #ipo
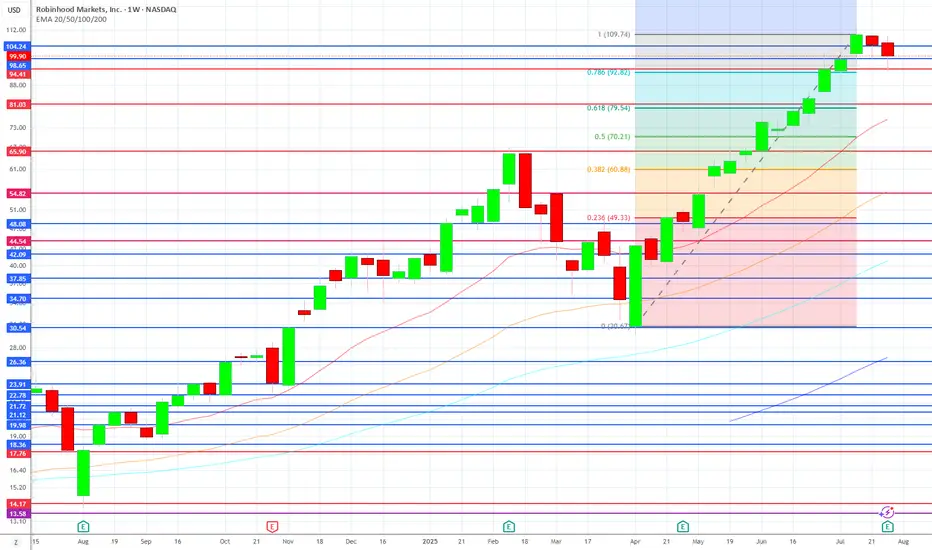
Everyone's Bullish On Robinhood - But Its Time To SellRobinhood NASDAQ:HOOD has seen an incredible rally over the past year, rising more than 500% since August 2023. Much of this surge has been driven by renewed crypto enthusiasm—sparked by Circle’s IPO—and Robinhood’s aggressive push into new products across fintech and crypto.
But despite strong financial performance, we now believe the stock has run too far, too fast.
💰 Strong Fundamentals, But Slowing Growth
Robinhood’s recent financials are undeniably impressive:
Trailing 12-month revenue: $3.27B (up ~60% YoY)
Net income: $1.59B
Operating income: $1.2B
Revenue from commissions and interest income has outpaced expenses, resulting in high margins. But looking ahead, earnings-per-share (EPS) growth is expected to slow. Analysts forecast mid-teens EPS growth in 2026 and 2027, with a potential dip this year as one-time tax benefits roll off.
Robinhood Gold, the company’s premium service, is growing steadily (ARR projected to top $250M this year), but it’s still a small slice of total revenue.
🛠️ Product Expansion or Strategy Drift?
Robinhood is launching a wide array of new offerings—from robo-advisors and AI tools to crypto products in Europe and futures trading in the U.S.
The issue? These launches feel disjointed. U.S. users get a full-featured experience with stocks, options, crypto, and banking tools. UK users are limited to U.S. stock trading, with balances held in USD. In Europe, Robinhood leans heavily into crypto.
While the company claims it’s building a “global financial ecosystem,” the rollout has been inconsistent and confusing. This scattered approach may dilute brand clarity and user trust.
📊 Valuation: Sky-High and Hard to Justify
At current prices, HOOD trades at:
26x revenue
54x trailing earnings
74x forward earnings
At over 45x FY3 earnings, higher than fintech peers like SoFi (29x), Etoro (20x), and Interactive Brokers (27x)
The only comparable valuation is Coinbase (COIN), which has a more dominant position in crypto and stronger institutional traction. Given that most of HOOD’s revenue still comes from traditional brokerage services, this crypto-fueled valuation seems overblown.
🚨 Bottom Line
Robinhood remains a promising long-term company, but its stock looks overheated. Slowing earnings growth, a scattered international strategy, and a sky-high valuation point to limited upside from here.
Verdict: Sell
Investors sitting on big gains may want to take some profits while the euphoria lasts.

Using the Fractal Alligator IndicatorAccording to the Fractal Alligator in TradingView, we have come to a top/peak of HOOD stock price.
Using a 4 hour chart we can clearly see that green triangle, marking our top.
However when viewing the daily chart, there is no "top" green triangle.
This indicator is great, if you try it on different timeframes.
Give it a try and comment here for more feedback on this indicator.

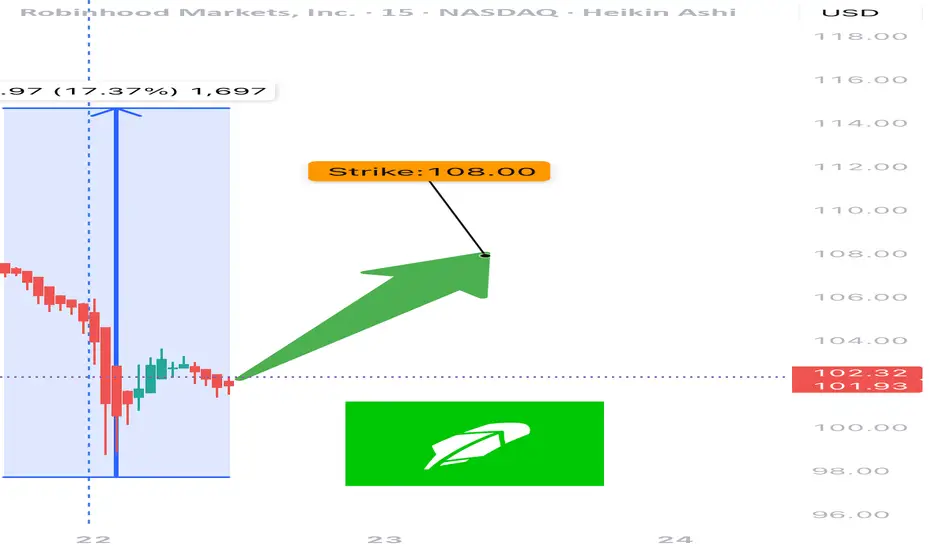
HOOD Weekly Options Setup – July 22, 2025
🔥 NASDAQ:HOOD Weekly Options Setup – July 22, 2025
Moderate Bullish Flow | RSI Divergence | 3DTE Tactical Setup
⸻
🧠 Summary Thesis:
While the call/put ratio (1.42) and favorable VIX (16.9) suggest bullish sentiment, fading RSI and neutral volume raise tactical caution. This setup is not for passive traders — it’s for those managing risk and chasing reward with intention.
⸻
📊 Trade Details
• Instrument: NASDAQ:HOOD
• Direction: CALL (Long)
• Strike: 108.00
• Entry: $0.89
• Target: $1.50 – $2.00
• Stop Loss: $0.45
• Expiry: 07/25/25 (3DTE)
• Position Size: 2.5% of portfolio
• Confidence: 65%
• Entry Timing: Market Open
⸻
🔍 Technical + Options Context
Signal Type Status
📈 Call/Put Ratio ✅ Bullish (1.42)
💨 VIX ✅ Favorable (16.9)
🔻 RSI ❌ Falling – Weak Momentum
🔇 Volume Ratio ⚠️ Neutral (1.0x)
⚡ Gamma Risk ⚠️ Moderate – 3DTE decay
⸻
📍 Chart Focus
• Resistance Zone: $108–$109
• Put Wall Support: $100 (OI heavy)
• Watch for: RSI divergence, gamma squeeze attempts
⸻
📢 Engagement Hook / Caption (Use on TV or X):
” NASDAQ:HOOD bulls are pushing 108C into expiry. Volume’s flat, RSI’s falling — but gamma might still flip the board. Risk-defined lotto or fade?”
💥 Entry: $0.89 | Target: $1.50+ | Expiry: 07/25/25 | Confidence: 65%
⸻
🎯 Who This Trade Is For:
• Short-term option scalpers looking for 1.5–2x payoff
• Traders able to manage theta/gamma into late-week expiry
• Chartists watching RSI divergence vs options flow tension
⸻
💬 Want a debit spread version, an OTM gamma scalp, or my top 3 lotto setups this week? Drop a comment or DM. I share daily flow breakdowns and AI-verified trade ideas.
⸻
This format hits all key signals:
• Informative enough for serious traders
• Viral hook for social platforms
• Clear CTA for engagement & leads