MSTR HIGH PROBABILITY BIG BULL MOVE SOON!!!🚨 MSTR HIGH PROBABILITY BUY SETUP 🚨
* Here We Can See Clearly The Next Potential Moves For MSTR Coming Hours/Days.
* Keep Your Eyes Close On Your Trading Positions.
* Happy PIP Hunting Traders.
FXKILLA.
Trade ideas

MSTR - How to profit from a $140 short target🔱 The MS ponzi is taking its toll. 🔱
I’m not laughing, because it’s genuinely unfortunate for everyone who believed in this scam.
But today, I don’t want to rant about that.
I want to show how one could profit from a potential drop of more than $100.
As an Andrews Pitchfork trader, I know there’s roughly an 80% chance that price will reach the centerline. From there, price either reverses in the opposite direction or breaks through the centerline to continue its journey.
That’s exactly what happened with MSTR.
You can see how the price first reached the centerline, held there a few times, and then broke it. Since then, it’s been following the rulebook by moving further to the downside.
Now, there’s another rule worth remembering:
price often tests or retests the line it just broke.
In our case, that line is the centerline.
This means we could be lucky enough to get a pullback to the centerline, and that would be a good level to consider shorting.
The target is usually the opposite line of the centerline, which in our case is the L-MLH (Lower Median Line Parallel).
👉 If you want to learn the full framework and its rules, check the links for free material.
I hope this helps many of you, and I wish you all good profits.

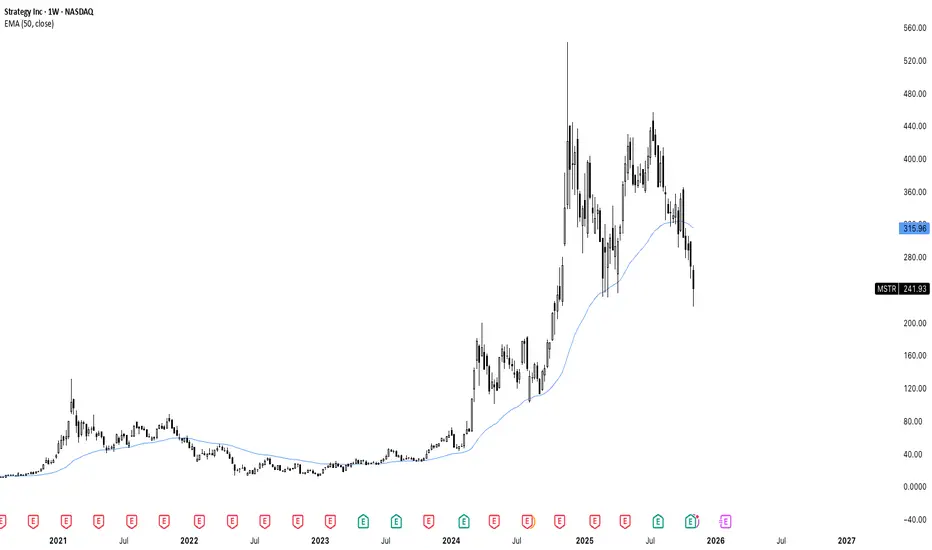
Microstrategy is who Satoshi warned us about. MSTR has broken below the 50 day moving average and is now at 52 weeks low. All while they hold the most bitcoin they ever have, now at 641,000 BTC. Some would even say they are trying to corner the market, using debt - while they claim they will never sell, but also they are not even earning any yield on their holdings. They will owe over $600 million in dividend payments next year. You simply can not create value out of thin air. NASDAQ:MSTR
$MSTR still bullish at supportstrategy has lately been underperforming compared with simular assets. It's stuck in this arc and the diagonal line. When it finds support and breaks the arc you will teleport to the next arc. This gets invalidated when breaking to the downside!

$MSTR Bullish Shark Harmonic completedNASDAQ:MSTR : C wave of this ABC correction has gone beyond A, meeting the requirements of an ABC flat correction. Bullish Shark Harmonic also looks complete.

MSTR TRADES UP 1X FOR EVERY BTC UP, BUT 3-4X DOWN WITH BTCMSTR is dead. the "Leverage"is 3-4x down for btc movement, but only 1x up for btc movement
the degradation of how far below each btc ath is also getting worse, it has doubled since the last btc ath.

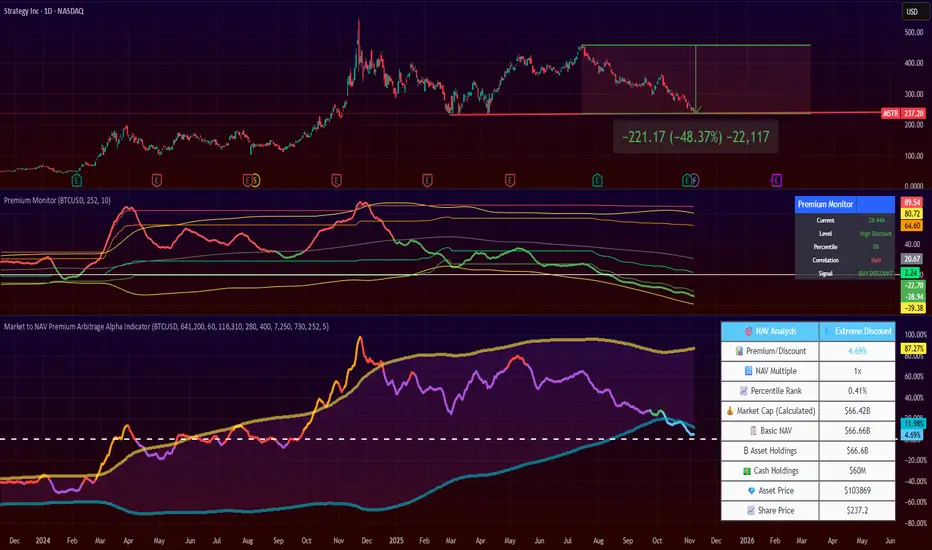
Strategy's Premium is Gone. Time to Load? 4 months ago, I posted that NASDAQ:MSTR premium was unsustainable and the stock price would drop.
Since then, the price dropped by 50%!!
Now, Strategy's is close to zero, and I flip my views on it.
If you like this kind of trade, it might be a good time to start DCA'ing it.
Note that Strategy continues to be a highly volatile stock, more volatile than Bitcoin itself.
Finally, the stock is now at a technical resistance level.
You can keep an eye on the premium/discount of this stock by looking at my 2 indicators:
Market to NAV Premium Arbitrage Alpha Indicator , and
Asset Premium/Discount Monitor
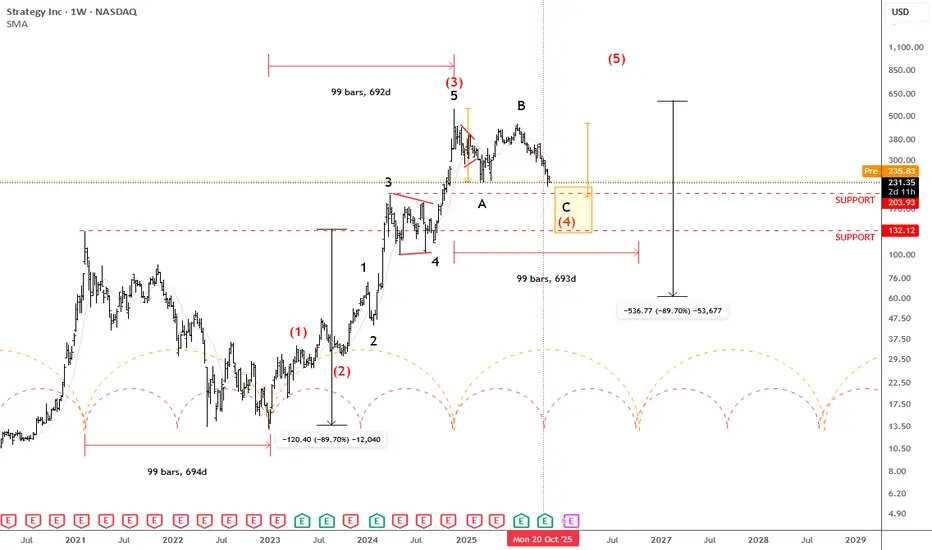
MSTR Trading Close To Support Based on Elliott wave and CyclesMicroStrategy has seen a strong uptrend since the December 2022 lows, but over the last year the market has been in a retracement phase. It appears that this could be another A-B-C setback within a higher-degree wave four, where subwave C could potentially retest the 200 area, or even extend toward the deeper 132 support. That level also aligns with the February 2021 high, making it an important zone to watch.
Cycle-wise, it looks like we’re currently in the middle of a full cycle, suggesting that the correction could be moving into second half of this retracement, and may come to an end within the next few months. Ideally, we could then see a new turn higher in 2026, continuing the broader bullish trend.
Highlights:
Trend: Corrective pullback in wave four
Support: 200 / 132
Cycle View: Mid-cylce; possible new rebound early 2026
Note: Structure fits within a broader five-wave bullish sequence, with strong long-term trend intact
GH
MicroStrategy - Mean ReversionAfter a choppy but still successful call on MSTR in Feb, we are back with another one. Heavily oversold and ready to shoot alongside $BTC.

MicroStrategyBitcoin.
Still lots of downside left on the table for Saylor's MicroStrategy.
More time required before any type of lower risk entry point morphs into existence.

MSTR pull back a buying opportunityMSTR checking key supports.
Respects the trend started 2 years ago, revisiting a historical RSI low, only seen back in June 2022.

$MSTR: AB = CD target almost reachedNASDAQ:MSTR : the AB = CD targets $233 and today's low is $236.86. Very close. If NASDAQ:MSTR can bounce here, or fake breakdown to 233 or lower than bounce back, it would be good for Bitcoin. I don't own NASDAQ:MSTR shares and don't plan to trade this name. I'm looking at NASDAQ:MSTR as another data point to gauge bitcoin.
435This channel is not providing individualized trading or investment advice, nor is it a banking service, brokerage service, trading service, investment service or money management service

MSTR further downside but looking exhaustedNASDAQ:MSTR Price continues range bound in a complex wave 4 correction, notoriously hard to analyse. The trend is down but looks exhausted.
Wave Y can complete any time in this flat correction pattern but is approaching the previous swing low and the 0.236 Fibonnacci retracement.
Daily RSI has printed bullish divergence but price continues lower. IF pice breaks down further the next target is $185 where price may find a bottom.
Recovering the daily 200EMA is the first goal.

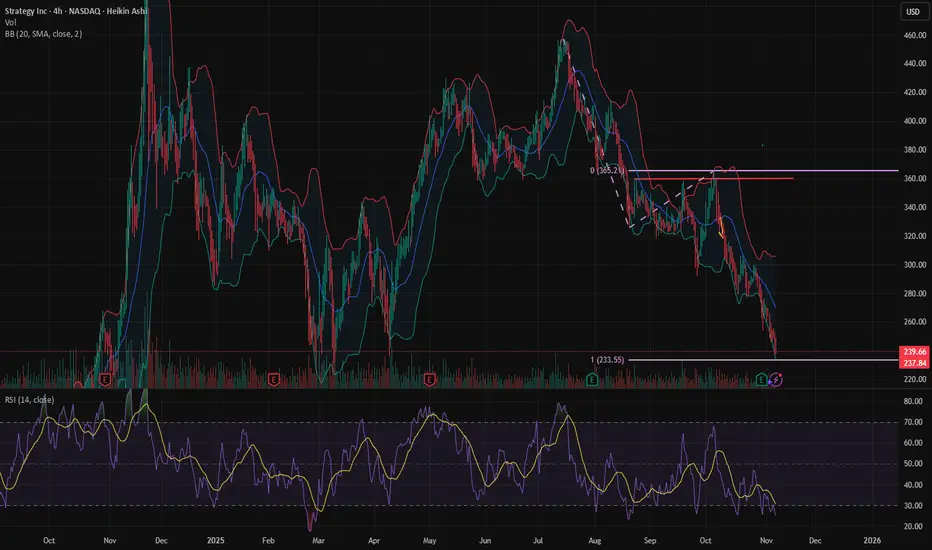
History Seems to Be Repeating on MSTR
Lately, I’ve been noticing something interesting on MicroStrategy (MSTR) — the price action appears to be forming a structure very similar to what we saw earlier in the chart.
⸻
🟨 Repeating Consolidation Zones
Looking back, the first highlighted zone (around early 2024) shows how price moved sideways for a while after a strong rally. That consolidation eventually resolved in a sharp move upward once momentum returned.
Now, if we look at the current structure (mid-to-late 2024 into 2025), the setup looks quite familiar. After another strong upward phase, price has again been consolidating in a broad range roughly between $250 and $450.
⸻
🧩 Observing the Fractal Behavior
This kind of repeated structure—where a period of consolidation follows a strong expansion—often suggests that market participants are adjusting to previous volatility and finding equilibrium before the next major phase.
While past movements don’t predict future outcomes, it’s interesting to note how similar the rhythm of this current range is compared to the previous one. It almost feels like the market is “echoing” its earlier behavior.
⸻
🔍 Key Points I’m Watching
• The lower area of this range (around $230–$250) has acted as an important zone of interest before.
• The upper boundary near $425–$450 has repeatedly capped upward movement.
• How price behaves between these levels may give insight into the broader structure of the trend.
⸻
🕰️ Final Thoughts
This analysis isn’t a prediction or a recommendation — just an observation of how patterns sometimes reappear in the market.
Whether or not this current range resolves in a similar way to the last one remains to be seen, but the repetition in structure and timing is fascinating from a technical perspective.
Markets often rhyme, and MSTR might just be showing another verse of a familiar song. 🎵

$MSTR bounce above $300 before falling further?Ever since Early October, MSTR has been falling. We've now reached the bottom of a flag structure and I'd expect a bounce here before we fall further.
I think the most likely path from here is that we see a rally into the $300 zone, however, it's possible that we can go up to the top of the flag before falling further.
That said, if we get a rally, it'll be a rally you want to sell because eventually I think we're heading down to the $100 level before you want to become a long term buyer.
I've marked off key resistances on the path up to take profits on a long, should the rally play out from here.

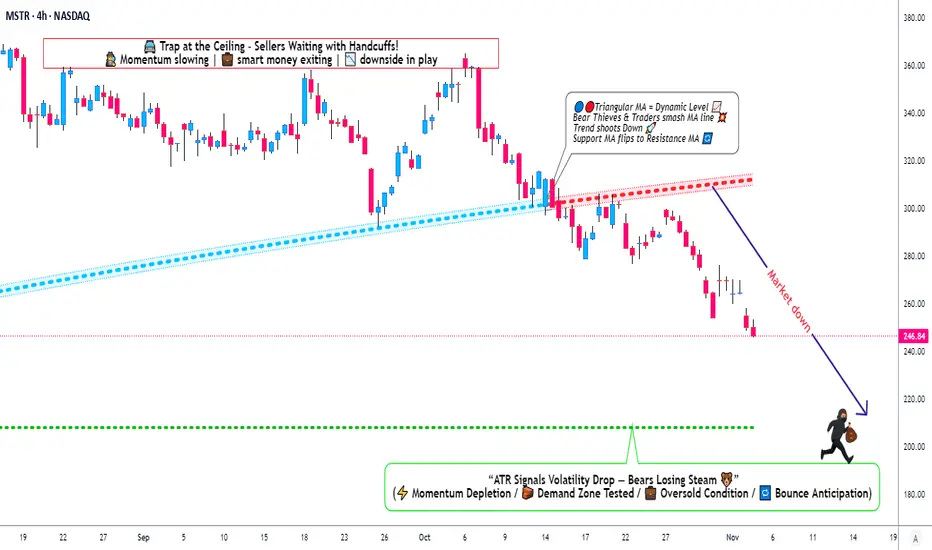
MicroStrategy Under Pressure: Bearish Playbook in Action🎯 MSTR: The "Thief's Playbook" - Strategic Bear Trap Setup! 💰🔥
📊 Asset Overview
MicroStrategy Inc. (MSTR) - Bitcoin's Proxy Play in the Stock Market
🎭 The Setup: When Bears Come to Party
Alright folks, gather 'round! We've got ourselves a textbook triangular moving average breakdown on MSTR that's screaming "short opportunity" louder than my portfolio after a bad trade week! 😅
Current Market Sentiment: 🐻 BEARISH CONFIRMED
The technicals are aligning like planets before a lunar eclipse - and trust me, this eclipse might cast some shadows on those long positions!
🎯 The "Thief Strategy" Game Plan
🚪 Entry Zones - The Layering Approach
Here's where it gets spicy! 🌶️ Instead of going all-in like a degen at a casino, we're using the "Thief Layering Method" - multiple limit sell orders to scale into this position:
Suggested Entry Layers:
🥇 Layer 1: $300
🥈 Layer 2: $290
🥉 Layer 3: $280
💎 Layer 4: $270
🔥 Layer 5: $260
Pro Tip: You can add MORE layers based on your risk appetite and account size. More layers = Better average entry = Smoother sleep at night! 😴
🛡️ Risk Management - The "Oh Sh*t" Line
Stop Loss: 🚨 $320
⚠️ IMPORTANT NOTICE: Dear Thief OGs, Ladies & Gentlemen! This SL is MY line in the sand. YOU need to decide YOUR own risk tolerance. Trade at your own risk, manage your own money, and don't blame me if things go sideways! This ain't financial advice - it's entertainment with charts! 🎪
🎁 Target Zone - Where We Cash Out
Take Profit Target: 🎯 $210
Why $210?
💪 Strong historical support level
📉 Oversold territory expected
Classic bull trap zone where longs get liquidated
⚠️ ANOTHER IMPORTANT NOTICE: Thief OGs! This is MY target. You do YOU! If you see profits earlier and want to secure the bag - DO IT! Don't be greedy. Take profits when YOU feel comfortable. Your account, your rules, your responsibility! 💼
🔗 Related Assets to Watch - The Correlation Game
Keep your eyes on these bad boys for confirmation:
📈 Direct Correlations:
NASDAQ:MARA (Marathon Digital) - Bitcoin miner, moves with crypto sentiment
NASDAQ:RIOT (Riot Platforms) - Another BTC miner, similar volatility pattern
NASDAQ:COIN (Coinbase) - Crypto exchange, sentiment indicator
CRYPTOCAP:BTC (Bitcoin spot) - The godfather! MSTR holds massive BTC, direct correlation
🧠 Key Points:
MSTR trades with ~1.5x-2x Bitcoin beta (more volatile than BTC itself)
When Bitcoin dumps, MSTR often dumps HARDER 📉
Watch BTC support at $60K - if it breaks, MSTR likely follows to our target zone
Tech sector weakness ( NASDAQ:QQQ , AMEX:SPY ) adds bearish pressure
⚡ Trading Psychology - The "Thief Mindset"
Look, this setup requires PATIENCE! 🧘♂️ Don't FOMO in at market price. Layer in like a professional thief planning a heist - calculated, methodical, strategic! This isn't gambling; it's probability management with a side of humor! 😎
🎪 Final Word from Your Friendly Neighborhood Chart Thief
Remember: Markets are wild, unpredictable, and don't care about your feelings OR your bills! This analysis is for educational and entertainment purposes ONLY. The "Thief Strategy" is MY trading style - it's risky, it's aggressive, and it's definitely NOT for everyone!
Do your own research. Manage your own risk. Trade what you can afford to lose. And for the love of all that's holy, don't mortgage your house based on some random internet chart analysis! 🏠❌
✨ If you find value in my analysis, a 👍 and 🚀 boost is much appreciated — it helps me share more setups with the community!
🏷️ #MSTR #MicroStrategy #ShortSetup #BearishBreakdown #SwingTrade #DayTrade #ThiefStrategy #BitcoinStocks #TechnicalAnalysis #MovingAverageCrossover #LayeringStrategy #RiskManagement #StockMarket #TradingIdeas #BTC #CryptoStocks #BearTrap #SupportAndResistance #ChartAnalysis #TradeSmart
🎯 Trade smart, layer in, manage risk, and may the profits be ever in your favor! 💰🚀
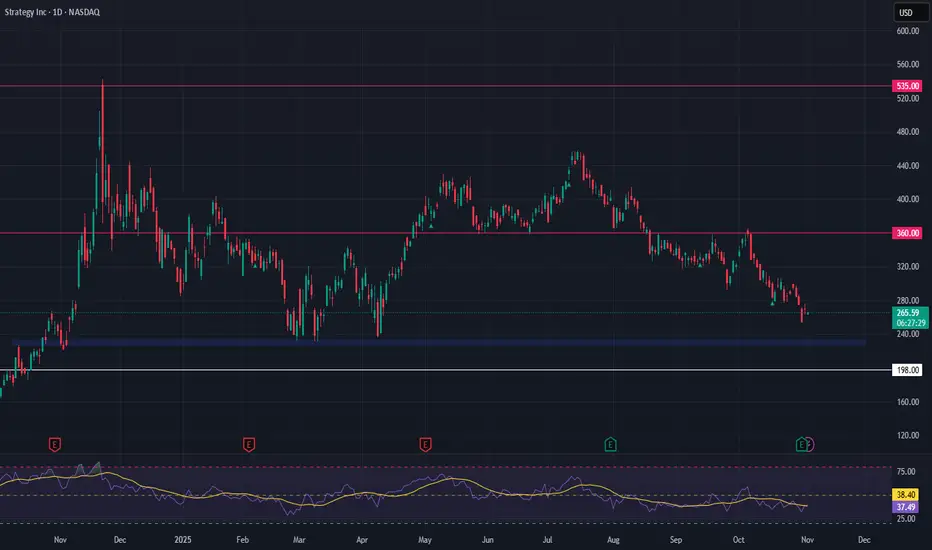
Strategy Inc (MSTR) – High-Beta Bitcoin Proxy at Key SupportStrategy Inc NASDAQ:MSTR has delivered another strong quarterly report, underscoring its continued commitment to aggressive Bitcoin accumulation. With over 158,000 BTC on the books, MSTR has firmly positioned itself as a leveraged proxy for Bitcoin, offering equity traders indirect crypto exposure. This bold balance sheet strategy has also pushed MSTR into alignment with S&P 500 inclusion criteria — a potential catalyst if index inclusion materializes.
Technically, the stock is now retesting a key support zone between $228 and $233. This level has historically held well and may offer a high-conviction entry for those anticipating a BTC rebound. Should Bitcoin aim for new highs, MSTR could respond with outsized upside, though traders must account for the volatility and downside risks that come with crypto-correlated equities.
🎯 Trade Setup:
Entry Zone: $228 – $233
Take Profit Targets: $360 and $535
Stop Loss: $198
This setup offers a high-risk, high-reward opportunity. As always, manage position size carefully and watch BTC price action for confirmation.
MSTR , 255 & 270 I think once MSTR breaks 270 we could see it go 300 - 320. BTC has to move for that. yesterday it broke 251.83 ---> 255. BTC action need to higher to 109K or more for ~280

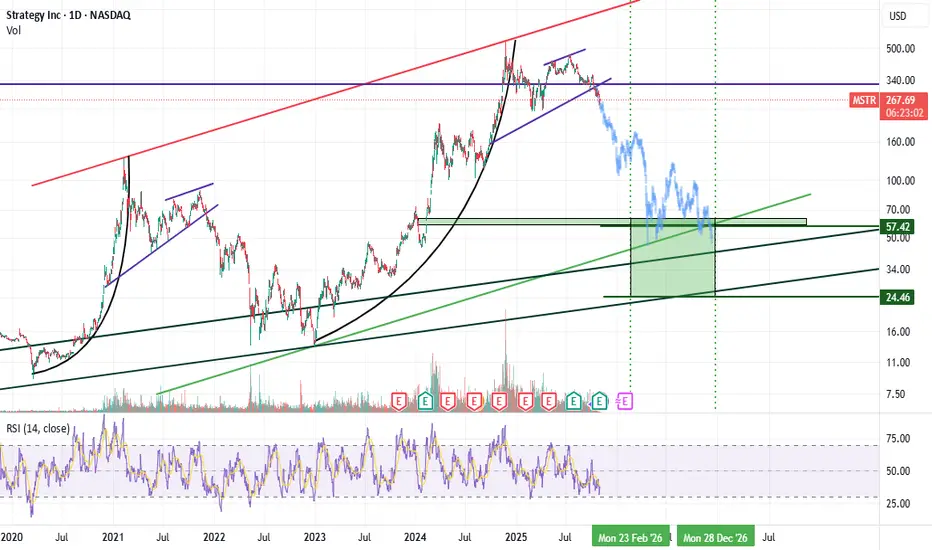
MSTR bearish , going way downBTC cycle is over or almost over - may not get the blow off top everyone is expecting. If that is the case MSTR will go to min 50-60 area if not lower.
$MSTR: Monthly down trend...GM lads, looks like we have a fully confirmed monthly down trend in $MSTR...this likely is bad news for all of crypto.
Stay safe out there...
Cheers,
Ivan Labrie.

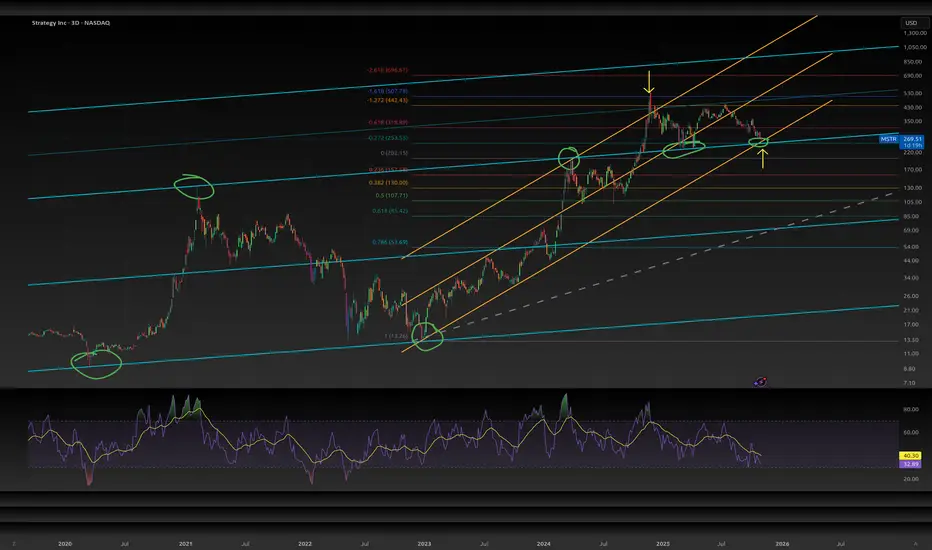
MSTR is on a point of significant confluenceMSTR is on a point of three major confluences. To lose this level would mean we are going much lower. However, I expect at least a significant bounce from here.
we have the blue channel that previously acted as resistance and recently turned into support.
we have the current orange channel
we have the -.272 fib level, after hitting the -1.618 Nov 2024
RSI also looks like a bottoming pattern, but that needs to play out some more to be confident.
I would not be surprised if we retest the underside of the -.618 around $315 in short order. If we lose this level, it could get really nasty to the downside.
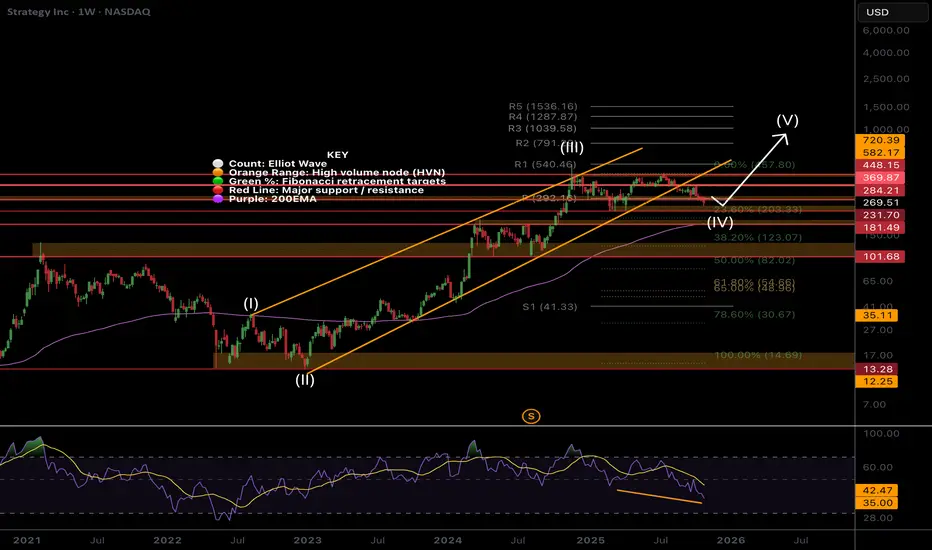
MSTR weekly bull divergence on low sentimentSentiment is low, the asset is hated and misunderstood by TradFi and retail. It’s a recipe for a bottom!
Price is still in a wave (IV) which are expected to be long and drawn out, driving investors into shallow capitulation through boredom into patient hands. I don’t expect wave (V) to kick in until Bitcoin moves. Wave (V) has an expected target of the R3 daily pivot at $1039 but will overextend if Bitcoin does.
Price has fallen out of the lower channel boundary and sitting below the weekly pivot, still above the weekly 200EMA so the outlook is bullish. Wave (4) may complete at the 0.236 Fibonacci retracement at $230. For now I am waiting to see what happens before entering. Good opportunities are setting up.
🎯 Terminal target for the business cycle could see prices as high as $1000 based on Fibonacci extensions
📈 Weekly RSI has bullish divergence
👉 Analysis is invalidated if we close back below $82