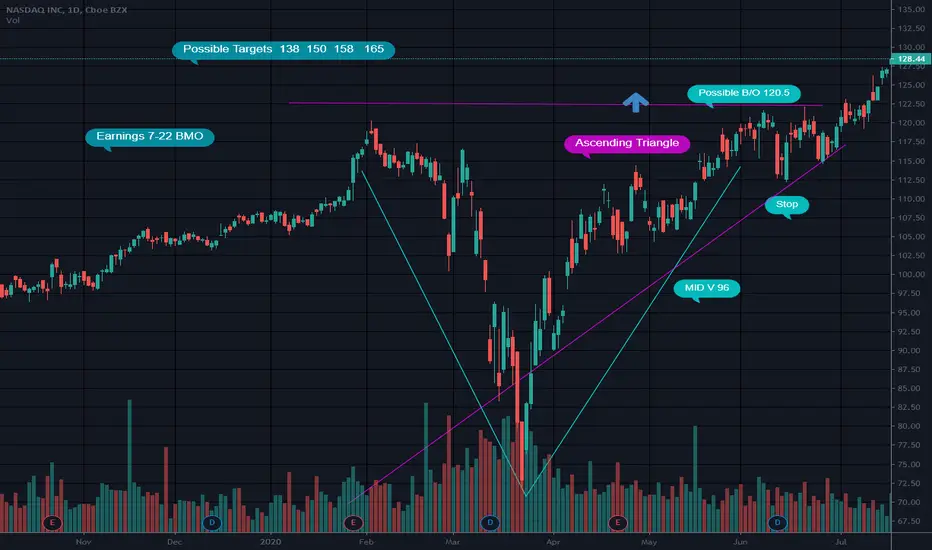
Ascending Traingle V BottomBreak from V bottom and from ascending triangle
Earnings this week 7-22 BMO
not a recommendation
my stop is at 112
Nasdaq, Inc.
No trades
Trade ideas


NASDAQ Buy NASDAQ using Elliot Impulse Wave and two Trend lines yellow and red trend lines . Buy at current 120.91 price .Target of 133.13 around 10% . Stop Loss is the red line- If it starts breaking the red trend line . Then it can go down. The black line resistance represents February 2020 Top which seems already broken. Also RSI there seems more room for upward movement


Nasdaq B4 bullrun VS Bitcoin !! #marketcycleThe market cycle from Nasdaq is the same as Bitcoin before the bull run starts!


Thougts about NASDAQ100what about the american market ?? Strong sales have been observed since February, now the price has come to the upper limit 120$ of this fall and has broken through it. There was also an accumulation under the level. Very interesting situation. Here it is necessary to observe what will happen next, how the price will behave at this level 120$. A very likely scenario is that there will now be a false breakdown of the level. If I see a strong brake of the level down, then after the rollback I will look for the entry point to the sell. Although before the election, the price may still be sideways, or show a slight upward movement. After the election, the global trend will begin again. It is necessary to observe.
ATTENTION: I help to make an investment portfolio with different assets, as well as conduct a deep fundamental analysis of stocks, determining the fair value of companies. On these issues, the caller personally in the message. Thank you all and good trading !!!

V BottomBreak out would possibly be at prior high
Target: 150 to 157
Target 2: 180 to 192
Trade safely

NASDAQ In Overbought RegionHere at the H2 TF, the Nasdaq is falling reacting from 122.98 for what could be a future buying price.
And for My Analysis
Price got rejected three times from my upper trend-line holding still at 120.09 without a L for a swing high. This causes uncertainty for bearish investors as price could potentially reverse and break resistance to continue the up-trend that's shown by the bottom trend-line.
In my view, price-action has made three touches and is below my 0.78 Fib, so I believe price will further drop, this indicating to me that although the dollar could rise -will drop due stock market concerns.

Nasdaq Technique learnt tested and it worked I hope this information can help anyone.
I have just started trading currently being mentored its going great so its time to share what i learn


NASDAQ JUL-2011 TO JUL-2020: 98.5% FITNASDAQ must be a favourite of the quants, because this channel is almost irrationally clean; with only 2 instances of movements breaching outside the +/- 2 standard deviations of the mean. Overall, the spot price has a 98.5% fit to the trend.
20% Year-On-Year growth on an index; and not even a global pandemic slows it down for more than 8 weeks. What a world we live in.


BULLISHInverted Head and Shoulders
Price broke the trendline and has retested
Elliot wave analysis shows we are in for a major move

#Nasdaq - Is Nasdaq ready to make new ALL TIME HIGHS?Thanks for coming to this update.
Before you start reading kindly hit that like button and follow. It motivates me to keep doing such work for free.
Thanks
After getting rejecting from the ALL TIME HIGH region, NASDAQ tried to retest that zone again and saw a rejection once more.
But even though it saw a rejection, there is a good chance now that with subsequent re-tests of the 120 -121 region, bulls may be able to break past that resistance zone.
In that case, Nasdaq would see new ALL TIME HIGHS and may turn others markets bullish too.
But be very cautious if you are trying make your trades around this idea as there may be a bull trap waiting and we may just see a good dump too.
We haven't seen a good pull back in Nasdaq since it's run up from the crash and thus we can also see that in the near future. Keep that in mind as a bearish case scenario.
Please note: These are my views and not trading advice. Please consult your financial adviser before taking any trading decision.
Daily RSI
NASDAQ- 57 ( Neutral Zone)
“In order to succeed, you first have to be willing to experience failure.” ― Yvan Byeajee

Nasdaq: Bullish Divergence to Bearish Divergence back-to-backBack to back divergences, bear coming in to attack the bull.
Key candle this week:
Red - a high possibility of 4 week corrections
Green - don’t fight the Fed


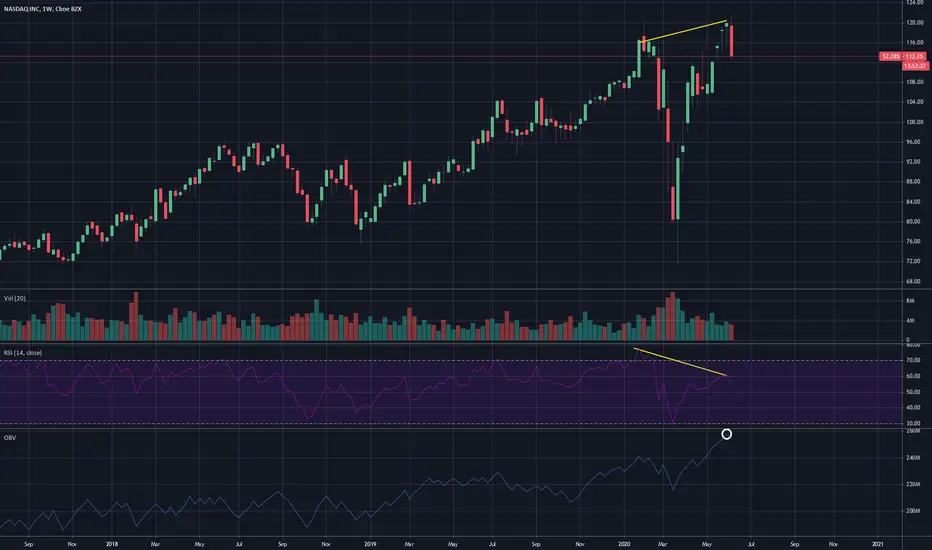
Running out of steamThis is the weekly - nice bearish divergence. Still quite oversold but seems to be running out of steam, OBV for this market seems to be such an awesome indicator, looking back at all the big names and indexes with it, seems to nail turning points A LOT.
The main thing that worries me about going short here is simply the amount of new traders with stimulus money. Checkout sentiment trader charts and we are at frenzy levels of net long positions from retail. Which should be a great sign for calling a top, but considering we have record levels of stimulus just makes me concerned that if this is really a massive bubble, maybe it can keep going?
Either way have taken a short position, good luck to all!
**********
DISCLAIMER: I am not a financial advisor, this is not financial advice.