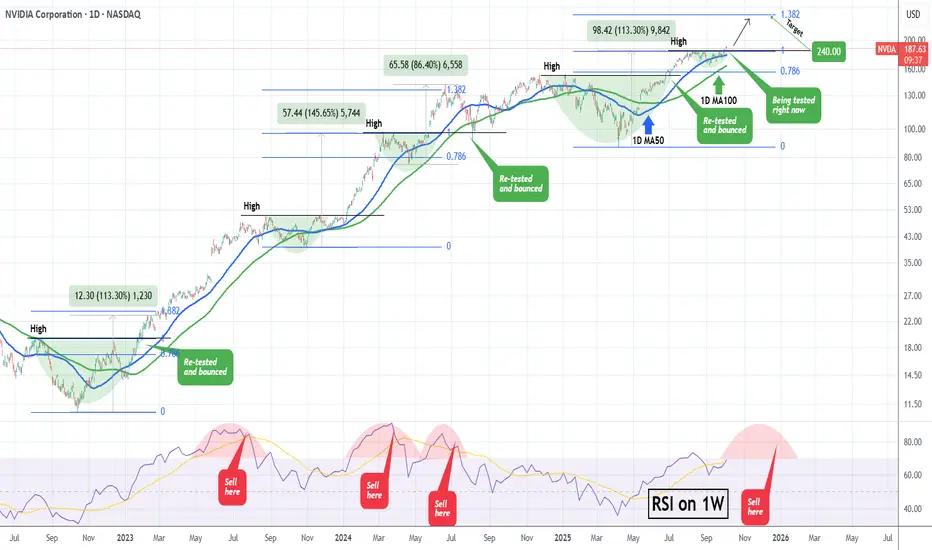
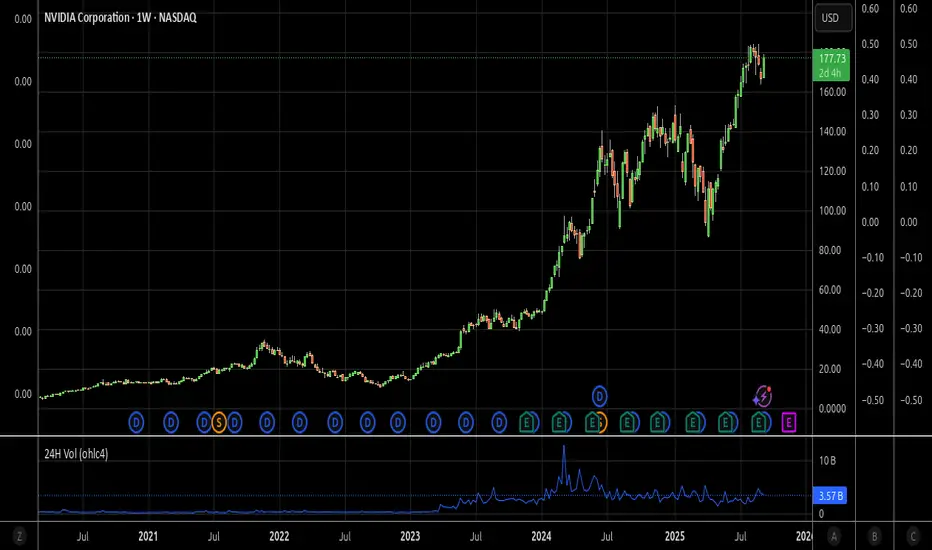
NVIDIA What happens when it retests a Resistance after a break?NVIDIA Corporation (NVDA) has been on a strong rise since the mid-term September 05 Low and this week finally broke above its previous $184 High. During the current Bull Cycle (since the October 2022 bottom), every time the price broke above a previous High and re-tested it as a Support, it started a secondary rally to new Highs.
Technically, as long as the 1D MA100 (green trend-line) holds, we should see at least a 1.382 Fibonacci extension test, similar to the February 2023 and June 2024 Highs. As a result, once the current former High / Resistance level finishes getting re-tested, we expect an end-of-the-year rally to $240.
Additionally, we will keep an eye on the 1W RSI. Typically, once it gets massively overbought above 85.00 and then starts to decline within an Arc peak formation, the time to Sell is after the middle of that Arc.
-------------------------------------------------------------------------------
** Please LIKE 👍, FOLLOW ✅, SHARE 🙌 and COMMENT ✍ if you enjoy this idea! Also share your ideas and charts in the comments section below! This is best way to keep it relevant, support us, keep the content here free and allow the idea to reach as many people as possible. **
-------------------------------------------------------------------------------
💸💸💸💸💸💸
👇 👇 👇 👇 👇 👇
1NVDA trade ideas
It's time to burst the bubbleMacro factors
1) Profit-taking
2) Tariff increases and conflicts of interest with Asian countries
3) Bond growth
4) Sell-off across all markets (precious metals will trigger a portfolio sell-off)
5) Problems with Bitcoin mining; expenses will exceed revenues.
NVDA Long/Investment till mid nov. 2 entries: low probability of orders getting filled/high profit margin.
1. one for higher probability of getting filled. E: 174 SL: 166
2. better profit margin. E: 172 SL: 167
target is $200 - $220
only allowed to hold it till:
1. 15 of November
or
2. 3 of December
why not to hold it till 2026? competition of selling might get higher.
commercials and fund managers will take profit before the bearish seasonality starts.

NVIDIA Next stop.. $200For a long time we've been calling for a $200 Target on NVIDIA Corporation (NVDA). That was our main Target for the Bull Cycle that started in November 2022. The stock is very close to this level and the short-term pattern that can get to it is this Channel Up.
Supported by the 1H MA100 (green trend-line), NVIDIA has been posting Bullish Legs of around +10% since the September 05 Low. The confirmation signal for those Legs has been a 1H MACD Bullish Cross.
Given that we formed one yesterday, we expect the price to be on such a Bullish Leg already. The 'weakest' of those sequences has been +9.58%, which if repeated, lands marginally above the $200 psychological level.
Time to hit it?
-------------------------------------------------------------------------------
** Please LIKE 👍, FOLLOW ✅, SHARE 🙌 and COMMENT ✍ if you enjoy this idea! Also share your ideas and charts in the comments section below! This is best way to keep it relevant, support us, keep the content here free and allow the idea to reach as many people as possible. **
-------------------------------------------------------------------------------
💸💸💸💸💸💸
👇 👇 👇 👇 👇 👇

Full moon energy - $NVDA🟩 190 — resistance zone
🟪 194 — potential breakout
🟥 153 — mid-range support
🟨 127 / 112 — deep demand zones
Momentum still strong but slowing near highs… like energy you can still feel, even when it’s pulling back that “missing you” I do mean you! phase before momentum returns.

$NVDA : The Rally’s Writing Its Own Headline! 10/9/2025NASDAQ:NVDA is making steady strides toward its wave C target of $235, following a challenging 13-month correction that found its bottom at $95 in April.
The bullish momentum could push prices even higher, eyeing a potential $321.
Sit tight and enjoy the ride! 🚀👌

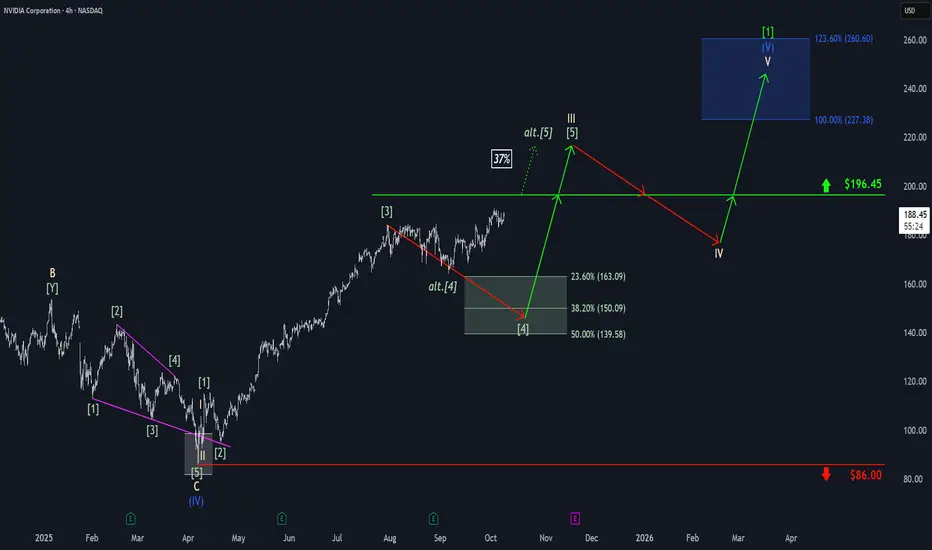
Nvidia: Bullish DistractionAmid bullish momentum, Nvidia edged closer to resistance at $196.45 before settling into sideways action late last week. As a result, there remains a 37% probability that the stock will bypass a new low and instead break directly above the $196.45 level. However, our primary expectation is for the stock to turn lower, targeting our green Target Zone between $163.09 and $139.58 to complete green wave . Only after this move do we anticipate a sustained advance above $196.45, which would mark the completion of beige wave III. Following a wave IV pullback below this threshold, we ultimately expect gains into the blue Target Zone between $227.38 and $260.60, where beige wave V should complete not only blue wave (V), but also the larger neon green wave .
NVDA will pass 200 in the next 3 weeksFinishing the correction,
breaking above resistance,
pullback,
Marching toward the new All Time High
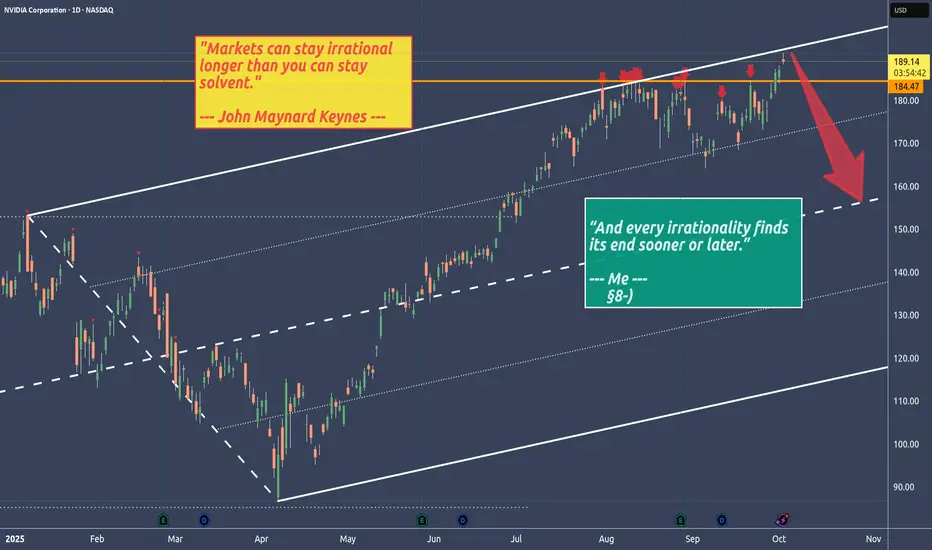
NVIDIA - Stalking NVDA with a short trade in mind🔱 Second approach to crack the U-MLH 🔱
No matter how irrational markets get, sooner or later the Black Bird strikes them down.
We’re back at the U-MLH where price is stretched.
Could it trade through it?
Absolutely.
Even better would be if price trades above the U-MLH and then falls back into the fork — that would be a strong confirming short signal.
But a turn right at the U-MLH would also be a heads-up for me.
👉 Stalking NVDA with a short trade in mind.
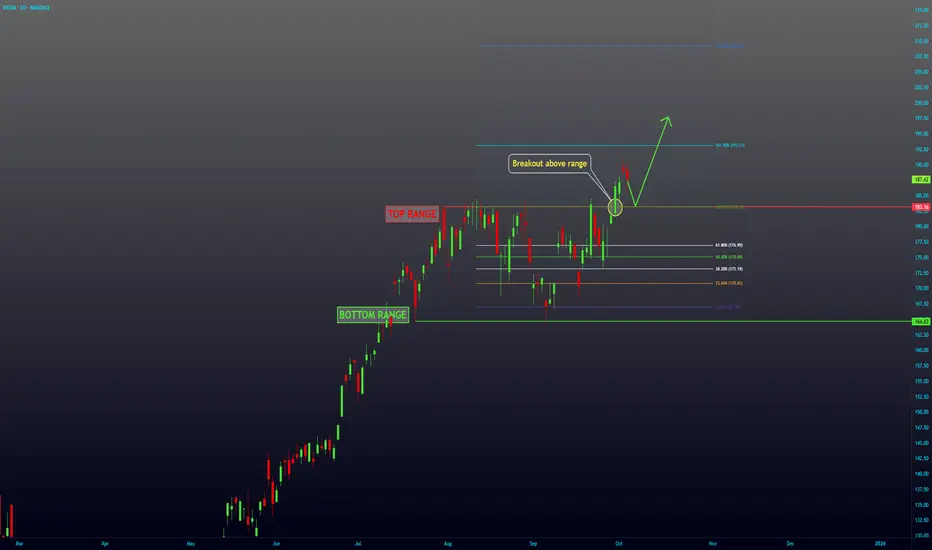
NVDA Breakout -- Continuation UPNASDAQ:NVDA has been in a range since end of July until September 30th, where it broke above the range. I expect to see more upside from here.
NVDA broke the resistanceNASDAQ:NVDA has just broken a resistance, slowly slowly targets 250$.
Currently no sign for downwards.

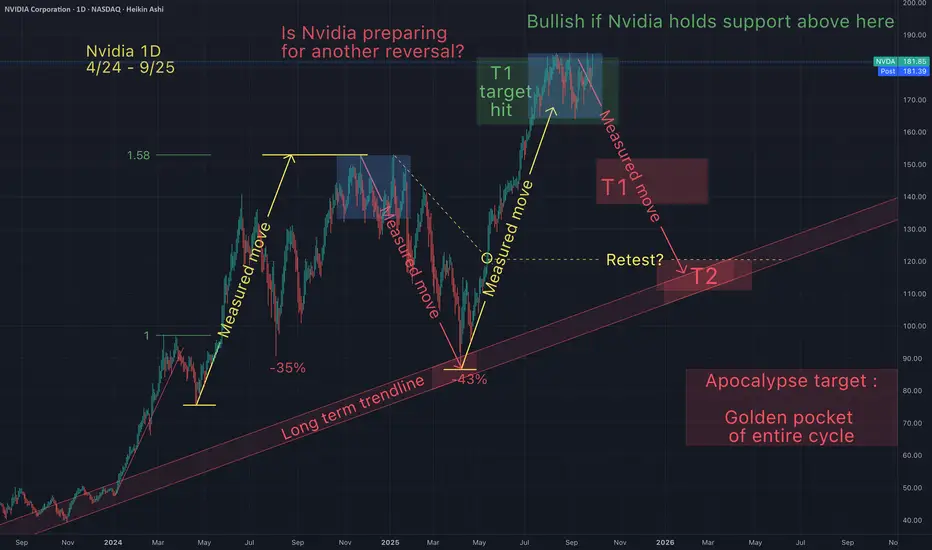
Is Nvidia preparing for another reversal?Is Nvidia preparing for another reversal? It would makes sense at this level. Could it continue up from here? Of course! But I only buy when it's red and retracing. I never jump on a moving train, so lets hope this train slows down so we can jump back in.
May the trends be with you.
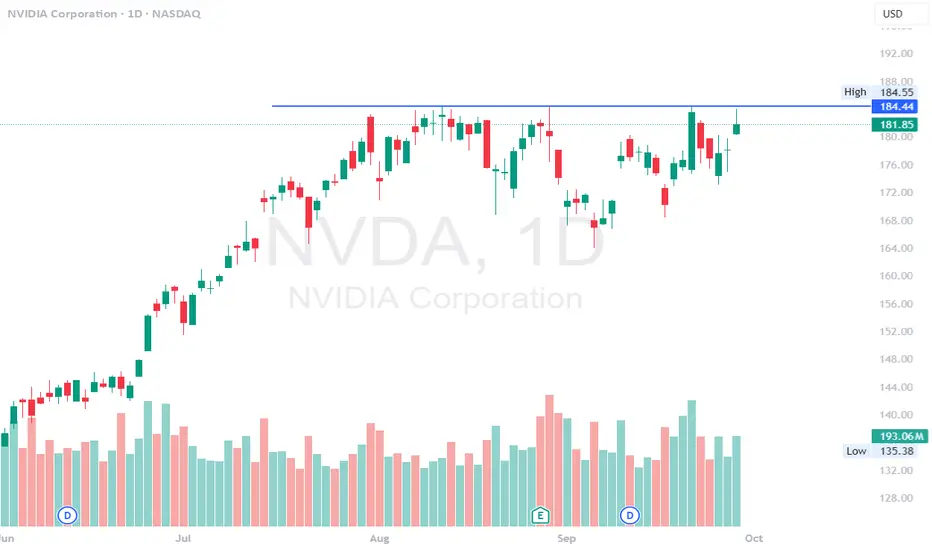
$NVDA - $200 incoming if $185 breaksNVDA - Stock making another failed attempt to break all time highs. Stock could hit possible $200 if that level breaks. calls above $185 looking good here. Stock is decent at the indicator level.
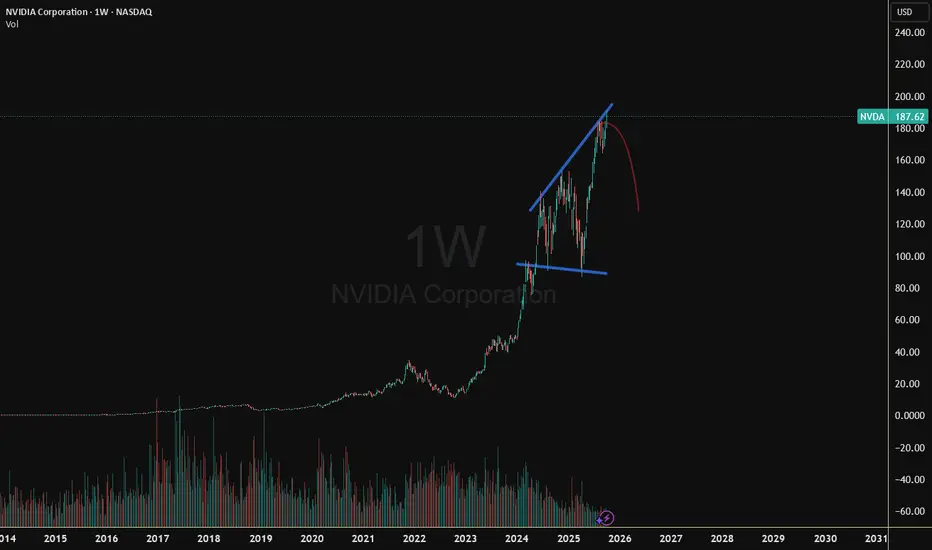
Nvidia - Starting a clear +20% rally!🧲Nvidia ( NASDAQ:NVDA ) rallies higher now:
🔎Analysis summary:
About one decade ago, Nvidia broke out of a major bullish triangle pattern. Following this remarkable breakout, Nvidia continued with a rally of about +35.000%. But looking at all these previous cycles, Nvidia remains bullish with another potential +20% move towards the upside.
📝Levels to watch:
$200, $250
SwingTraderPhil
SwingTrading.Simplified. | Investing.Simplified. | #LONGTERMVISION

Nvidia - The next rally of +33% started!🚀Nvidia ( NASDAQ:NVDA ) just broke out:
🔎Analysis summary:
Over the past couple of months, Nvidia has been rallying an expected +100%. However, just objectively looking at the chart, this rally is not over yet. After the confirmed all time high breakout, Nvidia can rally another +33% until it will retest a substantial resistance level.
📝Levels to watch:
$250
SwingTraderPhil
SwingTrading.Simplified. | Investing.Simplified. | #LONGTERMVISION

NVDA at a Make-or-Break Zone – Can Bulls Push Back on Oct. 6? Market Overview (15-Min Chart)
NVIDIA continues to trade inside a well-defined downward channel, showing controlled selling pressure throughout last week. Each bounce attempt has been capped near the descending resistance line, currently near $188.80–$189, while support sits around $185.30–$186.
The MACD histogram has started to turn lighter red, with a potential bullish crossover forming beneath zero — an early sign of waning bearish momentum. Meanwhile, the Stochastic RSI has rebounded sharply from oversold levels and is now moving toward the upper band, indicating possible short-term upside before overbought exhaustion.
If NVDA can break above $188.50–$189, it could trigger a short-term shift from compression to expansion. However, if it rejects once more, the next retest of $185 could accelerate selling momentum.
GEX Validation (1H Chart Insight)
Gamma Exposure (GEX) levels on the 1-hour chart confirm a clear neutral-to-bullish setup if NVDA maintains above $185. The highest positive NET GEX / Call Wall aligns around $192.5–$195, suggesting strong dealer resistance in that region. A sustained breakout above $190 could ignite a push toward those upper zones if option flows turn supportive.
On the downside, Put support levels are clustered between $174–$180, forming a strong hedge-based demand area. The IVR of 9.8 and IVX avg 42.1 indicate a calm volatility environment, leaving room for expansion once direction confirms. Interestingly, Calls only account for 8.6% of flow — a potential contrarian signal if short-term momentum strengthens.
Trade Scenarios for the Week (Oct. 6–11)
Bullish Case:
If NVDA breaks and holds above $189, momentum could accelerate toward $191 (minor resistance) and potentially $195, where the next Call Wall sits.
* Entry: Above 189 confirmation
* Target 1: 191
* Target 2: 195
* Stop-Loss: Below 186
Bearish Case:
Failure to reclaim $189 and a breakdown below $185 could drag NVDA toward $182.50 or even $180, testing the lower bound of the Put Wall zone.
* Entry: Below 185
* Target 1: 182.5
* Target 2: 180
* Stop-Loss: Above 188
Option Insights
With gamma tightly balanced near current price, NVDA may be entering a coil phase before a directional break. Traders may look for short-term call spreads near 190–195 for upside confirmation, or put spreads near 185–180 if weakness resumes. The low IVR favors directional debit plays early in the week.
My Thoughts
This setup feels like a tug-of-war between dip buyers and short-term momentum sellers. NVDA’s structure suggests compression nearing resolution — the first clean break outside this falling channel will set the tone for the week.
If buyers can clear $189 with conviction, the path to $192–195 opens quickly. If not, the bears will likely reassert pressure back toward $182. The MACD and Stoch RSI alignment suggest a short-term bounce first, but the broader trend remains fragile until the channel is broken decisively.
Disclaimer:
This analysis is for educational purposes only and does not constitute financial advice. Always perform your own due diligence and manage your risk responsibly before trading.

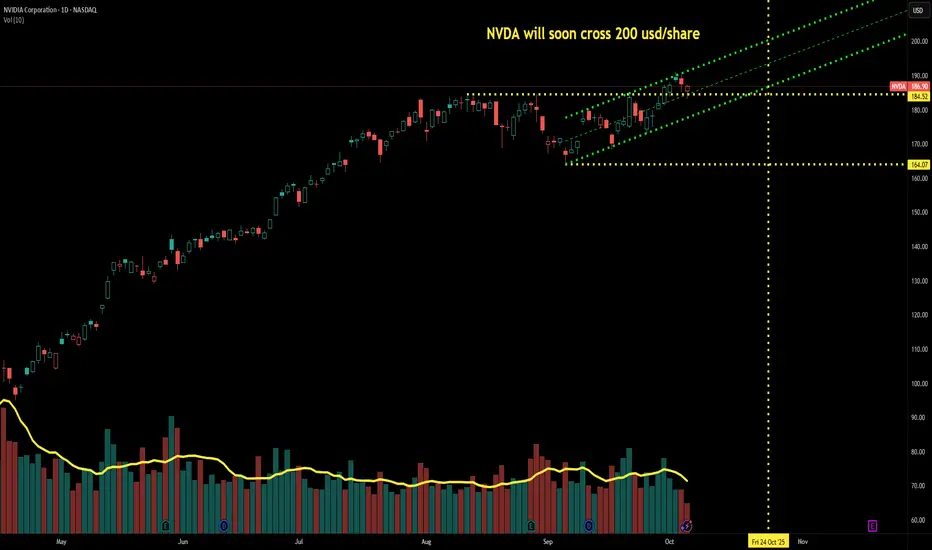
Nvidia Stock Nears the $200 MarkNvidia’s stock has gained more than 4% over the last three trading sessions. The price currently hovers slightly above $190 per share, marking new record highs and moving closer to the psychological level of $200.
Buying pressure has intensified after the U.S. government authorized a series of agreements allowing the export of advanced artificial intelligence chips to the United Arab Emirates, opening a strategic trade channel with the Middle East. This development has strengthened investor confidence, fueled by higher long-term revenue expectations for the company. As a result, buying momentum may continue to dominate in the short term.
Relevant Uptrend
Since early April, the stock has maintained a steady upward trend, consistently posting new highs that confirm a dominant bullish bias on the broader chart. So far, there have been no significant corrections threatening this structure, leaving the uptrend line as the key reference for short-term movements.
However, as the price approaches the $200 level, a phase of indecision could emerge due to signs of buyer exhaustion, reflected in the formation of weakening candles. This behavior could lead to technical pullbacks within the broader bullish trend.
RSI
The RSI line remains above the 50 level, indicating that buying momentum remains dominant over the past 14 trading sessions. However, the indicator is gradually approaching the overbought zone (70). If it reaches this level, it could signal an imbalance in market forces, opening the door to short-term downward corrections.
MACD
The MACD histogram remains close to the neutral line (0), suggesting a lack of clear directional strength in the short-term moving averages.
Both indicators point to a potential phase of indecision in short-term movements, allowing for a possible period of consolidation within the current bullish bias, especially if no new major catalysts emerge to drive aggressive buying pressure in the coming sessions.
Key Levels to Watch:
$200 – Psychological Resistance: In the absence of historical references, this level stands out as the most relevant short-term price point. It could act as a technical barrier, triggering temporary pullbacks.
$184 – Near-Term Support: Corresponds to the recent retracement area. A drop below this level could neutralize bullish momentum and lead to a sideways consolidation phase.
$170 – Key Support: Associated with recent lows, located below the 100-period moving average. A sustained move under this level could shift the market structure and pave the way for a dominant bearish bias.
Written by Julian Pineda, CFA – Market Analyst

NVDA weekly chart reverse head and shouldersNVDA weekly chart reverse head and shoulders is clearly forming. Looks very bullish. Important to check confirmation of the green candle next Friday. Than a close look to day chart for getting prediction on how far it goes up.
NVDA Ready for Takeoff: $200 Target in Sight!
Based on the daily chart of NVIDIA (NVDA) on NASDAQ, here’s a breakdown:
🔎 Technical Analysis
Overall Trend
The stock is in a strong uptrend (rallying from around $120 to the current $186).
Higher lows are forming, and price is pressing against the 185–187 resistance zone, showing strong buying pressure.
Key Resistance
185–187 USD is a critical resistance zone tested multiple times.
Given the strong daily candle and volume, the probability of a breakout is high.
Short-Term Support
Uptrend line provides support around 176–178 USD.
Next key support sits near 170 USD.
🎯 Short-Term Outlook (1–4 Weeks)
Entry Trigger: After a confirmed breakout above $187
Target 1: $195
Target 2: $200
Stop-Loss: Close below $178
🌐 Long-Term Outlook (3–6 Months)
Sustained breakout above $187 could lead to a new bullish phase.
Target 1: $210
Target 2: $225
Stop-Loss: Break below $170
✅ Summary
NVIDIA is on the verge of breaking a major resistance level. A cautious entry above $187 may offer attractive upside potential. Risk of a false breakout exists, so stop-loss discipline is crucial.

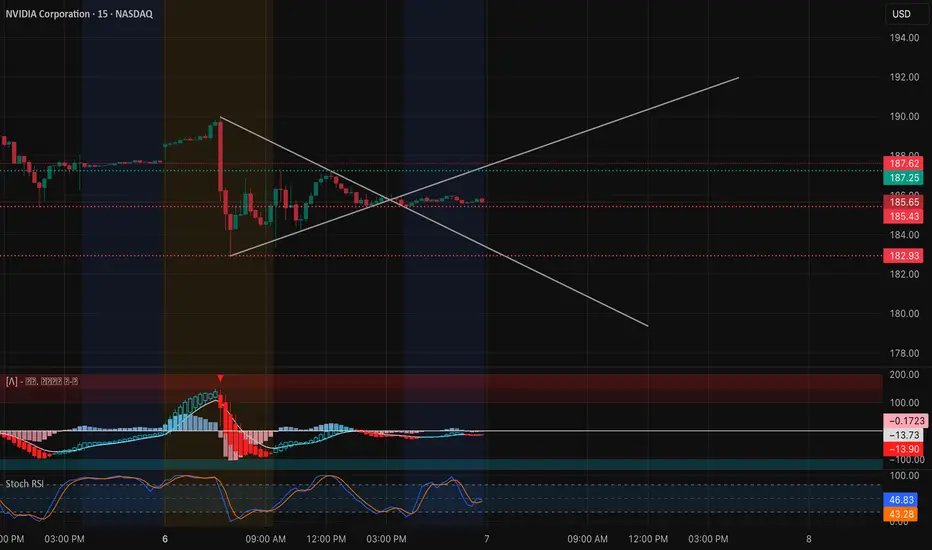
NVDA Oct 7–Coiling Tight for a Breakout! Watch $187.5 Pivot Zone15-Min Chart Analysis (Intraday Trading Setup):
NVDA is forming a symmetrical triangle, compressing between $185–$187.5 after several sessions of choppy consolidation. This coiling pattern reflects equilibrium between buyers and sellers — a setup that typically precedes a strong breakout or breakdown.
Price is currently sitting at $185.65, hugging the triangle’s apex. The MACD is neutral, showing declining momentum but no bearish crossover confirmation yet. Meanwhile, Stoch RSI is resetting mid-range (46.83 / 43.28), suggesting the potential for a new move in either direction once momentum triggers.
Short-term levels to watch:
* Upside breakout zone: $187.25 → $187.62. A break and hold above this level could quickly push NVDA toward $190–$192.50.
* Downside support: $182.93 → $180.50. If price loses $182.93 with volume, it opens room for a retest of the $178 zone where prior liquidity pools exist.
Given the wedge compression, traders should stay patient — the move that follows could be sharp and decisive.
1-Hour GEX Confirmation (Options Sentiment Insight):
GEX levels on the 1-hour chart reinforce the technical setup perfectly:
* Highest positive NETGEX / CALL resistance stands at $192.50, forming a key magnet zone if NVDA breaks out.
* The $185 area aligns with a neutral gamma transition point — a battleground between dealers hedging both directions.
* Strong PUT walls are concentrated around $180–$172.50, creating a solid downside floor.
This gamma structure implies a coiled spring scenario — a decisive break above $187.5 could unleash gamma-driven upside momentum toward $190–$192, while losing $182.9 could accelerate a gamma unwind to $180.
My Thoughts:
NVDA’s price action shows tightening volatility, a sign of energy building before expansion. With low IVR (14.8) and IVx (45.9) — volatility is compressed, making directional breakouts ideal for options traders.
I’m watching $187.50 as the key pivot. A breakout above it could trigger a short-term gamma squeeze toward $192.50, while a failure and rejection could lead to a fade toward $182–$180. This setup offers an attractive risk/reward in either direction — ideal for momentum traders.
Options Outlook (Oct 7–11):
* Bullish setup: Consider 187.5C or 190C (Oct 11 expiry) if price reclaims and holds above $187.5 with volume > average.
* Bearish setup: Consider 182.5P if NVDA fails at $187.5 and breaks below $183 with confirmed MACD divergence.
* Volatility note: With IVR at 14.8, option premiums are cheaper than usual — a good opportunity for directional swing entries.
Conclusion:
NVDA is consolidating tightly at a critical crossroad. The symmetrical triangle plus neutral gamma landscape signals a breakout is near — watch $187.5 for confirmation. Above it, bulls can push toward $190–$192.5; below $183, bears gain control. Stay alert — the next move could define NVDA’s direction for the week.
Disclaimer: This analysis is for educational purposes only and does not constitute financial advice. Always do your own research and manage your risk before trading.
NVDA - AI Dominance + Strong Technical Structure | Long Entry📈 Ticker: NVDA (NVIDIA Corporation)
📍 Recommendation: LONG
⏰ Timeframe: Position Trade (4-8 weeks)
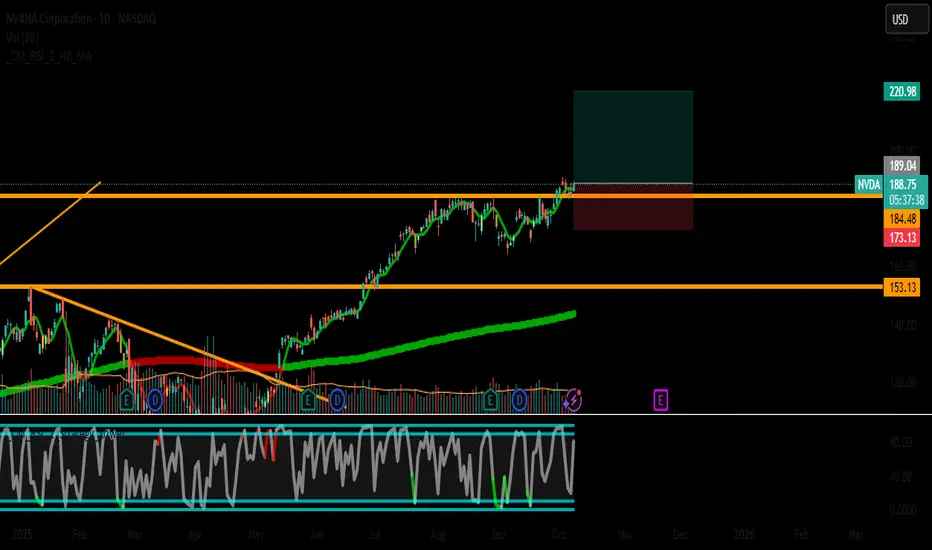
🎯 Trade Idea Summary
Entry: $189.00 (on pullback to support)
Stop Loss: $173.00 (-8.5%)
Take Profit: $221.00 (+16.9%)
Risk/Reward Ratio: 1:2.0
📊 Fundamental Justification - AI LEADER 🚀
Revenue Growth: STRONG (+114% YoY) - $60.9B to $130.5B 💰
Net Income Growth: STRONG (+145% YoY) - $29.8B to $72.9B 📈
Debt Health: EXCELLENT (Score 10/10) - Low debt, high coverage ✅
Market Position: Dominant AI/GPU market share
Growth Catalyst: AI infrastructure spending cycle
📈 Technical Analysis
Trend: Daily ↗️ Alcista, 4H ↗️ Alcista, 1H ↗️ Alcista (ALL BULLISH)
RSI: 65.8 - Healthy momentum, not overbought
MACD: Bullish and positive across timeframes
Price Action: Above all key SMAs, holding higher lows
Key Support: $185 (recent swing), $178 (SMA20), $173 (critical)
Key Resistance: $195 (psychological), $205 (recent high), $221 (target)
🔍 Catalyst & Market Context
AI Revolution: Sustained data center demand
Earnings Momentum: Consistently beating expectations
Product Cycle: Blackwell GPU platform rollout
Institutional Support: Heavy fund ownership
🎮 Trade Management
Ideal Entry Zone: $188 - $190
Stop Below: $173.00 (below SMA20 and key support)
Target 1: $205.00 (+8.5%) - Consider partial profit
Target 2: $221.00 (+16.9%) - Full position target
Timeframe: 4-8 weeks for full target
⚠️ Risk Factors
Valuation Premium: P/E 53.9 (high but growth-justified)
Market Dependency: Tech sector correlation
Competition: AMD/Other AI chip competitors
Economic Sensitivity: Capex spending cycles
✅ Why This Trade Works
Earnings Powerhouse - Explosive growth in AI era 📊
Technical Strength - Clean uptrend across timeframes 🟢
Structural Tailwinds - Multi-year AI investment cycle 🔄
Risk Management - Defined levels with 1:2 R/R 🛡️
📅 Key Levels to Watch
Immediate Support: $185 - $188
Breakout Level: $195 - $197
Acceleration Zone: Above $205
Invalidation: Below $173 (stop loss)
#NVDA #NVIDIA #AI #PositionTrade #TechStocks #Breakout
#ArtificialIntelligence #Semiconductors #GrowthInvesting #RiskManagement
Disclaimer: This post is for educational and informational purposes only and does not constitute financial advice or investment recommendation. Trading involves substantial risk of loss and is not suitable for all investors. Past performance is not indicative of future results. Conduct your own research and consult with a qualified financial advisor before making any investment decisions.
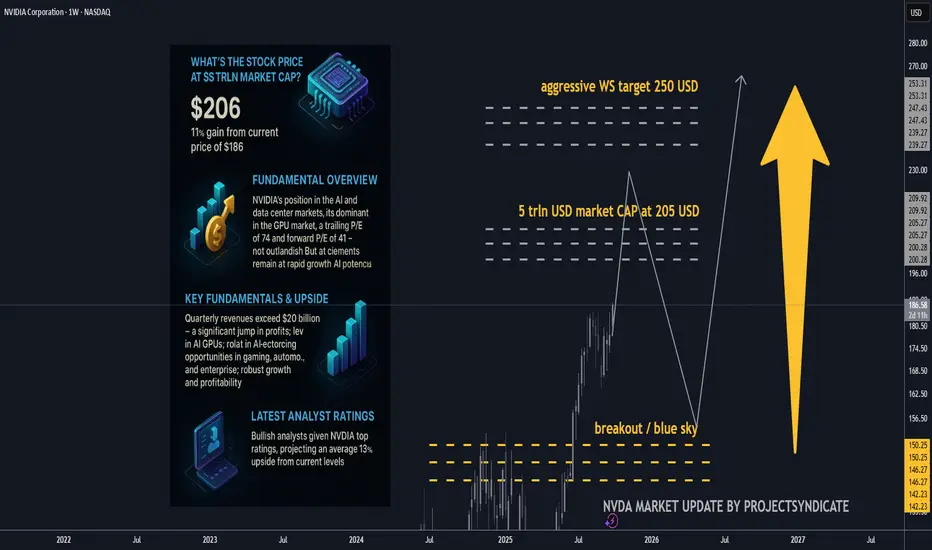
NVDA 5 trln USD market cap up next? Key fundamentals and upside.Is $5T reasonable for NVDA?
• Mechanically, yes: The market only needs ~10% near-term appreciation from today’s levels to print $5T. That’s within one strong quarter or a guidance beat.
• Fundamentally, the math works if (a) FY26–27 revenue tracks the guide/Street trajectory (TTM already $165B with Q3 guide $54B), (b) non-GAAP GMs hover low-to-mid-70s, and (c) opex discipline holds. Under those, forward EPS path supports ~35× at $5T, a premium but not outlandish for a category-defining compute platform.
• Free-cash optionality: With ~$48B net cash and massive FCF, NVDA can keep funding buybacks (already $60B fresh authorization) and capacity, smoothing cycles.
________________________________________
• Stock price at $5T market cap: ≈ $205.8 per share (on ~24.3B shares).
• Gain needed from $186.6: +$19.2 (~+10.3%).
The quick math (market cap ⇒ price)
• Shares outstanding (basic): ~24.3 B (as of Aug 22, 2025, per 10-Q).
• Stock @ $5T market cap: $5,000,000,000,000 ÷ 24.3B ≈ $205.8/share.
• From today’s price $186.6: needs +$19.2 or ~+10.3%.
That also implies P/E (TTM) at $5T of roughly ~56× (using TTM EPS ~3.68). Today’s trailing P/E is ~50–53× depending on feed.
________________________________________
Core fundamentals snapshot 🧩
Latest quarter (Q2 FY26, reported Aug 27, 2025)
• Revenue: $46.7B (+56% y/y; +6% q/q).
• Data Center revenue: $41.1B (+56% y/y).
• GAAP gross margin: 72.4%; non-GAAP 72.7%; Q3 guide ~73.3–73.5%.
• GAAP EPS: $1.08 (non-GAAP: $1.05; excl. $180M inventory release: $1.04).
TTM scale & profitability
• Revenue (TTM): ~$165.2B.
• Net income (TTM): ~$86.6B.
• Diluted EPS (TTM): ~$3.5–3.7.
• Cash & marketable securities: $56.8B; debt: ~$8.5–10.6B ⇒ net cash ≈ $48B.
Capital returns
• $24.3B returned in 1H FY26; new $60B buyback authorization (no expiration). Remaining buyback capacity ~$71B as of Aug 26.
________________________________________
Valuation read (today vs. $5T)
Using widely watched metrics:
• P/E (TTM): ~50–53× today; at $5T it rises to ~56× (assuming flat TTM EPS).
• Forward P/E: Street FY27 EPS ≈ $5.91 → ~31–33× today; ~35× at $5T — still below many AI hyper-growth narratives that trade at 40–50× forward when growth visibility is high.
• EV/EBITDA (TTM): EV ≈ market cap – net cash. Today EV ~$4.45T; EBITDA TTM ≈ $98–103B ⇒ EV/EBITDA ~43–45×; at $5T EV/EBITDA drifts to ~48–50×.
• P/S (TTM): ~27× today (at $4.5T) and ~30× at $5T on $165.2B TTM revenue.
• FCF yield: TTM FCF range $60.9–72.0B ⇒ ~1.35–1.60% today; ~1.22–1.44% at $5T.
Takeaway: $5T doesn’t require a heroic repricing — it’s ~10% above spot and implies ~35× forward earnings if consensus holds. That’s rich vs. the S&P (~22.5× forward) but arguably reasonable given NVDA’s growth, margins, and quasi-platform status in AI compute.
________________________________________
What must be true to justify $5T (and beyond) ✅
1. AI capex “supercycle” persists/expands. Citi now models $490B hyperscaler AI capex in 2026 (up from $420B) and trillions through 2029–30. A sustained 40–50% NVDA wallet share across compute+networking underwrites revenue momentum and margin sustainment.
2. Annual product cadence holds. Blackwell today → Rubin in 2026 with higher power & bandwidth, widening the perf gap vs. AMD MI450 — supports pricing power and mix.
3. Margins stay “mid-70s” non-GAAP. Company guides ~73.3–73.5% near term; sustaining 70%+ through transitions offsets any unit price compression.
4. Networking, software & systems scale. NVLink/Spectrum, NVL systems and CUDA/Enterprise subscriptions deepen the moat and smooth cyclicality; attach expands TAM (improves EV/EBITDA vs. pure-GPU lens).
5. China/export workarounds do not derail mix. Q2 had no H20 China sales; guidance and commentary frame this as manageable with non-China demand and limited H20 redirection.
________________________________________
A contrarian check (where the model could break) 🧨
• Power & grid bottlenecks. Even bulls (Citi) note AI buildouts imply tens of GW of incremental power; slippage in datacenter electrification can defer GPU racks, elongating deployments (and revenue recognition).
• Debt-funded AI spend. Rising share of AI DC capex is being levered (Oracle’s $18B bonds; neoclouds borrowing against NVDA GPUs). If credit windows tighten, orders could wobble.
• Customer consolidation & vertical ASICs. Hyperscalers iterating custom silicon could cap NVDA’s mix/price in some workloads; edge inference may fragment.
• China policy volatility. Export rules already forced product pivots; rebounds are uncertain and not fully in NVDA’s control.
• Multiple risk. At ~50× TTM and >40× EV/EBITDA, any growth decel (unit or pricing) can de-rate the multiple faster than earnings make up the gap.
Bottom line of the bear case: If AI capex normalizes faster (say +10–15% CAGR instead of +25–35%), forward EPS still grows, but the stock would likely need multiple compression (toward ~25–30× forward), making $5T less sticky near-term.
________________________________________
Street positioning (latest bullish calls) 📣
• KeyBanc: $250 (Overweight) — Rubin cycle deepens moat → ~+34% implied upside.
• Barclays: $240 (Overweight) — AI infra wave; higher multiple to 35×. ~+29% upside.
• Bank of America: $235 (Buy). ~+26% upside.
• Bernstein: $225 (Outperform). ~+21% upside.
• Citi: $210 (Buy) — reiterates annual cadence & rising AI capex.
• Morgan Stanley: $206–210 (Overweight). ~+11–13% upside; 33× CY25 EPS framework.
• Consensus: Avg 12-mo PT ~$211, ~+13% from here.
________________________________________
________________________________________
Extra color you can trade on 🎯
• Where bulls may be too conservative:
o Networking/NVLink attach could outgrow GPUs as Blackwell/Rubin systems standardize on NVIDIA fabric, defending blended margins longer.
o Software monetization (CUDA ecosystem, NIMs, enterprise inference toolchains) is still under-modeled in many sell-side DCFs.
• Where bulls may be too aggressive:
o China rebound timing & magnitude.
o Power/real-estate constraints delaying deployments into 2026.
o Credit-driven AI capex — watch for any signs of tightening in private credit / neocloud financing that uses GPUs as collateral.
________________________________________
________________________________________
Sources: NVIDIA IR & 10-Q; Yahoo Finance stats; StockAnalysis (TTM financials); company Q2 FY26 press release and CFO commentary; recent analyst notes from KeyBanc, Citi, Barclays, BofA, Morgan Stanley; financial media coverage (WSJ/FT).
NVIDIA bearish crabBig red candle on the bearish crab reversal zone signals further downside move. did you buy the dip?
