NVDA April 26, 2024: An Attempt to Resume the UptrendOn April 26, 2024, The weekly chart of NASDAQ:NDX shows a weekly recovery from the MA-30 week. NASDAQ:NDX closed near the weekly high which is encouraging. The current close is right near the resistance 17,780 which was broken during the week April 15-19.
Looking closer at the daily chart we can see that the resistance is at the same level with both MA-20, MA-50, therefore this is a key level challenging the market next week.
I started to buy a pilot position in NASDAQ:NVDA around the close of April 26. Reasons:
Crossed up MA-20
Crossed up MA-50
Crossed up the small trendline (yellow line on the chart)
This happened before the NASDAQ:NDX did so as described above.
1NVDA trade ideas

Nvidia - H&S on 4H (Possible Overhead Breakout Later)I have not posted for a while, been busy trying to improve my trading entries and exit.
I am back now and will be posting more regularly :).
Nvidia has broken out of H&S pattern on 4 hour.
Any retest to the highlighted orange area around 888-900 would be suitable for buying.
Stops can be placed below the 10 DEMA or 20 DEMA.
For conservative risk traders, stops can be placed below at 848.
I am looking for a run up to 950, where I will take one-third of my position off and wait for volume and price confirmation for break above 960.
At the moment, volume is not that great so its difficult to put on a huge position with conviction. Hoping to see that manifest, in breakout above 960.
If we can go above 960, I honestly believe 1500 is on the cards for this stock.

After Earnings Report, NVDA Stock Price Exceeds $1,000After Earnings Report, NVDA Stock Price Exceeds $1,000
For the first time in history, Nvidia's stock price has reached a four-digit number, and its market capitalisation has surpassed $2.5 trillion, ranking third globally after Microsoft and Apple. This surge is due to a strong earnings report, driven by high demand for AI chips:
→ Earnings per share: actual = $6.12, expected = $5.60;
→ Gross revenue: actual = $26.04 billion, expected = $24.59 billion.
Additionally, Nvidia announced a 10-for-1 stock split to make shares more accessible and attract new investors, which should support NVDA stock in the future.
While yesterday's main trading session closed around $950 per share, the price rose by approximately 6% in after-hours trading. Thus, NVDA's stock price has increased by over 100% since the beginning of the year. Can the rally continue?
On March 28, in the article "Stock Market Analysis: NVDA Losing Leadership?", we:
→ Noted signs of weakness relative to the S&P 500 index;
→ Constructed an ascending blue channel;
→ Suggested a potential pullback to the $800 level.
The NVDA chart shows that after these signs of weakness, the price dropped to the lower boundary of the channel on April 19, briefly falling below $800. However, the bulls then attempted to resume the upward trend, and it paid off.
Given NVDA's pre-market price, it is reasonable to assume today's main session will open around $1,010. Therefore, technical analysis of the NVDA daily chart today shows:
→ The price remains within the ascending channel;
→ The price is breaking through the $960 level with a bullish gap, which can now be expected to act as support;
→ If the bullish momentum from the earnings report continues (as it did on February 22), NVDA's price could approach the median line of the ascending channel.
According to TipRanks, the average analyst target price for NVDA is $1,104.62, but this target may be raised considering Nvidia's strong forecasts for the next quarter.
Buy and sell stocks of the world's biggest publicly-listed companies with CFDs on FXOpen’s trading platform. Open your FXOpen account now or learn more about trading share CFDs with FXOpen.
This article represents the opinion of the Companies operating under the FXOpen brand only. It is not to be construed as an offer, solicitation, or recommendation with respect to products and services provided by the Companies operating under the FXOpen brand, nor is it to be considered financial advice.

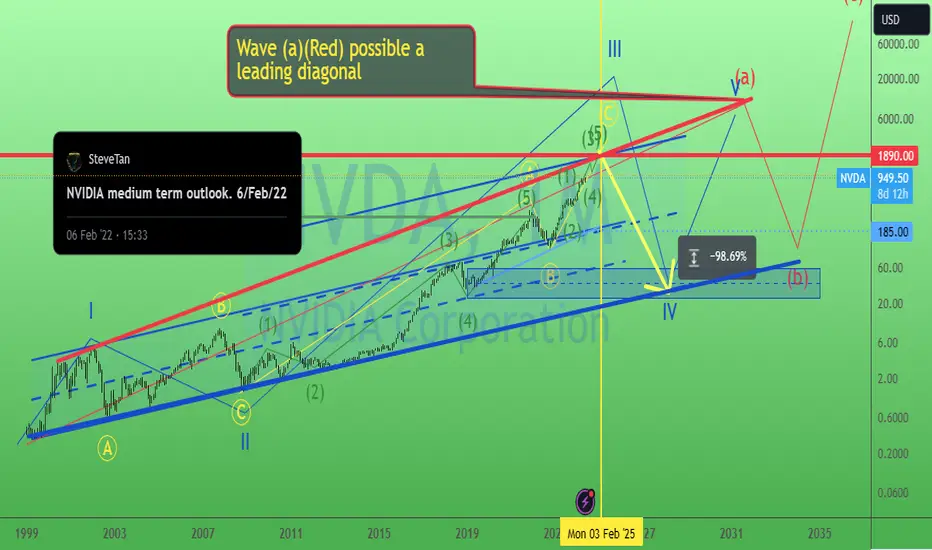
NVIDIA biggest pic. 23/May/24NVDA possible forming a leading diagonal pattern in wave (a)(Red). P/s. It seem like 99% stocks/index chart "showing" year 2025...
NVIDIA. short term swing setup. 23/May/24NVDA just announced a 10-for-1 stock split. So it will be more affordable at $100 +/- than $1000 and "this chart" will be "out of proportion". Support would be @ $900 or 90 +/- (after splitting) if there is a pullback.

NVDA beats across the board, boosting dividends by 150%All Eyes on Nvidia
Nvidia printing earnings after the bell tonight.
As the poster child for the AI rally that his driven indices to record highs, all eyes are peeled.
Expectation remain high for their earnings, which could cause downside risk to NVDA and the indices in the event of a miss, as its weight has increased to almost 3% of the S&P 500's net income.
As of Friday's close, options markets predicted an 8.6% swing in Nvidia for the session following earnings. According to Citigroup data, such a move could swing the S&P 500 by 0.4%, making it the fourth-largest impact on the benchmark in the last 12 years.
A marked beat on expectations could cause further strength in US stocks, as the AI FOMO rally regains steam.
NVIDIA Q1 2025 Earnings NASDAQ:NVDA
Revenue $26.08, est. $24.69b
Adjusted EPS $6.12, est. $5.65
Gaming revenue $2.6b, est. $2.62b
Adjusted gross margin 78.9%, est. 77%
Data center revenue $22.6b, est. $21.13b
Automotive revenue $329m, est. $292.4m
Cash dividends raised 150% to $0.01/share on post-split basis
Ten-for-one forward stock split effective June 7, 2024
Sees 2Q revenue $28.0B plus or minus 2%, est. $26.8B
NVDA beats across the board, boosting dividends by 150% and announcing a 10-for-1 stock split
NVIDIA Shows Sustained AI Momentum
Tech rallied in late hours after NVIDIA's solid results and outlook bolstered confidence in the artificial intelligence frenzy that has powered the stock rally.
The chipmaker soared in late trading after predicting another blowout sales gain for the current quarter. A $270 billion exchange-traded fund tracking the Nasdaq 100 climbed.
Second-quarter revenue will be about $28 billion, the company said in a statement Wednesday. Analysts on average had predicted $26.8 billion. Results in the fiscal first quarter, which ran through April, also beat projections.
The stock market fell during regular trading hours as the most recent Federal Reserve minutes indicated that officials are not in a hurry to lower interest rates. After fighting for direction for most of the session, the S&P 500 fell sharply as several Fed officials expressed concern about the extent to which policy is constraining the economy - but the minutes also indicated policy "was regarded as restrictive. Treasuries were under pressure, with shorter maturities underperforming.
US two-year yields climbed four basis points to 4.87%. The dollar rose, weakening the appeal of commodities priced in the currency.

Nvidia vs Nasdaq1)Very smart move for 10:1 RS in Nvda imho this make it much easier to unload to retail cause psychologically $100 feels different than $1000 (look tesla top and RS)
I believe we are close to a blow off top target around $120 many similarities with Nasdaq 99-00 move
2)If i am not mistaken please do your reasearch a majority of Nvdia's factories are still in Taiwan vs Intel which has brought most of them back in the US
3)The saying is: where there is smoke there if fire and that could be the case with a Taiwan invasion some time in the long so distant future

Nvidia stock target $1000 The age of Nvidia has begun…this is an opportunity of a lifetime to go long.

NVDA Long Idea After Earnings NVDA announced a 10:1 stock split and another beat. The split is not far away, I expect major FOMO buying. Will be looking for an entry on a retest of its ascending wedge.

Nvidia: Healthy CompanyFundamentals:
From the management, the future looks bright for Nvidia. Their sales are accelerating and their earnings are growing. Healthy funds are piling in to the company. Its industry, the electron-semiconductor fabless industry, is booming (one of the top 20 industries). These things puts the wind at its back.
Technicals:
On a daily and weekly, Nvidia continues to make HHHL.
Daily uHd
Daily exDiv1
Weekly:
shallow pb
5ema pb
"Sometimes a stock goes up because everyone knows it is doing well.

NVDA well on the way to break 1000 Psych Target!GREEN TrapZone is back and UMVD Picked the end of retrace perfectly. We have a bit of steep angle 4 but it just means UNTIL we break it - we have very strong momentum up.
Angle 1 from the recent downtrend is close by, so it will be short term target, as loong as we have Green BARS and GREEN UMVD !

NVDA: Earnings Week AheadNVDA has been extremely rangey.
It has been operating within a larger bearish setup; however, my suspicion is that it soon should be invalidated because, in my opinion, no market top as of yet.
NVDA has been in this uptrend channel for some time, more of a wedge I guess you could say:
We ended the week right on support and within the next week bull/bear threshold range.
Probability for Monday is bearish which makes me think we will gap up and re-test on Monday. Look for the bull/bear threshold range as the support range into next week.
Bias is up, at least to the top of the channel but realistically NVDA will likely make a new ATH, maybe with earnings this week, but can't be certain.
I don't play earnings and am not going to count on 2 consecutive parabolic earning releases, I will catch it pre and after the move but not gambling the move myself.
Overall bias on the week is long to the high targets in the chart.
If you are an earnings gambler, I wish you luck! haha
Safe trades!

Small Account Challenge Day 8 +$522 on COIN & NVDA Stock SplitHad a decent day today thanks to COIN, but made some mistakes. Happy with the green day overall. Should be an interesting finish of the week. I would expect BTC and COIN to rally with NVDA, but there's not much life at the moment.

NVDA eyes on $952.16: in a BBOC pattern before earningsNVDA in a BBOC pattern under a serious resistance
BBOC pattern = "Birthday Balloon On Ceiling" (joke).
Point being that the earnings report might deflate it.
I think it will break and continue after earnings.
But IF there is to be a top anywhere NEAR here,
then THIS would is a perfect place and time for it.
$ 944.39 - 952.16 is the immediate resistance.
$ 894.22 - 901.92 is first support but a minor one.
$ 832.39 - 851.66 is a wide but significant support.
.
The immediate resistance zone is made by two high timeframe fibs:
Thick line at $952.16 is from the Genesis Sequence:
Dashed line at $944.39 is the Covid Stimulus wave:
.
I will post updates as price action progresses.
=====================================================================================================

Nvidia - Earnings, Channel, $1.000!Hello Traders and Investors, today I will take a look at Nvidia .
--------
Explanation of my video analysis:
If you are objectively looking at the stock chart of Nvidia, you can see that Nvidia is currently trading in a solid rising channel formation. But as we are speaking, Nvidia is retesting the upper resistance and considering that we just saw a rally of +700% without any real correction, it is quite likely that we will see at least a short term bearish rejection from here.
--------
Keep your long term vision,
Philip (BasicTrading)

NVIDIA - results due after the closeNVIDIA will report its latest earnings and revenues after tonight’s close. The ‘NVIDIA Effect’ has been a feature of the earnings season for about a year now. The semiconductor company is at the forefront of developments in generative AI and is critical in building the infrastructure required to power this technology. It has repeatedly surprised investors by announcing earnings and revenues which have blown way past analysts’ expectations. In addition, its forward guidance has been incredibly upbeat, and yet it has repeatedly beaten those expectations. NVIDIA has rallied 550% since the beginning of 2023. You can see on the chart where it exploded higher following the release of 2023 Q1 results. The stock is up 92% so far this year, and is back within 2% of its all-time high from early March. Could this be the day when the bubble bursts, assuming NVIDIA is in a bubble? The bar for success has certainly been set high. The Q1 consensus forecast is for earnings per share of $5.58 and revenues of $24.6 billion.
What happens after tonight’s close could also affect the wider market. NVIDIA is a major constituent of both the NASDAQ 100 and the S&P 500, and a huge favourite with investors and traders alike. In addition, moves in NVIDIA affect any stock with a connection to generative AI. It’s worth noting that volatility in the S&P 500, as measured by the VIX, is at its lowest levels since early 2018. This does suggest a degree of overconfidence when it comes to US equities, especially as they’re not particularly cheap at current levels. But as someone famously said about the Great Financial Crisis, while the music’s playing, you’ve got to keep dancing. That’s not financial advice by the way, and it would be fair to say that anyone taking a position in NVIDIA ahead of the call is going for a complete punt.

NVIDIA : WILL THE Q1 EARNINGS CONFIRM EXPECTATIONS ?- The giant chipmaker keeps trading higher, benefitting from both crypto and AI frenzy this year.
The market recently ended its consolidation in the shape of a bearish flag pattern, now trading back to its all-time highs just below the $1,000 mark.
- Investors are now bracing for big swing in the company's share price as the results for Q1 are to be published today after the closing bell.
Expectations are high as the company remains well positioned in new supertrends such as the AI boom and crypto markets which are going towards more and more regulations.
Traders and Analysts expect $5.65 of adjusted Earning Per Share and $24.69B on revenue from NVIDIA today.
Even if these may seem to be very ambitious figures, investors remember the company has already beaten high revenue expectation for many quarters in a row.
While it is impossible to know the actual figures before their publication, Technical Analysis tells us investors are on the optimistic side.
Indeed, the market has just ended its consolidation with a bullish break-out.
Moreover, both EMA are widening in bullish configuration while the RSI keeps evolving within its buying zone, with still a lot of upward potential.
If today's results were to match analysts' estimates, we could expect the long-term bullish trend to continue further above $1,000, with a final target around $1,340.
On the other hand, the unlikely scenario of disappointing earnings could significantly dent investor appetite for this market, leading to take profit moves and a sharp bearish correction as a reaction.
Pierre Veyret, Technical Analyst at ActivTrades.
The information provided does not constitute investment research. The material has no been prepared in accordance with the legal requirements designed to promote the independence of investment research and such is to be considered to be a marketing communication.
All information has been prepared by ActivTrades ("AT"). The information does not contain a record of AT's prices, or an offer of or solicitation for a transaction in any financial instrument. No representation or warranty is given as to the accuracy or completeness of this information.
Any material provided does not have regard to the specific investment objective and financial situation of any person who may receive it. Past performance is not reliable indicator of future performance. AT provides an execution-only service. Consequently, any person acing on the information provided does so at their own risk.

NVIDIA - ready for the earnings?
Regarding Nvidia, we maintain our view that Wave ((iv)) has concluded, and we are currently on the path to completing the overarching Wave 3. We anticipate this wave to reach between $1032 and $1300, which we consider the maximum potential target range for now.
We observed an accumulation phase from June 2023 to January 2024. This area might become significant again, possibly next year, as a zone for placing new entries. Currently, the market has left a lot of imbalances and shows very little volume on the way up because the price has been consistently surging.
With the earnings report due today, we can expect around 8.7% volatility in either direction, depending on the earnings outcome. It’s common to see even greater fluctuations than anticipated during such events. We will find out this evening after the market closes. For now, everything points towards the continuation of the upward trend.
Zooming in, it's clear that since reaching the 461.8% level, where we perfectly completed Wave ((iii)), we have seen the formation of Waves (i) and (ii) in the current move to complete wave ((v)). We anticipate expanding this upwards within the trend channel. Our tentative expectation is that the upcoming earnings report might outperform expectations, which would align with the chart’s indications.
If earnings exceed expectations, we could see a spike to a new all-time high, followed by a retracement marking Wave (iv) and then an overshooting Wave (v).
The target zones for Wave ((v)) are similar to those of Wave 3, lying between the 50% and 61.8% Fibonacci extensions. Specifically, we are looking at a range between $1123 and $1192.
After reaching these levels, we expect a significant pullback towards the Wave 4. This scenario would align with typical Elliott Wave patterns and provide opportunities for strategic entries and exits.

5/22/24 - $nvda - long.5/22/24 - vrockstar - NASDAQ:NVDA - on many fronts the stock is objectively 'cheap' when considering their 1) lead 2) moat (this includes sofware/ cuda) and 3) growth rate and seemingly unending (for now) backlog. high 30s PE, not bad for one of a kind growing EPS 50% cagr for next few yrs, 20x sales? expensive but put it in cash FCF terms, 2% yield at the low end? defensible.
the rub this q seems to be the anticipation of the new blackwell chips that could hold back ST orders for 2H buys. but let's think this thru... whatever they report won't matter - right? it's about the future/ guide. and 1) a miss gets papered over by this guide and 2) a beat + this higher order backlog ships the stock higher. this is a name that basically won't relent until there's an observable problem or demand issue w/ compute. we're nowhere near that despite what people are saying about "ai being a bubble" - most of these are the same folks that still don't own CRYPTOCAP:BTC and say "i buy blockchain tech, but not bitcoin" and so are typically the lazy types that can't fathom being wrong. make no mistake there WILL be a point to sell your nvda for a better horse. but right now it's the fastest one by a large margin. i own this into print, and will dip buy any miss without a second thought.
it's more about size mgmt into the print, not whether you should own it at all. will eventually post my full val framework in the Q, but think the 1-2y tgt here is probably $2000-$3000k stock. there's a lot of juice left. short-term, i think upside probably limited to the low $1000's. so sub $1000 is a good risk beta.
gl fam, curious on your thoughts

NVDA
Following NVDA's earnings after hours, it seems everyone has their eyes on the $1,070 mark, suggesting a potential 11% upside. However, it's worth noting that sometimes good news can have negative repercussions, and vice versa. For instance, despite Taiwan Semiconductor Manufacturing Co. (TSM) reporting strong earnings, its stock still plummeted by 10%. TSM manufactures chips for numerous companies, including NVDA. Additionally, the chart is showing a triple top pattern, which is considered quite precarious. It's more probable that NVDA might decline to $883 before experiencing a significant surge.

$NVDA Implied move for Earning today in After hoursNASDAQ:NVDA Implied move for Earning today in After hours
The implied move for NVDA earnings today is +/-80… place your bets

Nvidia Earnings Poised for Surge as AI Adoption Faces ScrutinySemiconductor giant Nvidia prepares to deliver its first-quarter earnings report on Wednesday, a closely watched event for investors gauging the health of the artificial intelligence (AI) sector.
Market Expectations Point to Explosive Growth
Analysts anticipate a banner performance from Nvidia, fueled by surging demand for its AI chips. Revenue and profits are projected to exhibit exponential growth, with estimates suggesting:
Adjusted earnings per share: $5.65 (400% year-over-year increase).
Revenue: $24.69 billion (200% increase from the prior year).
The Data Center segment, driven by cloud service providers like Amazon and Google, is the primary growth driver. The Gaming segment also contributes positively.
Emerging Challenges in the AI Landscape
Despite positive projections, Nvidia faces potential headwinds:
Transitional Hiccups: The shift from Hopper to Blackwell architecture might cause temporary sales slowdowns as customers wait for the new, more powerful chips.
Competitive Pressures: Tech giants like Amazon developing custom AI chips could threaten Nvidia's market share.
Positive Outlook Prevails Despite Cautious Optimism
Overall sentiment remains optimistic. Nvidia is a leader in the AI chip market, with analysts bullish on its future. The stock price has reflected this confidence with a recent strong performance.
Upcoming Earnings Report: A Critical Barometer
Wednesday's earnings report will be crucial for gauging AI sector momentum and Nvidia's ability to navigate technological changes.
Trading Strategy
Buy at: $975.84
Take Profits at:
T.P_1: $986.77
T.P_2: $1000.00
T.P_3: $1028.34
T.P_4: $1051.81
T.P_5: $1085.00
T.P_6: $1114.86
T.P_7: $1146.96
T.P_8: $1161.76
T.P_9: $1191.66
Stop Loss at: $830.06

NVIDIA Ascending Triangle: Price Surge Ahead?- The 1hour ascending triangle chart pattern for NVIDIA indicates an upward trend.
- An uptrendline from $889.38 rejected the price at $917.77 after retracing from $958.58, which currently serves as resistance.
- The price continued upward after the rejection and is now around $953.77.
- If the uptrendline rejection holds, the price is likely to rise to the resistance level, and breaking the resistance could push the price higher.
- If the uptrendline rejection fails and the uptrendline breaks to the downside, the price is likely to decline further.
Risk Warning: Trading in CFDs is highly speculative and carries a high level of risk. It is possible to lose all of your invested capital. These products may not be suitable for everyone, and you should ensure that you fully understand the risks taking into consideration your investment objectives, level of experience, personal circumstances as well as personal resources. Speculate only with funds that you can afford to lose. Seek independent advice if necessary. Please refer to our Risk Disclosure.
BDSwiss is a trading name of BDS Markets and BDS Ltd.
BDS Markets is a company incorporated under the laws of the Republic of Mauritius and is authorized and regulated by the Financial Services Commission of Mauritius ( FSC ) under license number C116016172, address: 6th Floor, Tower 1, Nexteracom Building 72201 Ebene.
BDS Ltd is authorized and regulated by the Financial Services Authority Seychelles (FSA) under license number SD047, address: Suite 3, Global Village, Jivan’s Complex, Mont Fleuri, Mahe, Seychelles. Payment transactions are managed by BDS Markets (Registration number: 143350)
