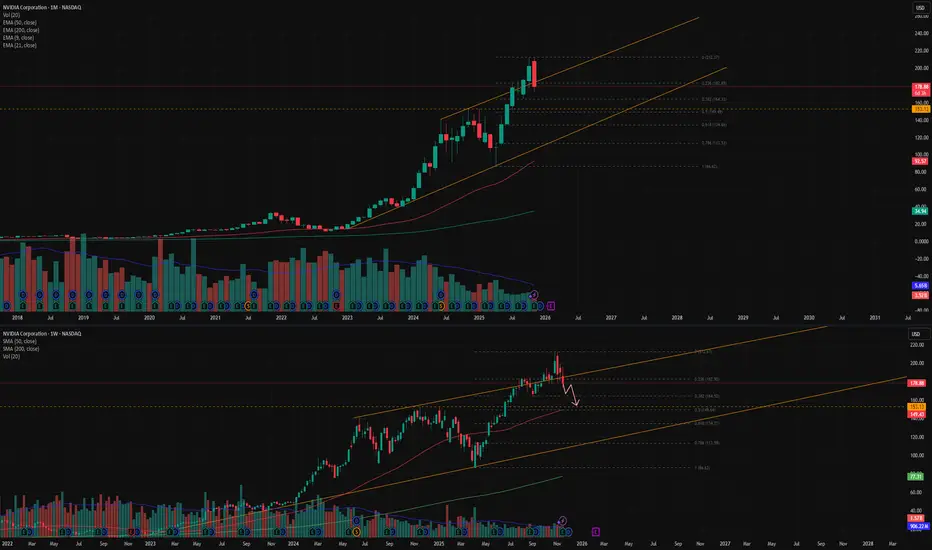
NVDA ALERT: Critical Drop AheadNvidia remains in a broader uptrend, but the chart shows a clear trendline breakout followed by the beginning of a pullback.
Using Fibonacci, a correction typically starts after a red candle forms following a sequence of green candles. In most cases, the pullback continues toward the 0.5 retracement level. In this setup, the 0.5 level aligns with a major key support, increasing its importance.
On the weekly timeframe, the 50 EMA is also converging at the same zone, which often acts like a magnet for price. This creates multiple confirmations pointing toward a potential move downward.
The weekly chart has printed a bearish engulfing , followed by three consecutive red candles, adding another strong confirmation for a continued correction.
Both MACD and RSI are sloping downward, supporting the bearish momentum.
If price reaches the expected zone, monitoring the reaction will be critical. A deeper decline into the global trendline is possible only if the key level is broken, though this scenario appears less likely.
Overall, NVDA shows several aligned signals indicating a move toward the correction zone before any potential recovery.
Trade ideas
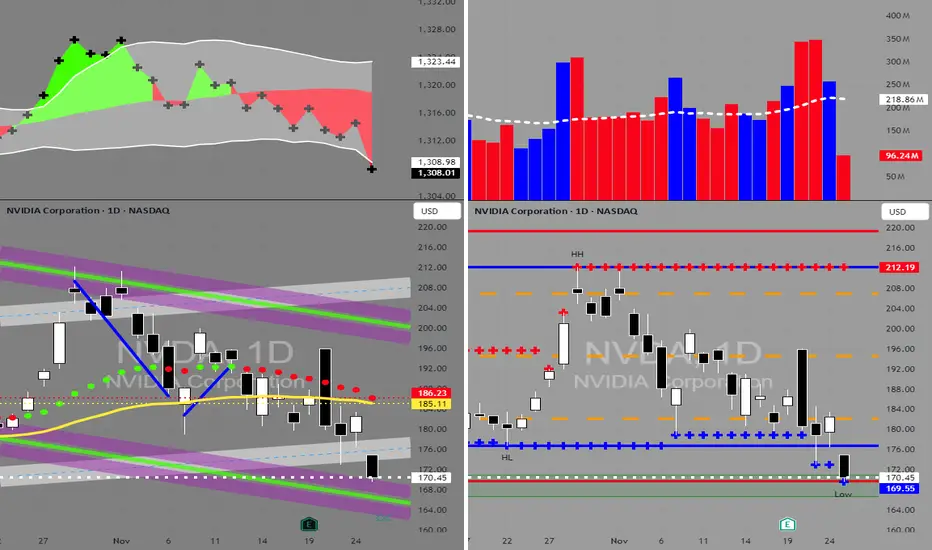
NVDA in BUY ZONEMy trading plan is very simple.
I buy or sell when at either of these events happen:
* Price tags the top or bottom of parallel channel zones
* Money flow volume spikes beyond it's Bollinger Bands
So...
Here's why I'm picking this symbol to do the thing.
Price in buying zone near bottom of channels
Money flow momentum is spiked negative and under bottom of Bollinger Band
Entry at $170
Target is moving average at $185
Looking to catch a quick bounce this week.
Will be buying as low as $167.
Set your own stop.
Will Nvda crash the AI bubbleThis channel is not providing individualized trading or investment advice, nor is it a banking service, brokerage service, trading service, investment service or money management service

Nvidia poised for rebound as support holds despite recent sell-o
Current Price: $183.11
Direction: LONG
Confidence Level: 68%
Targets:
- T1 = $186.00
- T2 = $193.00
Stop Levels:
- S1 = $180.00
- S2 = $175.00
**Wisdom of Professional Traders:**
When I combine what multiple professional traders have been sharing, I'm seeing a setup where the recent pullback in Nvidia is being treated more as a buying opportunity than a sign of deeper trouble. Several traders are watching the $180 area as a key short-term support, pointing out that despite intense volatility and "pump-and-dump" style reversals around earnings, the underlying fundamentals and demand for AI hardware remain strong. The collective view leans toward upside if key resistance levels are reclaimed this week.
**Key Insights:**
Here's what's driving my thinking — the $184 level has been cited over and over as a critical pivot. A sustained move above that could quickly attract momentum buyers again. While bears have been vocal post-earnings, the consensus from market experts is that Nvidia’s growth story hasn’t changed; the sell-off was largely technical and sentiment-driven. Repeated mention of potential rallies into gaps above $190 adds weight to a bullish bias.
What's interesting is that traders are balancing concerns over valuation with the reality of Nvidia’s unique market position. Many acknowledge Michael Burry’s short and general AI bubble fears, but they’re countering that with hard numbers: record revenues, data center and networking growth, and still-dominant market share. That tug-of-war is exactly why reclaiming $184 is such a big psychological shift.
**Recent Performance:**
This all played out in the price action last week. Nvidia gapped up after its earnings beat, ran into resistance just under $200, and then reversed hard, dropping almost 6% in a single session to tag its 21 EMA around $179. We saw multiple intraday swings of 3-5%, reflecting just how reactive traders were to each headline. Still, the $180 zone held into the week’s close.
**Expert Analysis:**
Several professional traders I track are framing the $180-$184 band as the immediate battlefield. They expect buyers to defend $180 in the short term, with any push above $184 potentially triggering a squeeze toward $190-$193 — levels mentioned by more than one commentary. Others note that the stock has pulled back into a prior consolidation zone from August, which often acts as a demand area for swing traders.
The professional consensus also points out that Nvidia still commands a 90% share of the AI chip market, and demand massively outpaces supply. That fundamental backdrop is why even technically-oriented traders are leaning to the long side here despite recent bearish chart patterns.
**News Impact:**
The main news catalyst remains U.S.-China trade policy chatter — any positive movement toward allowing Nvidia to sell advanced chips to China has prompted immediate price spikes. On top of that, the market is still digesting blockbuster earnings that were overshadowed by valuation worries. If geopolitical developments break positively this week, they could be the trigger that catches shorts off guard and propels price above the critical $184 level.
**Trading Recommendation:**
Here’s my take — with support at $180 still intact and multiple traders eyeing a move above $184, the risk-reward for a tactical long makes sense this week. I’d look to enter around current levels, with stops just under $180 to protect capital. Initial target sits at $186 for a quick momentum trade, and if that breaks, aim for $193 where the next overhead supply is likely to show up. This remains a short-term swing idea while the technical and news catalysts align.

NVIDIA (NVDA): Where Are We in the Cycle?Ticker: NVDA
Category: Market Structure / Elliott Wave Analysis
Author’s note: Educational analysis — not financial advice.
🧠 Market Context
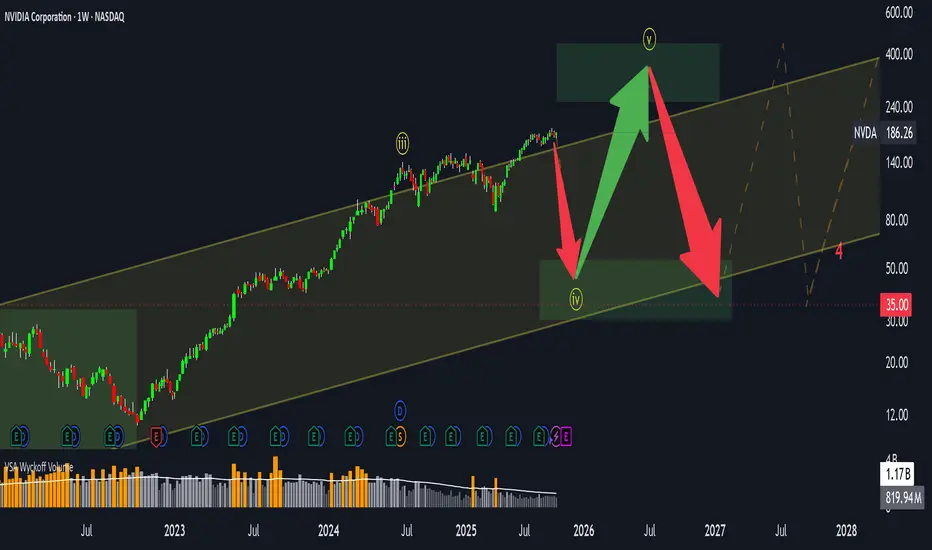
NVIDIA has been one of the strongest growth stories in the last market cycle. However, after such a powerful move, many traders are now asking: Where are we in the broader structure — and what could come next?
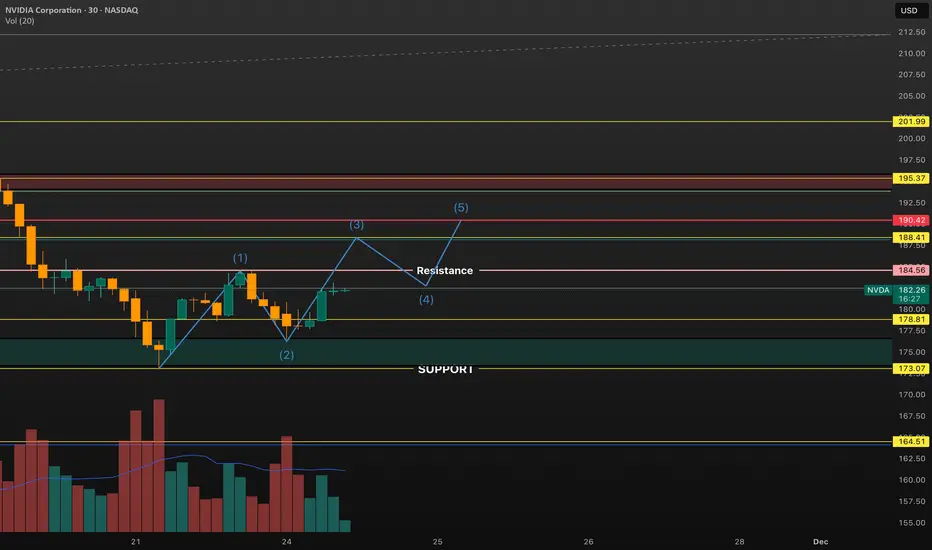
From a structural perspective, NVDA appears to have completed its third Elliott Wave, with the fourth wave currently in progress. This phase often reflects a period of consolidation, where the market digests previous gains before potentially starting the fifth wave.
📊 Elliott Wave Structure
Through the lens of Elliott Wave theory:
Wave 3 — likely completed after the parabolic advance that marked NVIDIA’s latest all-time highs.
Wave 4 — a corrective phase, potentially forming a sideways or slightly downward structure.
Wave 5 (ahead?) — may still occur, possibly extending above the upper boundary of the current price channel.
However, once the fifth wave completes, markets typically enter a longer consolidation or corrective phase — often retracing 50–60% of the total move from the highs.
⚙️ Volatility and Price Range
Currently, NVDA is trading within a broad channel, roughly between $100 and $400+.
Volatility remains elevated — which suggests that the sideways phase could persist for several months, or even longer.
Such behavior is common in late-cycle stages when large market participants distribute part of their holdings while retail interest remains high.
📈 Key Takeaways
The main impulsive move seems to have already played out.
The market may enter a range-bound or sideways phase, with local rallies still possible.
Correction risks are gradually increasing, especially if the fifth wave develops and fails to sustain new highs.
In short, this might not be the best time to chase — but rather to observe how price behaves within the current channel.
💬 Final Thoughts
This analysis is purely educational and reflects one possible scenario based on market structure.
No one can predict the exact timing or depth of the next move — the market always decides.
👉 What do you think?
Are we already in the correction phase, or is there still one more leg up left for NVDA?
Share your view in the comments below 👇
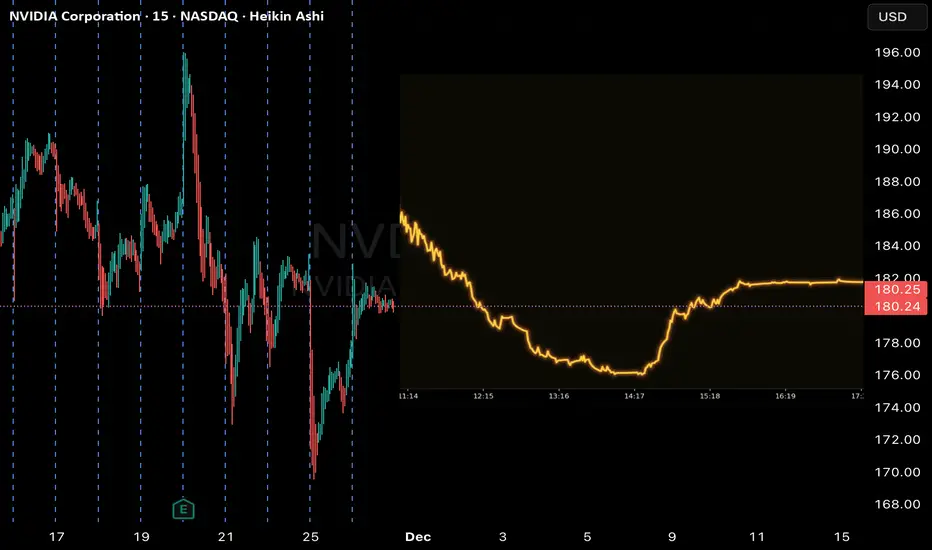
NVDA Put Alert | QuantSignals V3: Katy AI Predicts Short-Term
Signal Type: 1-Month Prediction (QuantSignals V3)
Date: 2025-11-26
Current Price: $180.19
Predicted Price: $177.34 (-1.58%)
30-Min Target: $178.91 (-0.71%)
Trend: Bearish
Confidence: 60.6%
Volatility: 16.7%
Trade Signal: PUT
Entry: $180.19
Target: $177.91
Stop Loss: $182.89
Expected Move: -1.58%
Analysis Summary:
Katy AI predicts a short-term downward trajectory.
Technical resistance near $182.89 acts as stop loss level.
Moderately high confidence (60.6%) indicates some caution is warranted.
Volatility at 16.7% suggests moderate price swings.
Key Notes:
No additional trade signals; single-symbol analysis.
Ideal for traders looking for short-term bearish exposure.
Nvidia plummeted amid the threat of competition from GOOGL
Optimism surrounding the Gemini 3 and news that Alphabet (GOOGL) will internally supply its TPUs to Meta Platforms (META) supported the AI rally. On the other hand, Nvidia (NVDA) experienced a significant decline due to concerns over the potential GOOGL threat.
Mizuho noted that the "Google wins, OpenAI/Nvidia loses" trade is gaining traction, accelerating the sell-off in OpenAI-related stocks like NVDA and Oracle (ORCL).
Meanwhile, the US administration's decision regarding the allowance of NVDA's H200 chip sales to China remains a potential positive catalyst for future NVDA stock prices.
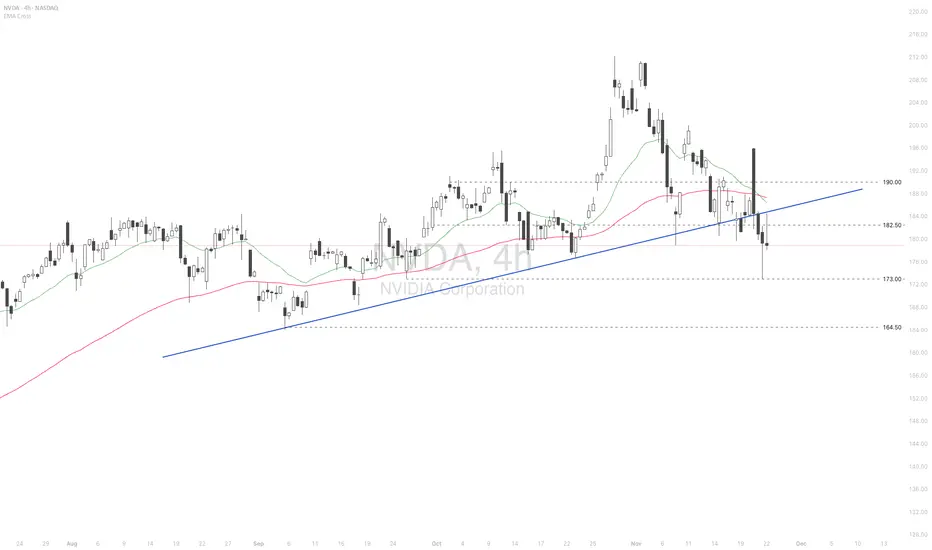
NVDA briefly fell below the support at 173.00 after breaking below the ascending trendline. Diverging bearish EMAs indicate a potential extension of the downtrend.
If NVDA breaks below 173.00 again, the price could further decline to the next support at 164.50.
Conversely, if NVDA closes above 182.50, the price may advance toward the following resistance at 190.00.

Nvda break through ~184? Can we see higher this week Nvda looks good this week with bounce on support and look for a test of 184. There is a lot of selling pressure in 190's get through that back to all time high. But for this week lets get over 184 first. My opinion only
NVDA: Key Support at 116.94 and Long-Term Target at 258.33NVDA is attempting to stabilize after a corrective decline, trading just above an important Fibonacci retracement cluster. The broader structure remains constructive as long as price holds above the major support at 116.94, which represents a strong liquidity base and a key long-term demand zone.
A sustained reaction above the current region may open the way for a continuation of the broader bullish cycle. The next upside levels to monitor are:
217.73 (0.75 Fib extension)
242.09 (0.90 Fib extension)
258.33 (primary upside target)
These targets remain valid while the price maintains a higher-low structure.
Alternative Scenario
If the current rebound fails, NVDA may revisit the major support at 116.94. A reaction from this level would still align with the long-term bullish outlook and may serve as a stronger accumulation point before the next upward leg.
Conclusion
The trend remains upward-biased with 258.33 as the main projected target, provided that 116.94 continues to act as the dominant structural support.

NVDA LongBroader Market Structure
NVDA has been in a short-term bullish corrective structure after forming a BOS at $179.91, which marked the end of the prior bearish leg. Since that break, price has been forming higher lows and higher highs on the intraday structure. However, the most recent swing into the $194–$195 supply produced a sharp rejection, showing that the bullish structure is still counter-trend relative to the larger bearish swing from the $202–$205 highs. No new CHoCH has printed yet, but the aggressive selloff from $195 signals a potential short-term shift in control back toward sellers unless demand holds.
Supply & Demand Zones
The upper supply zone at $194–$195 remains strong; price dropped sharply from this level with long-bodied bearish candles, showing active institutional selling and low willingness from buyers to absorb orders. The deeper supply above, between $199–$202, is an even stronger zone because it originated the major downside impulse that broke structure.
On the buy side, the demand at $185–$183 previously showed clear strength—buyers stepped in aggressively and pushed price upward with momentum—which tells us the zone still carries validity. The lower demand between $181–$178 is even more important, as it’s the origin of the BOS at $179.91 and represents the last confirmed defensive line for bulls.
Price Action Within the Marked Region
Price is currently falling from the $195 rejection and heading toward the $185–$183 demand you marked. Candles show increasing wick size on the way down, suggesting early signs of selling exhaustion but not yet a reversal. As price enters this demand, we should see either absorption or continuation. If buyers defend the zone as they did previously, a corrective bounce toward $192–$194 is likely. If demand fails, price will unwind quickly into the deeper $181–$178 liquidity pocket.
Expectation, Bias & Invalidation
Trade bias: short-term bullish, expecting price to dip into demand and bounce into the lower supply.
Expected direction: a pullback into $185–$183, followed by a rally into $192–$194.
Invalidation: a clean close below $183, which would signal sellers have regained full control and shift the outlook to bearish continuation toward $181–$178.
Momentum & Candle Behavior
Momentum currently favors sellers, given the fast drop from supply, but the decline is becoming more controlled—suggesting momentum is fading as price approaches demand. No confirming reversal candles have appeared yet; we will need to see a long-wick rejection, engulfing candle, or clear absorption footprint at demand to confirm the bounce scenario.

NVDA TARGETSupport and 200 ma down at 155. Where it goes from there is a ?? — that 😈 top seems hard to get above.

NVDA | Long | R/S Flip at 172 + 0.5 Fib | Nov 20, 2025NVDA | Long | R/S Flip at 172 + 0.5 Fib + VWAP Support in Rising Channel | Nov 20, 2025
🔹 Thesis Summary
NVIDIA remains the S&P 500’s largest single weight and the AI-infrastructure bellwether. After a fast shakeout to channel support, the chart sets up a defined-risk long as risk sentiment sits at Extreme Fear—a backdrop that historically favors mean reversion and leadership rebounds.
🔹 Trade Setup
Bias: Long
Entry Zone: 172–182 (R/S flip and ~0.5 retrace inside the ascending channel)
Stop Loss: 152–156 (below VWAP/structure and prior base)
Take-Profits:
TP1: 188–192 (channel mid / prior supply)
TP2: 205–208 (upper-mid channel)
TP3: 214–220 (channel top / measured move)
Max Target: 230–246 (channel extension if trend resumes)
R:R (from ~175): ~1.5–3.0 depending on exit path and scaling.
🔹 Narrative & Context
Structure: Daily up-channel intact; recent spike down tagged the lower rail and immediately reclaimed the R/S band near 172. That zone aligns with ~0.5 Fib of the prior impulse and anchored VWAP support—classic “shakeout-and-go” anatomy.
Flow: Pullbacks within strong secular trends often pivot when broader risk metrics hit extremes. Current readings show Extreme Fear across equities and crypto (dashboard needles in single-digits/low-teens), consistent with forced-de-risking rather than trend change.
Leadership: Info Tech is 34% of the S&P 500 by weight. NVDA itself sits at ~8.06% of the index’s top-25 weight table—structurally important for passive flows. Re-risking tends to bid the heaviest weights first, providing tailwinds if indices stabilize.
Correlations to watch: NQ strength, breadth stabilization in SOX, and dollar drift lower typically amplify NVDA recovery legs.
🔹 Valuation & Context (Pro Metrics, Framed Simply)
Forward P/E: ~35–45x vs Semi/Tech peers typically ~20–25x → Market pays a premium per $1 of next-12-mo earnings → Premium reflects dominant AI compute share and visibility; multiple compression risk is why we anchor to defined stop.
P/FCF: High-teens to 20s vs peers in low-teens → Investors pay up for cash conversion → Acceptable so long as AI DC demand/ASP mix persists.
Quality (ROE/ROIC): Very high (well above typical large-cap tech) → Capital turns + software stack (CUDA) lift returns → Supports buying pullbacks, not chasing verticals.
Growth: EPS growth well above sector on AI data-center ramps → Outlier growth justifies trend-following bias.
Risk (Debt/Equity): Low/Conservative → Balance sheet flexibility if cycle wobbles.
🔹 Contrarian Angle (Your Edge)
Consensus fixates on “too expensive” optics and headline sentiment. The technical reaction at 172–182 with fear gauges at extremes argues for a positioning reset, not a trend break. With channel structure intact and flows concentrated in megacap AI, we see a credible path toward 214–220 first, then 230–246 on continuation.
🔹 Risks
Positioning/Multiple Risk: Any guide-down or supply hiccup can compress the premium multiple.
Sector Rotation: A sharp unwind in AI/semis or factor shift to defensives.
Macro Shock: Dollar spike/real-yield jump or regulatory headlines impacting export mix.
🔹 Macro Considerations
Sentiment: Equity & crypto Fear & Greed dials show Extreme Fear (single-digit/low-teens) — fuel for relief rallies when flows turn.
Index Mechanics: Tech at 34% of S&P weight; NVDA among top index constituents (~8.06% of top-25 weight list). Stabilization in SPX/NQ mechanically supports NVDA.
Flow Triggers: SOX breadth thrust, NQ reclaim of prior breakdown area, and any cooling in rates/FX volatility would accelerate the upside path.
🔹 Bottom Line
NVDA’s premium is real, but so are its cash generation and AI demand drivers. The 172–182 buy-zone offers a clean, conviction long with 152–156 as invalidation. Manage in tranches toward 188 / 205 / 214–220, leaving a runner for 230–246 if momentum and macro confirm.
🔹 Forward Path
If this gains traction (10+ likes), I’ll post: (1) a weekly/time-frame add-on with updated channel math, (2) live notes on any break/retest of 205 and 214–220, and (3) Q&A on risk management.
Like & Follow for structured ideas, not signals. I post high-conviction setups here before broader narratives play out.
⚠️ Disclaimer: This is not financial advice. Do your own research. Levels derived from the attached chart; sentiment and index weights from the referenced images. Charts/visuals may include AI enhancements.
🔹 Footnote
Forward P/E: Price divided by expected earnings over the next 12 months. Lower = cheaper relative to profits.
P/FCF (Price-to-Free-Cash-Flow): Price vs. the cash left after investments. A measure of efficiency.
FCF Yield: Free cash flow per share ÷ price per share. Higher = more cash returned for each dollar invested.
ROE (Return on Equity): Net income ÷ shareholder equity. Shows management efficiency with investor capital.
ROIC (Return on Invested Capital): Net income ÷ all invested capital (equity + debt). A purer profitability gauge.
Debt/Equity: Debt divided by equity. <1 usually means balance sheet is conservative.
R:R (Risk-to-Reward): Ratio of expected upside vs. downside. 3:1 = you risk $1 to make $3.

NVDA – Inventory Panic or Blackwell Positioning?Nvidia just became the center of another “AI bubble” debate after headlines highlighted a 32% Q/Q inventory increase. The surface-level take was bearish, but the clarification from management changed the context. According to today’s memo, the buildup is preemptive staging for the Blackwell platform, not a sign of weakening demand. These units are tied to presold systems, meaning this is logistics positioning, not channel stuffing.
On the tape, the story is more technical than fundamental. Heavy insider selling (CEO/CFO), hedge fund trimming, and SoftBank pressure all created the sell-side imbalance we’ve been seeing for weeks. But despite those headwinds, the chart continues to defend major support zones.
Key Observations:
• 177–178 acted as the first demand pocket, aligning with trend support and prior volume nodes.
• Price continues trading within a controlled downtrend, but each flush is producing diminishing downside extension—a sign of seller exhaustion.
• The real liquidity magnets remain below:
– 172.93
– 170.69
– 164.01 (golden support if the market unwinds further)
The bearish narrative points to elevated inventories and institutional unloading. The bullish narrative focuses on Blackwell staging and enterprise AI demand still being early-cycle. Both can be true at once. That’s why the environment favors high-probability scalps, not oversized directional bets.
My Read: This is a volatility market. NVDA is still in discovery mode, and both sides will get opportunities. Until NVDA reclaims 182.55, sellers maintain short-term control. A break below 172.93 opens a path into the 170/169s where real buyers should step in.
This isn’t about predicting a hero reversal—it's about respecting levels and trading the reaction.
📌 PROFIT TARGETS & STOP ZONES (Required by TV)
Upside Targets:
• 182.55 (first resistance)
• 186.20 (gap fill supply zone)
• 190.17–191.05 (major distribution shelf)
Downside Targets:
• 172.93
• 170.69
• 164.01 (golden support)
Invalidation / Stop Zone:
• Close above 186.50 invalidates the short-term bearish drift.
• Close below 170 invalidates the shallow bounce thesis and opens deeper liquidity.

Nvidia loses steam despite exceptional 3Q performance
Nvidia (NVDA) posted a record-breaking 3Q performance, with revenue surging 62% YoY to 57 bln USD. Its 4Q guidance points to another 65% increase, reinforcing optimism that growth momentum will continue to accelerate. CFO Kress noted that the guidance does not include any contribution from China sales, while CEO Huang pushed back against recent AI-bubble concerns raised by Michael Burry.
Nevertheless, AI valuation risks remain elevated. Beyond strong earnings, the scale of AI infrastructure spending and the surge in bond issuance required to fund it continue to dampen investor sentiment.
Goldman Sachs (GS) has warned about the fragility in the private credit market. The firm highlighted that Blue Owl Capital, with more than 295 bln USD in AUM, over half of which is credit-exposed, has seen its share price fall nearly 30% since Sep. Major credit-heavy players such as KKR and Blackstone are also showing signs of pressure, underscoring how AI-driven anxiety is spilling into private credit.
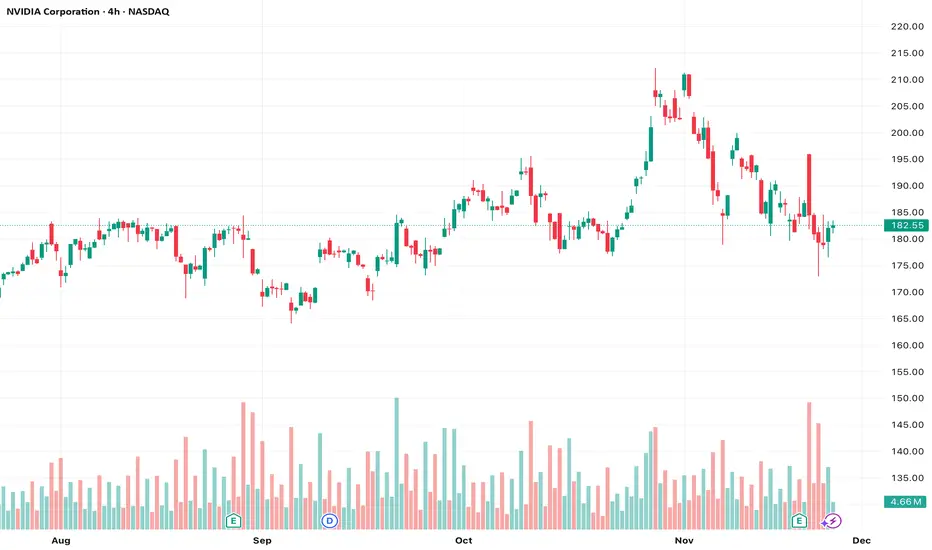
NVDA briefly breached above the psychological level at 195.00 but surrendered all gains, falling back below 182.00. The price remains under the death-crossed EMAs, indicating a potential expansion of the bearish bias.
If NVDA breaks below the support at 173.00, the price could decline further toward the following support at 164.50.
Conversely, if NVDA breaches above the resistance at 182.50 and the ascending trendline, the price may advance toward the subsequent resistance at 190.00.
NVDA CORRECTION - MONTHLYThe last 2 corrections based on Monthly chart were roughly 55% and 65%.
Weekly and Monthly charts on indices look like they are trending down. Weekly VIX is in an uptrend. Weekly DXY is in an uptrend.
Overall, it feels like the safest bet is cash or maybe bonds. I don’t love the bond charts, so cash?? Even Buffet has a big cash position…
** This post is my opinion on investment positions, not trading. I use daily or intraday for trading TA.

NVDA Head and Shoulders- Neckline BrokenNvidia’s bear case rests on one core idea: the stock price assumes a flawless, world-eating AI future, and markets almost never deliver on “perfection narratives.” NVDA trades at extreme valuation multiples for a hardware-driven, highly cyclical business. Those multiples only hold if AI infrastructure spending keeps compounding at its current breathtaking pace for years. But that demand is dangerously concentrated in a handful of hyperscalers who are spending now and rationalizing later. Michael Burry’s recent argument sharpens this point: he claims true end-demand for AI horsepower is vastly overstated, and that much of the current GPU frenzy is a self-reinforcing loop of capital, hype, and accounting gimmicks rather than broad, organic need. If boards pause to question real ROI — or if the circular funding loop breaks — Nvidia’s revenue curve can flatten quickly, dragging the valuation down with it.
Competition, long dismissed by NVIDIA bulls, is another structural headwind. AMD is now shipping accelerators that hyperscalers are actually integrating, and every major cloud provider is building in-house silicon to reduce dependence on NVDA’s margins. Even if Nvidia maintains leadership, it doesn’t need to lose the crown to lose the multiple — slight shifts in workload allocation or a handful of missed design wins are enough to pressure margins. And Burry’s critique deepens this point: he argues Nvidia’s reported profitability is flattered by depreciation assumptions and massive stock-based compensation that buybacks have failed to offset — meaning the “true” economic profit is less bulletproof than headlines suggest. Add to that the fact that U.S. export controls have effectively erased the China data-center market — once 20–25% of revenues — and expectations of a seamless global TAM look increasingly unrealistic.
Technically, NVDA is doing exactly what a euphoric, overowned stock does when gravity starts tugging: momentum is fading, the price is slipping under short-term moving averages, and reactions to spectacular earnings have been strangely sluggish. That’s often the early signature of distribution rather than accumulation. And this lines up directly with Burry’s broader thesis: when a narrative becomes crowded and reflexive, the slightest wobble triggers violent air pockets. NVDA has become the ultimate proxy for the AI boom, the most crowded long in the market — meaning it’s the first thing funds sell when risk appetite cools, and the last thing buyers chase during corrections.
Put simply, Nvidia is a phenomenal company priced as if nothing can ever go wrong — while Burry is arguing that much of what looks “perfect” is not what it seems. The bear case isn’t that Nvidia collapses. It’s that the AI boom normalizes, competition accelerates, accounting realities catch up, margins slip toward something earthbound, and investors recalibrate how much they’re willing to pay. In that world, NVDA doesn’t need bad news to fall. It only needs the news to arrive slightly less euphoric than the fantasies currently baked into the price.
#NVDA #Bearish #HeadandShoulders #MichaelBurry

Bear case $NVDAIf we’re sitting in a 1999-style setup — which the chart strongly suggests — then the next move shouldn’t surprise anyone:
NASDAQ:NVDA

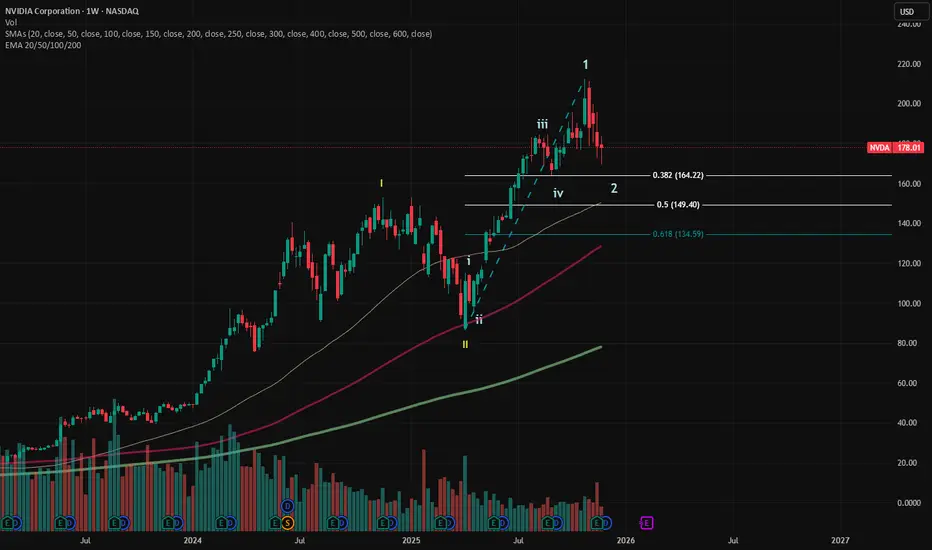
$NVDA: Wave 2 correction in placeNASDAQ:NVDA : I'm long term bullish on NVDA. I count the current weakness as a Wave 2 correction. Wave 2 can correct deeply. Presently, it has not corrected 38.2% yet.
I have a long term NVDA position that accounts for 2.7% of my portfolio. If it drops to 38.2% retracement area, I'll add. If not, I'm happy with holding my current position.
Currently, I'm 8% in cash.
Why Structure Beats Prediction|The Core Philosophy of UIA **Why Structure Beats Prediction|The Core Philosophy of UIA
(英文为主・中文为辅)**
Most traders try to predict market direction.
But prediction is unreliable, emotional, and impossible to repeat.
At UIA Institute, our core belief is simple:
Markets cannot be predicted.
But structure can always be read.
(中文:市场无法预测,但结构可以被读取——这是 UIA 方法论的核心。)
🔵 1. Why prediction fails(预测为何不可靠)
Prediction depends on assumptions, and assumptions fail because:
Liquidity shifts without warning
Macro events disrupt trends instantly
Reversals never send a notification
Emotions distort expectations
Every prediction increases the gap between “what we think” and “what the market actually does.”
(中文总结:预测依赖假设,而假设越多,错误越多。)
🔵 2. Why structure works(结构为何可靠)
Structure is built from facts, not guesses.
Price → Volume → Reaction → Rhythm
These reflect what has already happened, and therefore can be read objectively.
Structure tells us:
T — When a trend starts
E — Whether the trend is extending healthily
H — Where key swing points form
X — When the trend is exhausted and ending
(中文:结构来自“市场已经发生的事实”,因此可被辨识、可被重复。)
🔵 3. Reacting beats predicting(反应比预测更强)
The UIA methodology is designed around one principle:
Don’t predict the future.
React to the structure.
Reacting means:
You act on confirmed information
You avoid emotional bias
You stay synchronized with real market rhythm
You reduce unnecessary trades
This dramatically improves consistency and longevity.
(中文:UIA 做的是“结构出现后再反应”,成功率高得多。)
🔵 **4. Structure is the only repeatable edge
(结构是唯一可重复的优势)**
Indicators change.
News changes.
Sentiment changes.
But structure is timeless.
Price will always move in rhythms of:
Expansion
Pullback
Continuation
Exhaustion
Reversal
This universal rhythm is why UIA focuses exclusively on structural reading.
(中文:结构具有可重复性,是任何市场、任何周期都适用的通用语言。)
🔵 5. Conclusion(总结)
Prediction creates stress.
Structure creates clarity.
Structure allows traders to understand:
What the market is doing now
When to participate
When to exit
When to stop
When to observe
When to wait
This is the foundation of the UIA Trend Engine, Wave Engine, and TSX Engine.
(中文:结构让交易回到“可控、可读、可执行”的节奏。)
Pre-Nvidia Q3 2025 EARNINGS - Two Scenarios to WatchNVDA is sitting right on the Anchored VP POC with an oversold Stoch RSI and price trading under the EMA-20 Bollinger band (1 std). That’s the same setup that has triggered reversion bounces multiple times this year.
Scenario 1 — Bounce and Band Chop (Green Path)
If NVDA holds the POC, the most natural move is a bounce back into the EMA-20 band's high.
From there, expect price to whip around inside the band because that’s been its early 2025 behaviour: revert → chop → retest.
The upper band sits just under $200, a psychological and structural resistance.
This is the high-probability scenario if earnings are neutral or strong.
Scenario 2 — Break Below POC and Turn It into Resistance (Red Path)
If earnings disappoint and NVDA gaps below the POC tomorrow, that same level becomes a potential resistance on any intraday bounce.
But — and this is the part many people miss —
Scenario 1 is still valid unless we get a clear rejection from the underside of POC.
Meaning:
A break below POC is not automatically a trend shift
A failed reclaim with a clean rejection is the real confirmation
Only then do we look toward the next structural level at the Jan Top zone around 155–160.
NVDA is at a decision point. Earnings drop after today’s close — the real move will be at tomorrow’s open. Whether we bounce into the band or reject off the POC will tell you everything about the next leg.

Hi, i'm trying to revisit the Nvidia Journey here i'm trying to do some historical analysis , trying to find some important historical patterns which impacted the Nvidia price movement then and still valid or might impact the future price movement
I' hv a strong believe that price move within the constraint of the historical patterns and form new one for the future
full analysis will take few days, today , i'm starting with simple tl/angles formed by the first 2 monthly candles , in next 3 graphics u will find the impact of these 2 angles

Concerns on market specifically NVDA - Not financial adviceSome thoughts and concerns watching the market as an amateur investor looking at historical shifts and trends. This is not a prediction and not to be considered financial advice in any manner shape or form. It is simply a personal opinion based on my impression of the market. Please discuss any choice you make in the market regarding trades with a financial advisor or planner as this opinion is just an uneducated perspective to be taken with a grain of salt from someone who does not work in the financial industry. There are several factors I have taken into account regarding the economy, job losses, looming Debt Wall, real estate market concerns, tariff pain points for US, recession chatter, dollar weakness, US debt and my personal gut check.
Disclosure - I do not currently hold NVDA but I have a standing buy order for my personal account for NVDA at $50. I do not know the market well enough to short.

NVDA Head and Shoulders- Dec Rate Cuts has changed setupNvidia’s setup has shifted. With the Fed signaling a likely rate cut on December 10th, the market will start baking that optimism into asset prices ahead of time. When monetary conditions ease, high-valuation tech often gets an extra tailwind, which means the expected head-and-shoulders pattern on NVDA may fail to play out cleanly. The chart might still roll over, but the macro backdrop now works against a decisive breakdown. Short positions here demand caution.
Original post
Nvidia’s bear case rests on one core idea: the stock price assumes a flawless, world-eating AI future, and markets almost never deliver on “perfection narratives.” NVDA trades at extreme valuation multiples for a hardware-driven, highly cyclical business. Those multiples only hold if AI infrastructure spending keeps compounding at its current breathtaking pace for years. But that demand is dangerously concentrated in a handful of hyperscalers who are spending now and rationalizing later. Michael Burry’s recent argument sharpens this point: he claims true end-demand for AI horsepower is vastly overstated, and that much of the current GPU frenzy is a self-reinforcing loop of capital, hype, and accounting gimmicks rather than broad, organic need. If boards pause to question real ROI, or if the circular funding loop breaks Nvidia’s revenue curve can flatten quickly, dragging the valuation down with it.
Competition, long dismissed by NVIDIA bulls, is another structural headwind. AMD is now shipping accelerators that hyperscalers are actually integrating, and every major cloud provider is building in-house silicon to reduce dependence on NVDA’s margins. Even if Nvidia maintains leadership, it doesn’t need to lose the crown to lose the multiple, slight shifts in workload allocation or a handful of missed design wins are enough to pressure margins. And Burry’s critique deepens this point: he argues Nvidia’s reported profitability is flattered by depreciation assumptions and massive stock-based compensation that buybacks have failed to offset, meaning the “true” economic profit is less bulletproof than headlines suggest. Add to that the fact that U.S. export controls have effectively erased the China data-center market, once 20–25% of revenues and expectations of a seamless global TAM look increasingly unrealistic.
Technically, NVDA is doing exactly what a euphoric, overowned stock does when gravity starts tugging: momentum is fading, the price is slipping under short-term moving averages, and reactions to spectacular earnings have been strangely sluggish. That’s often the early signature of distribution rather than accumulation. And this lines up directly with Burry’s broader thesis: when a narrative becomes crowded and reflexive, the slightest wobble triggers violent air pockets. NVDA has become the ultimate proxy for the AI boom, the most crowded long in the market, meaning it’s the first thing funds sell when risk appetite cools, and the last thing buyers chase during corrections.
Put simply, Nvidia is a phenomenal company priced as if nothing can ever go wrong, while Burry is arguing that much of what looks “perfect” is not what it seems. The bear case isn’t that Nvidia collapses. It’s that the AI boom normalizes, competition accelerates, accounting realities catch up, margins slip toward something earthbound, and investors recalibrate how much they’re willing to pay. In that world, NVDA doesn’t need bad news to fall. It only needs the news to arrive slightly less euphoric than the fantasies currently baked into the price.
#NVDA #Bearish #HeadandShoulders #MichaelBurry
