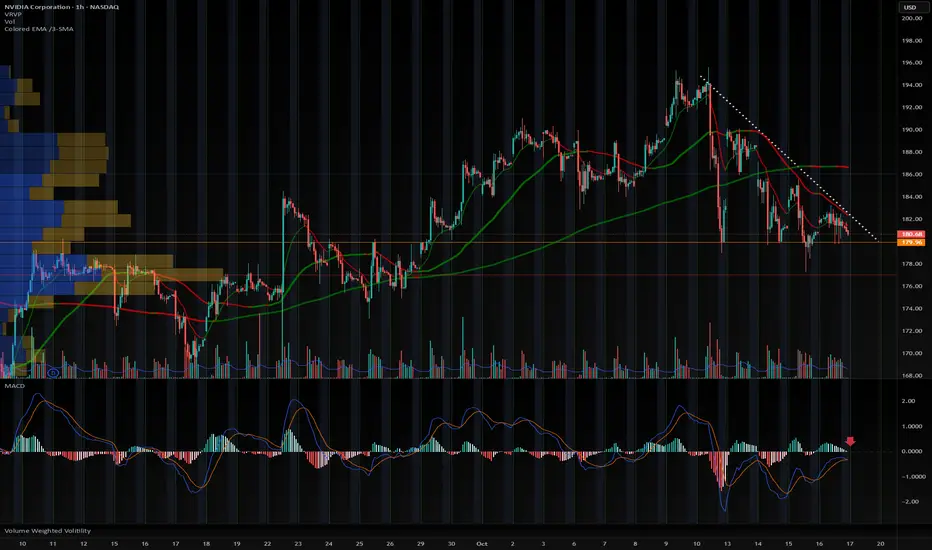
ITS so OVER....for nowAPPL used to lead the market but in the Ai bubble leading Tech and SPY,
NVDA has clearly taken over that role.
Follow it for the general direction of a choppy market condition.
The Descending triangle, if it breaks could signal disaster for the broader market.
It has had nothing but good news, so if Nvidia does not hold a bid here, it's because
of macro conditions.
$180 is a very strong S/R line, it is also very near the POC.
Trade ideas
NVDA Flag bouncingExpecting to go up, will touch upper trendline based on the pattern. If it breaks the upper trendline then it will break ATH.

NVDA: Pullback Before the Next AI Move🧠 Technical Overview
NVIDIA is currently testing the integrity of a larger ascending channel after breaking out of a smaller uptrend structure. The setup reflects a potential pullback to the Fair-Value Gap (FVG) zone around $171–$175, where confluence from multiple structural levels may support a continuation of the long-term uptrend.
Structural Context:
- NVDA broke below a smaller, local uptrend channel, indicating short-term weakness or a deeper retracement phase.
- The larger white trend channel remains intact, suggesting the broader bullish structure is still valid unless price decisively breaks below $168.
- The FVG and trendline confluence around $171–$175 forms a critical decision zone — potential accumulation area before continuation.
Indicators & Momentum:
- MACD: Bearish crossover active but showing signs of flattening → potential slowdown in downward momentum.
- RSI: Near 45, approaching oversold territory, aligning with potential bounce region.
- Volume: Moderate with slight increase during recent sell pressure — suggests controlled pullback rather than full reversal.
Scenario Expectation:
Base case favors a retest of $171–$175 before continuation upward.
If NVDA fails to hold above $168, expect a shift in structure — likely continuation of the larger channel downtrend toward $164–$160 before stabilization.
🌍 Macro & Catalyst Overview
1. AI Demand & Infrastructure Growth
NVIDIA continues to dominate AI chip supply, benefiting directly from global GPU infrastructure expansion. Microsoft’s and Nscale’s recent deployment of 200,000 Nvidia GB300 GPUs reinforces NVDA’s market moat and ensures extended demand through 2029.
→ Bullish Long-Term Catalyst
2. Market wide Valuation Concerns
Despite strong fundamentals, AI sector valuations remain stretched. This creates short-term corrective risk — investors rotating between overextended AI names and value sectors.
→ Neutral / Slightly Bearish Short-Term Catalyst
3. Macro Environment (Q4 2025)
Stable U.S. inflation and Fed holding rates steady maintain a neutral-to-positive tech environment.
Bond yields leveling off supports risk-on sentiment for semiconductors.
4. Global Supply Chain Notes
GPU production remains tight but improving. NVDA’s ongoing partnerships across Europe and Asia mitigate supply bottlenecks, enhancing delivery reliability and forward guidance confidence.
Macro Takeaway:
While NVDA may experience near-term pullbacks amid valuation cooling and technical corrections, its AI infrastructure dominance and GPU supply deals provide a solid long-term bullish foundation. Any retracement into the $171–$175 range could be viewed as a high-probability re-entry opportunity for continuation traders.
📊 Trading Plan Example
Bullish Scenario: Long entries near $171–$175 zone with confirmation of support. Targets: $183 → $192 → $220
Bearish Scenario: Break below $168 confirms structural weakness. Downside target: $164 → $160.
Invalidation: 4H close above $183 with strong volume invalidates short-term bear thesis.
Nvidia - The next rally of +33% started!🚀Nvidia ( NASDAQ:NVDA ) just broke out:
🔎Analysis summary:
Over the past couple of months, Nvidia has been rallying an expected +100%. However, just objectively looking at the chart, this rally is not over yet. After the confirmed all time high breakout, Nvidia can rally another +33% until it will retest a substantial resistance level.
📝Levels to watch:
$250
SwingTraderPhil
SwingTrading.Simplified. | Investing.Simplified. | #LONGTERMVISION

Nvidia short ideaNVDA is forming an expanding pattern and looks ready to break lower. A short could be considered once price confirms a break, with a target around 163 and a stop just above 184. Keep an eye on the breakout for proper confirmation.
⚠️ Not financial advice.
Bullish Pullback Attack – NVIDIA Heist Plan for Escape Loot!🚨💻 NVIDIA (NVDA) Stock Heist Plan 🎭 | Swing & Day Trade Robbery 💰⚡
🌟 Hey Money Makers & Market Robbers! 🌟
Welcome back to the Thief Trading Den where we don’t trade… we steal from the market vaults! 🏦💸
🔥 Asset: NVIDIA (NVDA)
🎭 Heist Type: Swing / Day Trade
🔑 Plan: Bullish Pullback Robbery
🗝️ Entry (Breaking into the Vault)
First lockpick entry above 167.00+ 🔓
Retest & pullback = perfect robbery spot
Thief layering strategy: stack multiple buy limit orders (layered entry like robbers tunneling from multiple sides 🛠️).
Any price level? Yes, thieves adapt—grab loot wherever the window cracks open! 🏃♂️💨
🛑 Stop Loss (Escape Route 🚪)
Official Thief SL: @ 161.00 ⚠️
But dear Thief OG’s, adjust based on your risk appetite, loot bag size & startergy 🎭
Remember, no thief survives without an escape route! 🚁
🎯 Target (The Electric Fence Escape ⚡)
The High Voltage Electric Shock Fence is guarding the treasure @ 196.00 ⚡⚡
Snatch your profits before the fence fries the loot 🔥
Escape fast, spend faster, rob smarter 💸🍾
⚠️ Thief Alert 🚨
The market guards (short sellers) are patrolling heavy—don’t get caught in their traps 🕵️♂️
Use layered limit orders, scale out profits, and keep your SL tight!
A true thief never overstays at the crime scene 👀
💥 Boost this Robbery Plan 💥
Every like & comment powers the Thief Trading Family 🏆
Stay sharp, stay sneaky & let’s rob NVIDIA together! 🤑🎭

$SPXAs the U.S.–China trade war escalates, new investors might inject liquidity into U.S. markets to maintain strong ties with the U.S. economy.
SP:SPX could keep pushing higher not from peace, but from strategic capital alignment.
NVDA Oct. 15 2025NVDA trade idea based on current conditions. Its my first video and I'm learning to talk while recording. :P

Stock Gains from Covid Lows + Market Thoughts 10/15/25I will look over about 30 stocks ranging from Mag 7 to Covid High flyers to recent highflyers.
As well as my thoughts and prospects for the markets from here.

NVDA - cause for concern at $180?NVDA on the daily broken under my support trend line. If we close under the trend line today, it may spell short term bad news for the stock.
Disclaimer: I am long NVDA. Not financial advice.

Time to short Nvidia - Key levels Longs and shorts In this video I have created a simple idea that gives you a easy invalidation for a short as well as
pinpointing some key regions as to where we can set alerts and patiently wait for strong reaction zones for the long side provided we get the structure shift that I am looking for .
Tools used TPO chart, Fibs, Channels ,

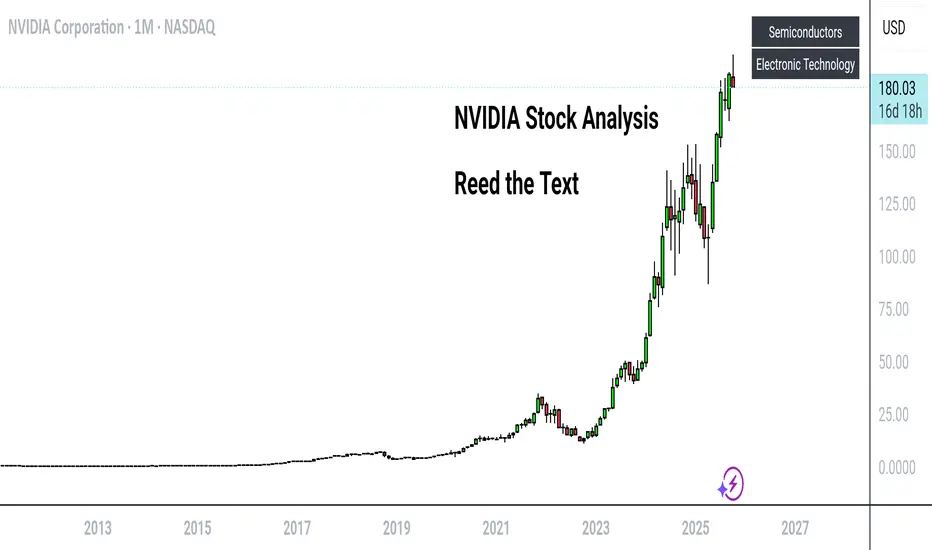
NVIDIA Stock Analysis NVIDIA stock (NVDA) is currently trading at $180.03, with a daily loss of -4.33%. The price fluctuates between $179.87 and $185.83, with a trading volume of 205.6 million shares.
Technical Analysis
The price is currently in a consolidation phase between $179 and $186. A breakout above $186 could open up further upside potential to $195. A drop below $179 would make a correction to $172 likely.
Current News
Month of October 2025
Investment in xAI: NVIDIA is considering an investment of up to $2 billion in Elon Musk's AI startup xAI, boosting confidence in AI development.
Sustained Demand: CEO Jensen Huang reports massive demand for NVIDIA's Blackwell chips, solidifying its market position.
Trade conflicts: Fears of an escalating trade conflict between the US and China led to a 2.1% decline in the share price to $184.41.
The current consolidation offers a potential entry opportunity. A breakout above $186 could enable a short-term price increase to $195. A stop loss below $179 would limit the risk.
Note: The information presented is for informational purposes only and does not constitute investment advice. Investing in stocks involves risks.
[NVDA] First entry short - Small sizeHere I don't want to risk too much because it's still very frontside but I start to build a short position on this stock.
Great Trade !
I Future on Sale — Buying Nvidia Amid Trade War FearsI just bought NVDA Jan 2026 185 Call @ $16
I trust top macro analysts calling for strong Q4 ’25 and Q1 ’26.
Chips will likely get tariff exceptions.

NVDA - Zoom outTopped?
Not financial advice
This market is confusing and out of sync as INTC is looking to shoot off

NVDA – Bearish Divergence at the Peak: Is a Healthy Correction CPrice is testing the upper boundary of its long-term ascending channel near 190 USD, showing clear bearish divergence between price vs RSI and MACD histogram, signaling weakening momentum. A corrective A–B–C wave toward the 125-135 $ zone is likely, aligning with EMA and Ichimoku supports. This would form a healthy reaccumulation phase before the next potential bullish leg.

$NVDA final leg higher? Over $200?The move down on Friday looks like it marked a low to me and that we could see our final move higher from here.
It's been my idea that we see a blowoff top over the next couple of weeks, so I think these levels in the box will mark the top.
I think it's most likely that we get somewhere between the $222 level and $232 level, but I've marked off other levels just incase.
I've taken some calls, let's see how the move plays out from here.
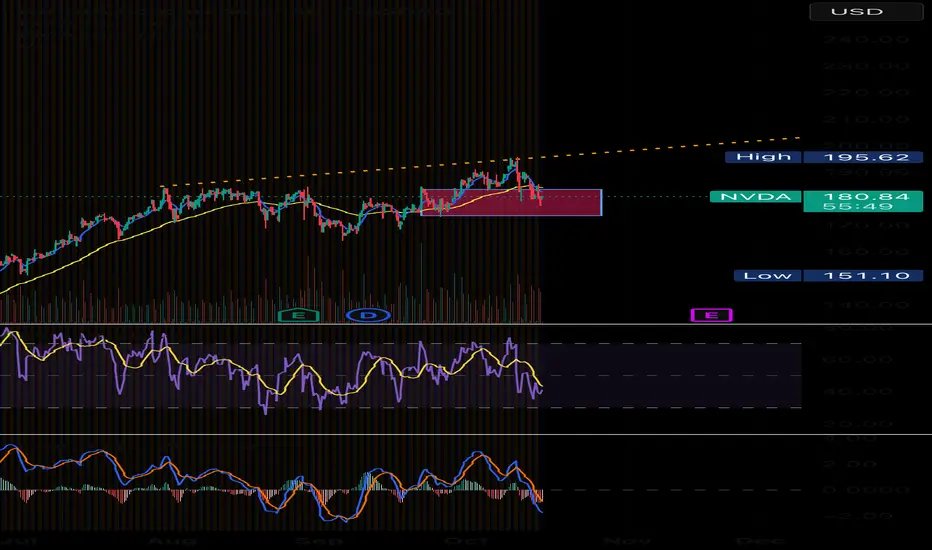
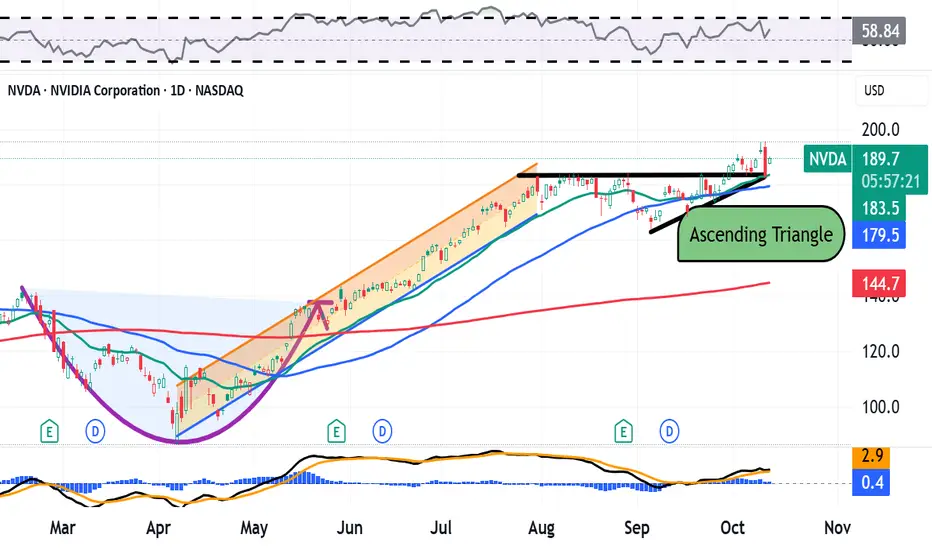
Nvidia Is Trading Near All-Time Highs. What Does Its Chart Say?Nvidia NASDAQ:NVDA hit an all-time intraday high this past week after rebounding some 120% from its April lows. What does the AI-friendly chip giant's chart and fundamental analysis say could happen next?
Let's check things out:
Nvidia's Fundamental Analysis
We're still more than a month away from hearing from Nvidia about its Q3 quarterly results, which will likely come in late November.
But as of right now, the Street is looking for the high-end GPU designer to report $1.24 in adjusted earnings per share for the period on roughly $54.7 billion of revenue.
That would represent a 53.1% gain from the year-ago period's $0.81 in adjusted EPS, as well almost 56% growth from the $35.1 billion in revenues seen 12 months earlier.
That kind of sales growth would be more than impressive for almost any other firm, but would actually represent a deceleration from the growth pace NVDA has experienced over the past two years or so.
The advent of big capex up-spend on artificial-intelligence-focused infrastructure meant Nvidia boasted annual sales growth well into three-figure percentages during much of 2023 and into 2024.
But the "law of large numbers" eventually kicks in for everyone, even Nvidia -- and that's really not a bad thing at all. After all, NVDA's stock currently trades at about 30 times forward-looking earnings and 53 times trailing earnings.
Expensive? Maybe, but a growth rate at this kind of scale is hard to put a price on. Less than 1% of Nvidia's entire float is held in short positions, so we know there aren't a lot of NVDA out there.
In fact, 33 of the 38 sell-side analysts that I know of who cover NVDA have revised their Q3 earnings estimates higher since the quarter began, while just two have lowered their forecasts. (Three have left their estimates unchanged.)
And in full disclosure, I'm personally long this name and have been for a very long time.
Nvidia's Technical Analysis
Now let's check out NVDA's chart going back some eight months and running through Wednesday afternoon:
Readers will see that Nvidia bottomed out at $86.62 intraday on April 7, forming a bullish "cup-with-handle" pattern in the process (marked with a curving purple in at the chart's left).
The stock then rallied from that early April low into late July, which I've illustrated with a Raff Regression model (the orange-shaded area above).
However, NVDA next hit stiff resistance from late July through late September, bumping its head up against the Raff Regression's ceiling many times before finally cracking through on Sept. 30.
This resistance formed the upper trendline of what's known as an "ascending-triangle" pattern of bullish continuance, marked with thick black lines at the chart's right.
The top black line now serves as Nvidia's pivot at the $184 level. We can see that since cracking this line in recent days, the stock has tested it from above and found support. (NVDA was trading at $189.85 Monday morning as I wrote this after hitting a $195.62 all-time intraday high on Friday.)
Meanwhile, Nvidia's secondary indicators are postured quite bullishly.
Its Relative Strength Index (the gray line marked "RSI" at the chart's top) is improving and flashing a better-than-neutral signal, but isn't yet technically overbought.
Similarly, all three components of Nvidia's daily Moving Average Convergence Divergence indications (or "MACD," marked with black and gold lines and blue bars at the chart's bottom) are in good shape.
The histogram of the 9-day EMA (blue field) is above the zero-bound, as are the 12-day Exponential Moving Average (or "EMA," denoted with a black line) and 26-day EMA (the gold line). The best part for the bulls is that the 12-day line is running above the 26-day line and both lines are still rising.
An Options Option
A bullish trader might get involved with Nvidia by initiating a "buy-write" strategy.
This involves purchasing a stock and simultaneously "writing" (i.e. selling) a covered call against that equity position to reduce the investor's net basis. Here's an example:
-- Buy 100 shares of NVDA at or close to $188.
-- Sell (write) one Nov. 21 $210 call for about $4.25. This call will likely expire after Nvidia's 3Q earnings come out.
Net basis: $183.75.
In the example above, selling the covered call will significantly lower the equity position's net basis.
Should the shares be called away in November, the trader would still realize a 14.3% profit. That's fine, but this trade is really about getting long NVDA while finding ways to reduce net basis.
The trader in the example above could theoretically keep writing covered calls against the stock for as long as the equity position exists, further and further reducing net basis.
(Moomoo Technologies Inc. Markets Commentator Stephen "Sarge" Guilfoyle was long NVDA at the time of writing this column.)
This article discusses technical analysis, other approaches, including fundamental analysis, may offer very different views. The examples provided are for illustrative purposes only and are not intended to be reflective of the results you can expect to achieve. Specific security charts used are for illustrative purposes only and are not a recommendation, offer to sell, or a solicitation of an offer to buy any security. Past investment performance does not indicate or guarantee future success. Returns will vary, and all investments carry risks, including loss of principal. This content is also not a research report and is not intended to serve as the basis for any investment decision. The information contained in this article does not purport to be a complete description of the securities, markets, or developments referred to in this material. Moomoo and its affiliates make no representation or warranty as to the article's adequacy, completeness, accuracy or timeliness for any particular purpose of the above content. Furthermore, there is no guarantee that any statements, estimates, price targets, opinions or forecasts provided herein will prove to be correct.
Options trading is risky and not appropriate for everyone. Read the Options Disclosure Document ( j.moomoo.com ) before trading. Options are complex and you may quickly lose the entire investment. Supporting docs for any claims will be furnished upon request.
Options trading subject to eligibility requirements. Strategies available will depend on options level approved.
Maximum potential loss and profit for options are calculated based on the single leg or an entire multi-leg trade remaining intact until expiration with no option contracts being exercised or assigned. These figures do not account for a portion of a multi-leg strategy being changed or removed or the trader assuming a short or long position in the underlying stock at or before expiration. Therefore, it is possible to lose more than the theoretical max loss of a strategy.
Moomoo is a financial information and trading app offered by Moomoo Technologies Inc. In the U.S., investment products and services on Moomoo are offered by Moomoo Financial Inc., Member FINRA/SIPC.
TradingView is an independent third party not affiliated with Moomoo Financial Inc., Moomoo Technologies Inc., or its affiliates. Moomoo Financial Inc. and its affiliates do not endorse, represent or warrant the completeness and accuracy of the data and information available on the TradingView platform and are not responsible for any services provided by the third-party platform.
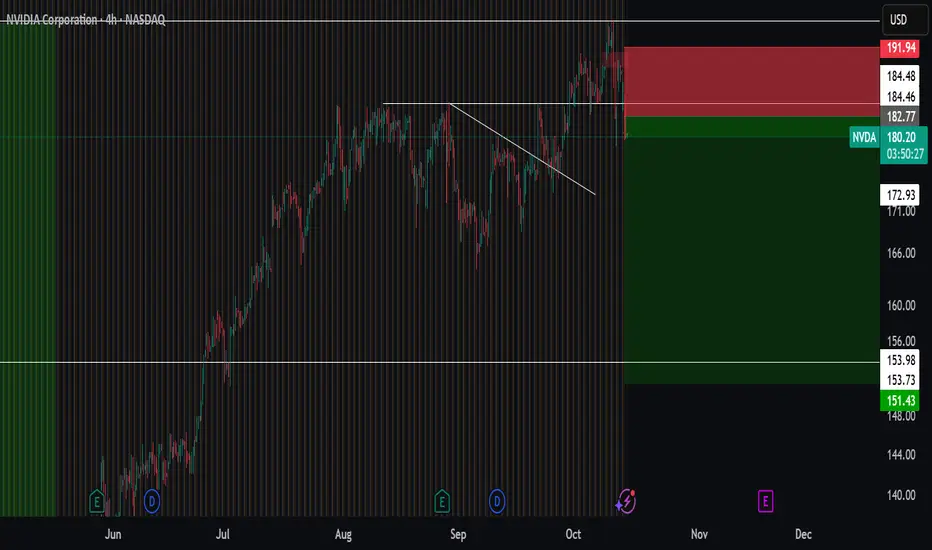
Nvidia to Recover: Just A Bump In the Road?Trump’s remarks about China close to Friday’s weekly close sent markets into a brief panic. Nvidia had just made a new all-time high, breaking through the previous top and resistance near 184, and was attempting another leg higher despite the US government shutdown. His comments triggered a 7 percent selloff, causing NVDA to retest the previous resistance zone from above.
The 182–184 area is now the primary support. After Trump slightly eased tensions, the stock is up 3 percent in premarket trading today. The road ahead may be bumpier than bulls would like, but the upside remains the base case for now. If both the 182–184 zone and the 177 support fail, that would be the point where the bullish outlook should be reconsidered for the short to medium term.

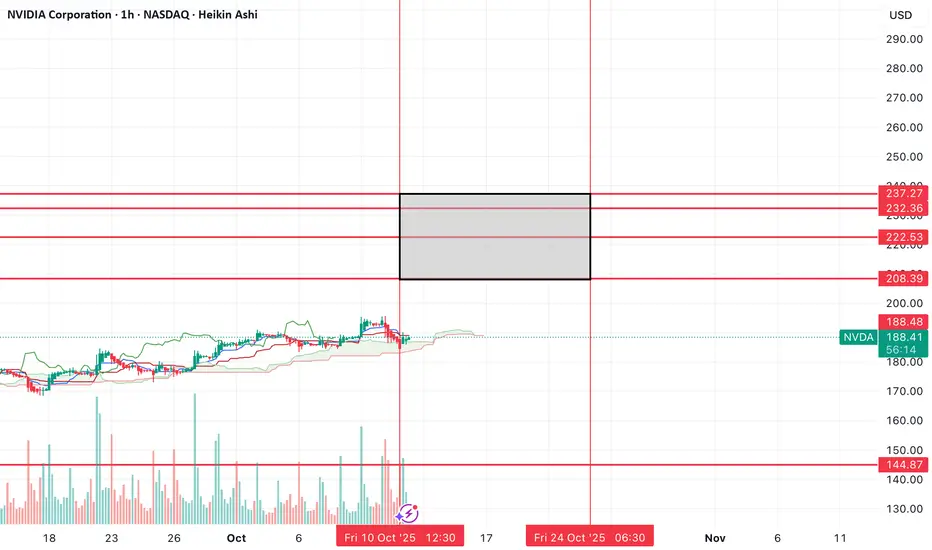
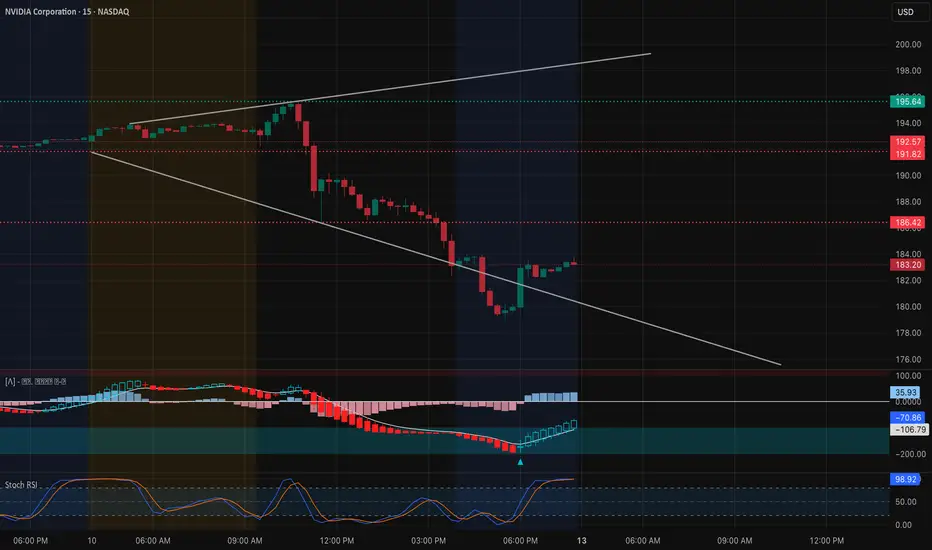
NVDA at the Edge: Can Bulls Hold the Line on Oct. 13?NVIDIA had one of the toughest weeks in months — the stock dropped nearly 5% on Friday as traders rushed to safety during the volatility spike. What we’re looking at now is not just a dip — it’s a real battle between smart money reloading for the next wave and panic sellers trying to exit before another flush.
Let’s break down both the 15-minute intraday structure and the 1-hour GEX setup to see what’s next.
NVDA 15-Minute — Intraday Structure
Friday’s session was brutal. NVDA fell sharply from around 192.5 and closed near 183, creating a steep descending channel that’s still active.
* Trendline & Structure:
The price is still trading below the descending trendline, but we’re starting to see the first signs of stabilization. The last few candles show a short-term bullish divergence forming on MACD, and Stoch RSI is recovering from oversold levels around 25.
That tells us the selling momentum is cooling — at least for now.
* Immediate Resistance Zone: 186.4 – 188.0.
This is the first area bears will defend. A clean breakout above 188 could trigger a quick move toward 192.5, where Friday’s breakdown began.
* Support Zone: 177 – 180.
This is the current intraday demand area. If we see another pullback here at the open, I expect buyers to step in — but if this level breaks, the door opens toward 172, the next strong support below.
* Intraday Plan:
I’d watch how NVDA behaves at 185 – 186 early in the morning. If it rejects this zone and VIX spikes again, short scalps back to 180 make sense.
But if SPY shows strength and VIX cools under 20, NVDA could run a relief move toward 190–192 for a day trade.
NVDA 1-Hour GEX Chart — Options Sentiment
Now this is where things get really interesting.
From the Options GEX and Options Oscillator, we’re seeing how the option market is currently positioned around NVDA:
* Highest Positive Net GEX / Call Resistance: ~188–192.5
That’s the wall where call sellers sit — heavy resistance for now.
* HVL & Short-Term Gamma Level: ~177.5
This level marks the highest volatility line (HVL). Below that, gamma flips negative, meaning dealers will start shorting to hedge, which amplifies downside moves.
* Put Support: ~170–172 zone, where negative GEX peaks (-61%).
That’s the line in the sand for deeper correction.
* IVR / IVX: 22.4 / 51.4 → Volatility is elevated but not extreme. There’s still room for expansion if fear continues.
What this tells me: NVDA is caught right between strong call resistance and heavy put support. Whichever side breaks first will dictate the next big move.
My Thoughts & Trade Ideas
From a technical perspective, NVDA is in a short-term bearish trend, but it’s also sitting at a potential bounce zone. The risk/reward for bulls improves here if volatility doesn’t expand further.
For Intraday Traders:
* I’d wait for confirmation at the open.
* A push above 186–188 could trigger quick long scalps to 191–192.5.
* Failure there? Short setups back to 180 with tight stops above 188.
For Options Traders:
* Calls near the 180 strike for quick rebounds are fine if VIX fades early — but keep expirations tight (1DTE or 2DTE).
* If volatility remains high and NVDA fails 180, puts around 177–175 may gain traction into midweek.
The Bigger Picture
Friday’s move wasn’t just about NVDA — it was all fear-driven. VIX broke 21, SPY collapsed, and traders de-risked across the board. If volatility holds above 20.6 into Monday, NVDA will likely stay under pressure.
But if the market calms, this could be the level where smart money quietly reloads for the next move up.
So going into Oct. 13, I’m cautious but watching for a reversal attempt. The moment NVDA breaks its 15-minute trendline and clears 188 with volume, the sentiment flips bullish short-term.
Key Takeaway:
NVDA is sitting right in the middle of a gamma battlefield. 180 is the must-hold level, 192 is the breakout gate. Volatility will decide the winner.
Disclaimer: This analysis is for educational purposes only and not financial advice. Always do your own research and manage risk carefully.
NVDA – Tariff Shock📰 Context: Tariff Shock Factor
Trump has recently announced that starting November 1, the U.S. will impose an additional 100% tariff on Chinese imports, along with stricter export controls on critical software. The escalation in trade tensions puts semiconductor names like NVDA directly in the crosshairs — greater risk of export restrictions, supply chain stress, and demand cutbacks in China.
So while the long-term AI narrative remains powerful, the short-to-medium term is more volatile than usual.
🧠 My Take
Entry Points (Long):
Entry A: $168 (near resistance break or pullback bounce)
Entry B: $153 (deeper pullback, still within bullish structure)
Entry C: $130 (if severe correction occurs)
Targets:
Target 1: +7% → ~ $180
Target 2: +15% → ~ $193
Target 3: +18% → ~ $198–200
📌 Disclaimer:
This is my personal trading idea, not financial advice. Use your own research, match your risk tolerance, and always manage your position size and stops.

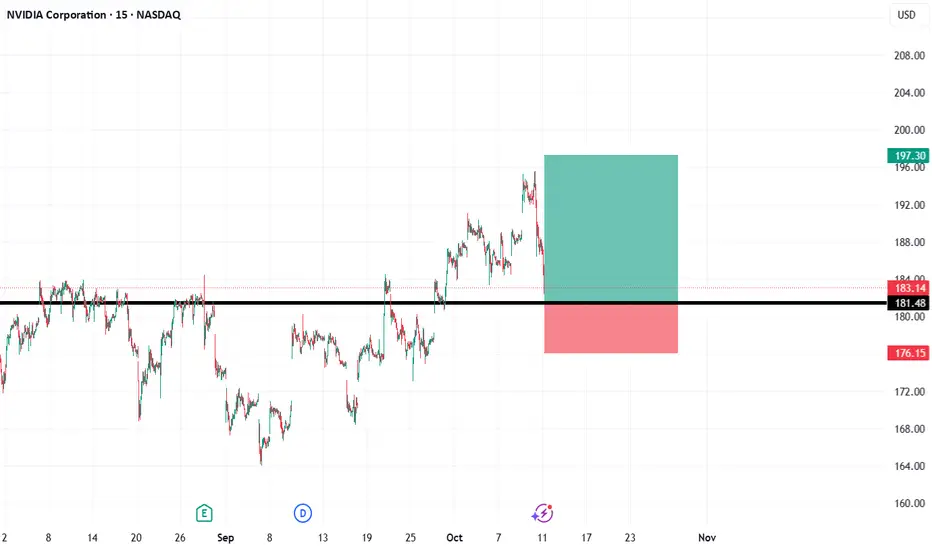
NVDA Long Setup: Retest of Former Resistance as SupportHello TradingView Community,
This post outlines a potential long trade setup for NVIDIA Corporation (NVDA) on the 15-minute chart.
Technical Analysis:
The chart highlights a key horizontal price level at approximately $181.48. This level previously acted as a significant resistance, capping the price on multiple occasions and creating a ceiling for the stock.
We have recently seen a strong breakout above this resistance, indicating a shift in momentum to the bullish side. The trading idea is based on a classic "resistance-turned-support" pattern. We are looking for the price to pull back to this broken level, hold it as new support, and then continue its upward trajectory. The current price action shows this retest may be in progress.
Trade Setup:
The long position tool on the chart visualizes the specific plan for this bullish scenario:
Entry: Approximately $181.48 (at the retest of the new support).
Stop Loss: $176.15 (placed below the support structure to invalidate the idea if the level fails).
Take Profit: $197.30 (targeting a new higher high).
This setup provides a structured plan with a favorable risk-to-reward ratio for a potential continuation of the bullish move.
Disclaimer: This analysis is for educational and discussion purposes only and should not be considered as financial advice. Trading stocks involves significant risk. Please conduct your own research and manage your risk appropriately before making any trading decisions.
NVDA Showdown:Will Bulls Charge to $204 or Bears Drag Us to $163If NVDA falls under $179, it might quickly drop to $176.70. If it keeps falling, the next stop could be $163. But if NVDA goes up and closes above $188, we could see it reach $199 or even $204.
Why do these levels matter? Because a big move could happen soon; either a big fall or a strong jump up. What would you do if NVDA hit these prices? Have you seen this happen before?
If you’re wondering what these moves could mean for you, or if you have questions, just send me a message. Sometimes one good question leads to your best trade ever. What would you ask if you could get a clear answer?
Mindbloome Exchange/ Trade What You See
