Virgin Galactic.We'll probably see them on the news.Virgin Galactic.
Disclaimer/
On average, 90% of all stocks move down with the market, and 75% move up.
The wave principle applies to some extent to individual stocks, but counting the waves for them is often confusing and does not have much practical significance. But since the company has a large capitalization, we assume that the state of the shares depends on the psychology of the masses.
Virgin Galactic is an American company that is part of the Virgin Group and plans to organize tourist suborbital space flights and launches of small artificial satellites. In the future, the company plans to offer its customers orbital flights. Virgin Group is an international conglomerate of companies founded by British businessman Richard Branson.
Virgin Galactic Holdings Inc
No trades
Trade ideas

testing the resistancecurrent price is testing the resistance. note the PSAR. will there be a rejection. i think so.

Dynamic Suppistance Curve analysis on SPCELast week SPCE moved up to a medium resistance level and has been trying to work its way through overhead resistance (both red curves). It seems to be holding and I am detecting a positive shift in momentum for this stock next week. I believe it will be squeeze whilst moving downward for another day or two and then break through overhead resistance with the next resistance level being all the way around the 45$ level.
looking for a drop to 34$ early next week with a bounce through resistance to at least 40$

SPCE BoundWith the weekend around the corner, the RSI peaking, and the Fibonacci convergence... I expect we’re going to see a slight pull back towards the support zone around the $30 mark (38.2% FR)
Going into next week, after finding our support zone, I expect we’ll be on the climb to find the next resistance zone at around the $45 mark. (61.8% FR)

SPCE to the moon? maybe after a little dip! ;)congrats if you bought the dip when i posted my idea here on tradingview under 20! we really made bank off this one <3 RSI hitting extreme overbought area. look for a dip entry around 30 round number support ! goodluck :) leave a like and follow if you found this helpful


Virgin Galactic Holdings (SPCE)The company has partnered with the Italian Air Force to fly three spaceflight participants and multiple payloads. This revenue-generating flight is expected to take place in late summer or early fall.

SPCE at resistanceIf SPCE breaks through this current resistance level at $38, then my next price target will be $45.
Golden cross is about to form on the daily chart (50 EMA crossing 200 EMA) which usually is a sign of an uptrend.

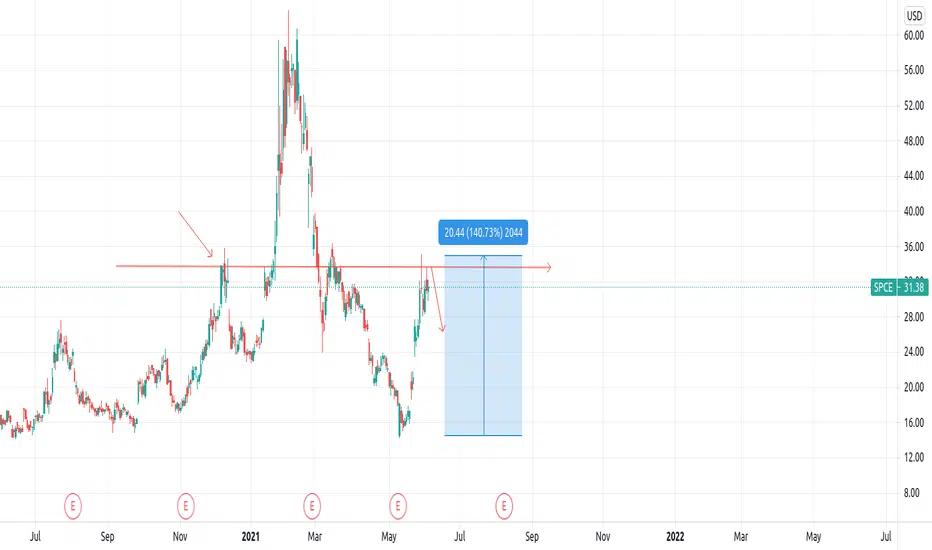
VIRGIN GALACTIC HOLDINGS (SPCE) IS IN STRONG BULLISH FORMATIONVirgin Galactic Holdings Inc (SPCE) is in strong bullish formation after completed the third spaceflight and the first-ever spaceflight from Spaceport America, New Mexico, launched on May 22, 2021. The share price rose by more than 140% in less than a month after it hit the strong support level of 14$ per share. The Unity vehicle (the carrier plane), with pilots Dave Mackay, powered to a height of 89km (55 miles) and then glided back down to Earth. The company has more than 600 paying customers – including movie and music stars waiting to take the same flight. But they will get their chance if US Federal Aviation Administration fully licenses the spaceship. The company had problems with interference issue, which aborted a previous flight in December. Following the worse than expected financial results in February, Sir Richard Branson (the founder) and four entities sold 5,584,000 shares of Virgin Galactic between April 12 and 14. The share price drop to 14$ per share – Covid-19 pandemic levels, which pandemic inflicted damage on the whole travel business. But during the last month, the stock's performance is more than reasonable, and the strength of the upward movement shows no sign of weakening.
After the rebound from the intense psychological level at 14$ per share, the price breakthrough 23.6 and 38.2 Fibo resistance levels, and yesterday closed at 50.0 Fibo level and very close to 35$ per share. If impulse upward movent will continue and breakthrough 50.0 Fibo level, it is possible to test 61.8 and looking for the high from February this year. In another way, the price may test back again 38.2 level and confirm it once again as a support level already.

6/5 SPCE(1) forgot when I did chart on SPCE, but all the downside along the pink tunnel is a buy to me, long-term

Is there a correlation between VIX and speculative stocks? It's no secret that VIX, aka "investor's fear gauge," is the volatility index that goes up when uncertainty increases in the market. It functions to predict and hedge against the upcoming volatility. So its negative correlation with major indexes is no surprise.
Now, how traders expect volatility? When traders see a major sell-off or a massive demand in call or put options. Meaning, the option sellers see higher demand, and options buyers see increased options premium, which is a signal of increased market risk and volatility. As the result, investors seek ways to "hedge" their positions through investing in the VIX index or buying an opposite position leading to a spike in VIX.
Does that mean when there is a spike on VIX, we should also expect a rise in speculative/growth stocks? Sometimes.
Let's take a look at this chart. On top of the panel we have a fairly volatile ticker (SPCE) and on the bottom, we can see the VIX chart (white line). As you can see, for every move, larger than 50%, on VIX, we have seen a relatively large price movement within a month or two after the spike. Is this a coincidence?
Please feel free to share your thoughts and add to my explanations for a better collective learning experience.
Thanks

SOCE to 32?Hit to a Tee
Haven’t gotten much follow up but the clear cup and handle formation worked just as planned

SPCE - LONG SPCE to the moon?
IF, SPCE respects this set up we will see plenty of long opportunities to follow. Looking for confirmation at break of 32.05 and wave continuation to 34.47, trimming positions at that level as we could see a corrective wave but it could also bust through resistance if momentum and price action is strong. If 34.47 is broken you can expect massive moves, especially with the fundamentals/hype behind this stock with long term targets set at 1.5(57.36)and 1.68(59.54) fib extension of 1st long-term impulse wave. 50/200d moving averages had a strong crossover. I also noticed price bounced off of Volume Point of Control indicating institutional accumulation at the current level.
Objections: Daily RSI is reading over-sold levels as well as tapering of the MACD histogram, these won't mean shit if a major resistance like 34.47 is broken. I would give about 60% conviction on this trade currently, 70% if we can break 32.05, 80% conviction if we break 34.47.

Virgin Galactic (SPCE) - A Textbook BubbleA hindsight educational comparison of SPCE to the widely used and referenced "Textbook Bubble" transportgeography.org

$SPCE $45>$23>$80>$60>$120The pitchfork on primary 1-2 and intermediate 1-2 line up exactly with this count, worth keeping an eye on.

VIRGIN GALACTIC is overdue for a BounceJust from a T.A. perspective.
Virgin Galactic looks due for a bounce:
-Resistance is now Support
-VPVR shows that these levels are for accumulating

SPCE 🚀 News - Breakout trade !!Hello Trader,
good mood and profitable trades !
SPCE Virgin Galactic Holdings, Inc
1D chart
Long
Falling Wedge breakout - bullback trade
Fib channels
MACD - bullish cross
Trigger - Waiting for bullback- or bullish confirmation on LTF 🎌
SL - if price falls back in falling wedge or under 0,618 retracement⛔
TP - falling wedge target,0.382 and 0.5 retracement 💰
FUNDAMENTAL : Virgin Galactic succeeds in manned space flight 🚀
www.nasdaq.com
I would like to mention that all I post are just options and my own opinion !
If you like my posts smash the like👍 button, comment or follow me.
Thanks for reading my ideas,
Trade save!!

SPCE - Red pill or Blue pill Neo? 🔴🔵-Needs to keep the nose above the $26 to keep up with the bullish continuation!
-Looks very volatile.
-If fails to keep the nose up, potential drop to $11 may come.


SPCE is the Best Short Opportunity in Some TimeFull shooting start completely outside of the 2STDV Bollinger Band range after parabolic run up primarily based on hype and closed right below the 100DMA break point. No real support until at least around 25.

SPCE Virgin Galactic Gaps up again **Update to 5.11.2021**Just an update to the 5.11.2021 call I posted.
by iCantw84it
05.24.2021

SPCE long right on up to?getting familar with tradingview drawing so nothing to see here...
test launch happened ok
recently endorsed by a brokerage
coming up to options expiration this friday
covid is on the wane, book your vacation flight tickets
