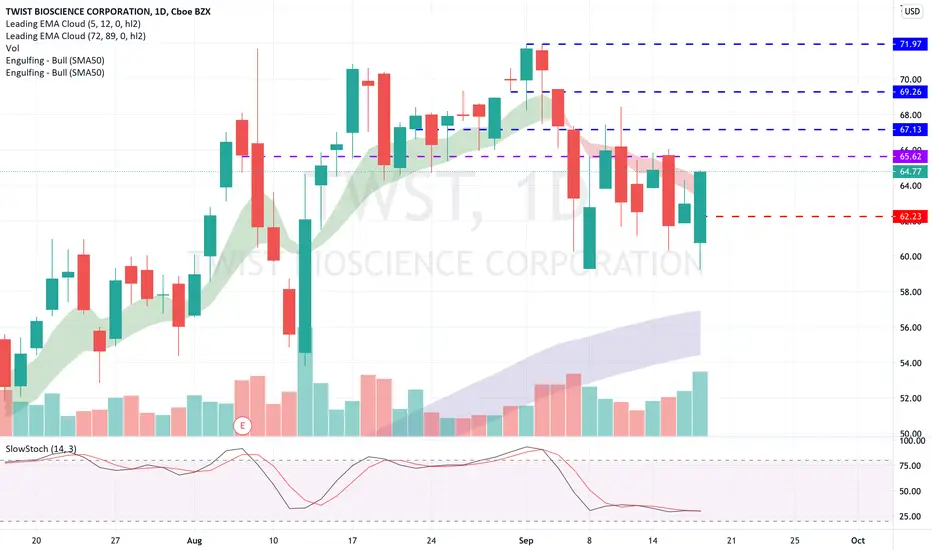
TWST - Uptrend looks like it'll continueAbove MA's, respecting trend, still a bullish chart.
Twist has essentially invented a new way to “print” DNA onto a microchip so it can be tweaked, analyzed, and researched. This groundbreaking technology makes it possible to reconfigure DNA into something entirely new.
DNA is, of course, the code of life. It’s what makes us who we are. By rearranging DNA, weccan create new organisms with more characteristics that we like, while removing the ones we dislike.
Twist’s DNA synthesis platform is already being used to develop COVID treatments, as well as the anti-malaria drug artemisinin. In short, Twist is helping to lay the foundation for a biotech revolution… much like Intel did with the American computer revolution.
But Twist is much, much more than a biotechnology play. Its technology is also being used to develop new chemicals for industrial processes, new food flavors, novel materials like spider silk, and even plants that are self-fertilizing and drought tolerant.
Its silicon-based chip technology can increase DNA production by 9,600X over traditional DNA synthesis methods. This is possible thanks to one of Twist’s core proprietary
technologies that can manufacture synthetic DNA by “writing” it on a silicon chip.
1TWST trade ideas

TWST, RSI Indicator left the overbought zone on January 21, 2021This is a signal that TWST's price could be shifting from an uptrend to a downtrend. Traders may consider selling the stock or exploring put options. Tickeron's A.I.dvisor looked back and found 24 similar cases where TWST's RSI Indicator left the overbought zone, and in 20 of them led to a successful outcome. Odds of Success: 83%. Current price $191.80 is above $104.05 the highest support line found by Tickeron A.I. Throughout the month of 12/17/20 - 01/21/21, the price experienced a +35% Uptrend. During the week of 01/13/21 - 01/21/21, the stock enjoyed a +16% Uptrend growth.
Bearish Trend Analysis
The 10-day RSI Indicator for TWST moved out of overbought territory on January 21, 2021. This could be a bearish sign for the stock. Traders may want to consider selling the stock or buying put options. Tickeron's A.I.dvisor looked at 24 similar instances where the indicator moved out of overbought territory. In 20 of the 24 cases, the stock moved lower in the following days. This puts the odds of a move lower at 83%.
The Stochastic Indicator demonstrated that the ticker has stayed in the overbought zone for 7 days. The longer the ticker stays in the overbought zone, the sooner a price pull-back is expected.
Following a 3-day decline, the stock is projected to fall further. Considering past instances where TWST declined for three days, the price rose further in 50 of 62 cases within the following month. The odds of a continued downward trend are 78%.


$TWST - over $142 I like it Buy level is above the volume shelf.
Its in the list of genome stocks in my genome watch list.
Being careful with this one since I just recently added it to my list.

End of Wave 5? On watch.Could have reached the end of impulse Wave 5 and setting for an ABC correction pattern.

TWST, Aroon Indicator entered an Uptrend on December 16, 2020.Over the last three days, Tickeron's A.I.dvisor has detected that TWST's AroonUp green line (see chart) is above 70, while the AroonDown red line is below 30. When the green line goes above 70 while the red line stays below 30, this is an indicator that the stock could be poised for a strong Uptrend. For traders, this could mean going long the stock or exploring call options in the next month. Tickeron's A.I.dvisor backtested this indicator and found 123 similar cases, 110 of which were successful. Based on this data, the odds of success are 89%. Current price $144.15 is above $70.56 the highest support line found by Tickeron A.I. Throughout the month of 11/13/20 - 12/16/20, the price experienced a +32% Uptrend. During the week of 12/09/20 - 12/16/20, the stock enjoyed a +0.56% Uptrend growth.
Bullish Trend Analysis
The Momentum Indicator moved above the 0 level on November 27, 2020. You may want to consider a long position or call options on TWST as a result. Tickeron A.I. detected that in 33 of 37 past instances where the momentum indicator moved above 0, the stock continued to climb. The odds of a continued upward trend are 89%.
Following a +10.45% 3-day Advance, the price is estimated to grow further. Considering data from situations where TWST advanced for three days, in 138 of 148 cases, the price rose further within the following month. The odds of a continued upward trend are 90%.
The Aroon Indicator entered an Uptrend today. Tickeron A.I. detected that in 110 of 123 cases where TWST Aroon's Indicator entered an Uptrend, the price rose further within the following month. The odds of a continued Uptrend are 89%.

TWST, Aroon Indicator entered an Uptrend on Oct 27, 2020.Over the last three days, Tickeron A.I.dvisor has detected that TWST's AroonUp green line (see chart) is above 70, while the AroonDown red line is below 30. When the green line goes above 70 while the red line stays below 30, this is an indicator that the stock could be poised for a strong Uptrend. For traders, this could mean going long the stock or exploring call options in the next month. Tickeron A.I.dvisor backtested this indicator and found 114 similar cases, 101 of which were successful. Based on this data, the odds of success are 89%. Current price $80.72 is above $70.56 the highest support line found by Tickeron A.I. Throughout the month of 09/25/20 - 10/27/20, the price experienced a +15% Uptrend, while the week of 10/20/20 - 10/27/20 shows a -6% Downtrend.
Bullish Trend Analysis
The Stochastic Indicator shows that the ticker has stayed in the oversold zone for 4 days. The price of this ticker is presumed to bounce back soon, since the longer the ticker stays in the oversold zone, the more promptly an upward trend is expected.
Following a +3.54% 3-day Advance, the price is estimated to grow further. Considering data from situations where TWST advanced for three days, in 126 of 136 cases, the price rose further within the following month. The odds of a continued upward trend are 90%.
The Aroon Indicator entered an Uptrend today. Tickeron A.I. detected that in 101 of 114 cases where TWST Aroon's Indicator entered an Uptrend, the price rose further within the following month. The odds of a continued Uptrend are 89%.

Bullish engulfing, possible recoveryNot long yet but a potential recovery in the works. Interesting company and biotechs have been in favor recently. On watch for a break over the marked fib.
There's always a bull market somewhere... - Twist Bioscience Corporation is ranked one of the most relatively strong stocks out there now.
- The opportunity for long/short equity in these times is just astounding to me.
- I don't think I've ever seen so many stocks trading as if they're in parallel universes.

TWIST BIOSCIENCE CORPORATION
Hey, traders.
Catch the long for today.
Let's take a close look at the chart.
1. On 08.04.2020, after a strong decline, the long player came into force. Having gained a position, he pushed the price upwards.
2. Once again, we see the price going from level to level in a channel, however, after the rise there is no rebound. For 12 days, a new position was gaining momentum and it was also clear that we would go up.
3. 06.05.2020 again the long player pushes the price up, having spent 154 thousand shares or almost 6 million. Remember, I once in one of the posts, I asked if you were ready to lose a million? No one answered me then.
You can see that there's a smart guy works here who leads the instrument up. He'll spend $6 million that day, but then he'll make 100. That's genius.
4. As for me. I'm gonna go to the long. There's an understandable calculable risk and good movement potential.
Trade wisely!

TWST buy through earnings pivot NASDAQ:TWST
This name is giving great price action off that high of the earnings reaction while previous resistance looks like it might become support if it wants to create a trading range for some time; however, price action is indicating a possible move up sooner than later with a buy thru 40.50 against 38. It had a 42% change in revenue last quarter and a 3 year sales growth rate of 129% which can be the catalyst to make it move.

twstshort position for day trading and opportunity in long position for swing traders after the correction

Coinciding variables show good opportunity on Twist bioscienceFibonnacci channel plotted on 3 day chart show the bottom of channel being hit and holding for now. Major pivots up in the past have shown great profits of 50-100% or 12$+. Bullish divergence on RSI and MACD on multiple time frames as well as Reset ocillators on multiple time frames. Twist is still in a bullish trend long term since IPO. Possible bearish cypher also may be forming. Great opportunity for longs. Profit taking levels at fibonacci retracements or fibonnaci channel levels. Ultimate target between $30 - $36. Good company with a good future in DNA synthesis so holding long term is also a good idea.

TWST Is Going to $350 in less than 6 months.NASDAQ:TWST is probably the most BULLISH looking stock technically.
In my 7 years of trading, I HAVE NEVER SEEN A STOCK LOOK SO FUCKING BULLISH !!!!!!!
The company supplies Microsft with DNA to store Data. Cells are the best and most efficient way to store information. TWST Has very strong and good patents. this can easily be a $100B cap company in less than 5 years.
Thank you for reading.
Best,
Antonio

Oversold conditions?Sorry to say I made my new entry way to early on TWST. Sometimes you do mistakes, but I'm still in this trade because I think we will have a strong bounce. I think that the news in yesterdays post market really changed the direction of that symetrical triangle that was forming. To me, these conditions looks like they are really oversold (also clear if you look at the daily timeframe). Have a look at the highligthed bear volume that's decreasing today. No significant bull volume yet before close but if overall market conditions get better soon I think we might bounce with some significant bull volume. What do you guys think? Thoughts are appreciated!

Weekly pattern trend channelLooking at the weekly pattern and the trend channel gives an indications of where this stock could be moving, and where we are now on yesterdays oversold lows.
TWST Short Swing on Lockup Expiration TWST has doubled since IPO
($14). What seems to be some serious litigation risks. Was thinking insiders shares could hit the market as soon as lockup lifted. Also double top and trend snap. Couldn’t share this one before the trade because borrows were tight and I have to pay myself first. Thinking this can move significantly lowers low $20s likely in my opinion.

TWST OptimismMight breakout soon. With the potential of this company, I think it will be to the upside. Certain risk that a bad earnings report the 7th of Feb could push TWST down again.
