Wday 169 gap close Looking bullish here up against resistance ..
Entry - over 157.50
Stop loss - 155
Target - 169 gap close
Trade ideas

WDAY Workday Options Ahead Of EarningsLooking at the WDAY Workday options chain, i would buy the $150 strike price Puts with
2022-9-16 expiration date for about
$5.40 premium.
Looking forward to read your opinion about it.


Workday new higher low?Is Workday making a new major higher low? Let us see what happens in the next few months as the fundamentals still look good for now.

WDAY base breakoutTook 155C for next week as per plan posted yesterday. Up 30% so far. Looks good i to next week.

WDAY nearing base breakoutWDAY is building a nice base here with accumulation volume. Most of the up days are seeing higher volume than down days.
AUG 5 155C can work above 153.50

$WDAY (Workday) - Stock AnalysisThis is my long-term outlook for Workday's stock.
My ideas are driven by Institutional points of interest, Elliott wave theory, Wyckoff schematics, and anything technical related.

$WDAY with a Bullish outlook following its earnings #Stocks The PEAD projected a Bullish outlook for $WDAY after a Negative over reaction following its earnings release placing the stock in drift C with an expected accuracy of 75%.

WorkDay (NASDAQ: $WDAY) Could See A Huge Reversal! ◀️Workday, Inc. provides enterprise cloud applications in the United States and internationally. The company's applications help its customers to plan, execute, analyze, and extend to other applications and environments, and to manage their business and operations. It offers a suite of financial management applications, which enable chief financial officers to maintain accounting information in the general ledger; manage financial processes; identify real-time financial, operational, and management insights; enhance financial consolidation; reduce time-to-close; promote internal control and auditability; and achieve consistency across finance operations. The company also provides cloud spend management solutions that helps organizations to streamline supplier selection and contracts, manage indirect spend, and build and execute sourcing events, such as requests for proposals; Human Capital Management (HCM) solution, a suite of human capital management applications that allows organizations to manage the entire employee lifecycle from recruitment to retirement, and enables HR teams to hire, onboard, pay, develop, reskill, and provide employee experiences; Workday applications for planning; and applications for analytics and reporting, including augmented analytics to surface insights to the line of business in simple-to-understand stories, machine learning to drive efficiency and automation, and benchmarks to compare performance against other companies. It serves professional and business services, financial services, healthcare, education, government, technology, media, retail, and hospitality industries. The company was formerly known as North Tahoe Power Tools, Inc. and changed its name to Workday, Inc. in July 2005. Workday, Inc. was incorporated in 2005 and is headquartered in Pleasanton, California.

WDAY $WDAY Initial LongWDAY $WDAY Initial Long. Large bull harmonic. TP and SL on chart. Move SL on TP. At TP2, trail with 0.5ATR step and 1.5ATR offset.

Put sale on WDAYNot the first one. This also happens to be below the 100 SMA on a monthly. I'm not afraid of owning 1,000 shares of WDAY down here. I will have to go and see how many put sales expired in the past to "calculate my DCA If I got put shares, but I dig it. I will be okay to buy to close this one for 50% prem capture before July..."

WorkDay USA Sun Storm Investment Trading Desk & NexGen Wealth Management Service Present's: SSITD & NexGen Portfolio of the Week Series
Focus: Worldwide
By Sun Storm Investment Research & NexGen Wealth Management Service
A Profit & Solutions Strategy & Research
Trading | Investment | Stocks | ETF | Mutual Funds | Crypto | Bonds | Options | Dividend | Futures |
USA | Canada | UK | Germany | France | Italy | Rest of Europe | Mexico | India
Disclaimer: Sun Storm Investment and NexGen are not registered financial advisors, so please do your own research before trading & investing anything. This is information is for only research purposes not for actual trading & investing decision.
#debadipb #profitsolutions

Head and Shoulders /Triple TopPrice appears to have broken the neckline of a H&S pattern, consolidated, then formed a triple top at the prior neckline which is now resistance. Price could not break above the resistance of the prior H&S neckline.
This chart is similar to CRM in some ways. Like CRM, there is also a possible Cypher or Shark forming on weekly which would take price quite a bit lower if so. Both landing pads are marked down with a blue X.
Short interest is around 3.9%.
These are Heiken-Ashi candles. I look at them when I need to eliminate market noise that typical candles can create. Since noise is filtered, you can see the naked trend.
The Heikin-Ashi Open is the average of the prior Heikin-Ashi candlestick open plus the close of the prior Heikin-Ashi candlestick. Green candles with no lower shadow signal a strong UPTREND. Red candles with no upper shadow signal a strong DOWNTREND. These candles can show trend direction as well as trend strength.
These candlesticks do not show a shadow in the unless it is in the direction of the trend. When there is no shadow/wick (shaven), price is in a strong trend.
So a strong trend consists of shaved bottoms that are green for an uptrend and shaved heads that are red in a downtrend.
I will revisit this as targets could get lower dependent on market conditions. Today it is raining bullets )o:
Earnings May 30th.
No recommendation.
Weekly Chart
www.tradingview.com

14/3/2022 NSDQ WDAYDesicion to Short. Entry Price = $224.50. Target Price=$216.50. Stop Price=$232.50


$WDAY with a Bullish outlook following its earnings #Stocks
The PEAD projected a Bullish outlook for $WDAY after a Positive over reaction following its earnings release placing the stock in drift B with an expected accuracy of 100%.
WDAYConfirmed a falling wedge reversal pattern and a bull flag continuation pattern. Expected a move to the upside.

WORKDAY Testing SupportWDAY is a new one on my radar and I'm glad I found this one. After further review of this company, a lot of things attract me about this stock while being in the current state of the market. WDAY has the highest P/E that I have ever come across (17,418) while trading. This company hasn't generated a positive net income in 5 years and is currently sitting on support. Frankly, I'm pessimistic about the outlook of this company. As money starts moving away from equities, the companies with the highest P/E's are typically hit the hardest. If WDAY breaks below the trendline, WDAY will most likely head to the 2.618 Fib retracement at $220.
Not financial advice

WorkDay USA Sun Storm Investment Trading Desk & NexGen Wealth Management Service Present's: SSITD & NexGen Portfolio of the Week Series
Focus: Worldwide
By Sun Storm Investment Research & NexGen Wealth Management Service
A Profit & Solutions Strategy & Research
Trading | Investment | Stocks | ETF | Mutual Funds | Crypto | Bonds | Options | Dividend | Futures |
USA | Canada | UK | Germany | France | Italy | Rest of Europe | Mexico | India
Disclaimer: Sun Storm Investment and NexGen are not registered financial advisors, so please do your own research before trading & investing anything. This is information is for only research purposes not for actual trading & investing decision.
#debadipb #profitsolutions

WDAY spike reversal intraday - yuckTested 300 and got smacked. small bear wedge implies more downside, perhaps to lower end of channel. looking for 270-280. be careful as we get closer to earnings. playing with dec 310 puts.


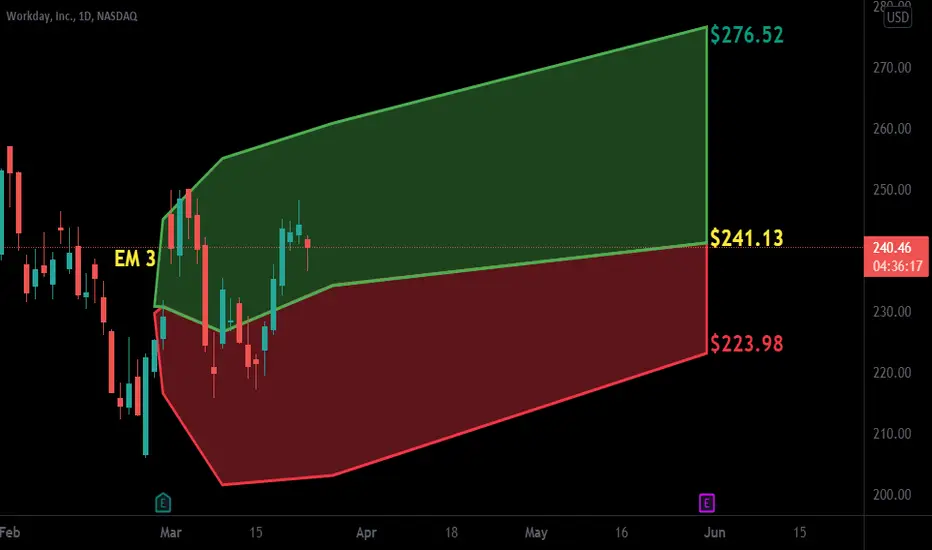
WDAY BullWDAY IMO looks bullish with this power earnings gap flag holding up and now wanting to go towards the next pivot at $283
