Cup and HandleWDAY appears to be in another cup and handle pattern..
MC/Mid Cup 222.25 and HL/Handle low can provide support
Pattern is not valid until long entry level of 248.86
Keeping an eye on the possible W I see in the chart... long with caution..as always keeping an eye on market conditions.
Not a recommendation
I am hoping we see a bull market continuation for 2021. Many of us, me anyway, have not been through a bear market. I have been studying up on it just in case. I read a bit so far but bear markets often start with sharp moves down and quick retracements up. If we still want to go long, entering will probably be in and out on the retrace up if the trend is down which would be the case in a bear market, we will need to trade countertrend.
Of course the shorties will be in heaven! LOL I need to learn though..just in case!
Trade ideas

WDAY potential breakout, crossing 50MA on Daily, low RSIVolume picks up on the last few hrs on trading day, potential move to the upside of channel


Buy - $WDAY - WorkdayBuy signal indicated on 27th October at $213. Price is now at 207 which is a good entry IMO.
Looks like price is respecting the 200ma on the 4 hour chart. If it stays within the triangle I think we will break higher over the next couple of weeks as earnings were solid albeit a slightly bearish outlook from the company.
Stop: 170
TP: TBC

WDAY breakout watchI expect a breakout in this name soon.
For call options I like the Jan 15 230s and 250s

WDAY - Trade setupI love this breakout here on WDAY. This is setting up to be a runner. If we can open tomorrow in the green I like an entry for a beautiful swing trade into Xmas.. Lets make sure it's not a head fake breakout.. Merrry Christmas enjoy the present. $240 would be a good target. If it breaks set a stop limit above that.
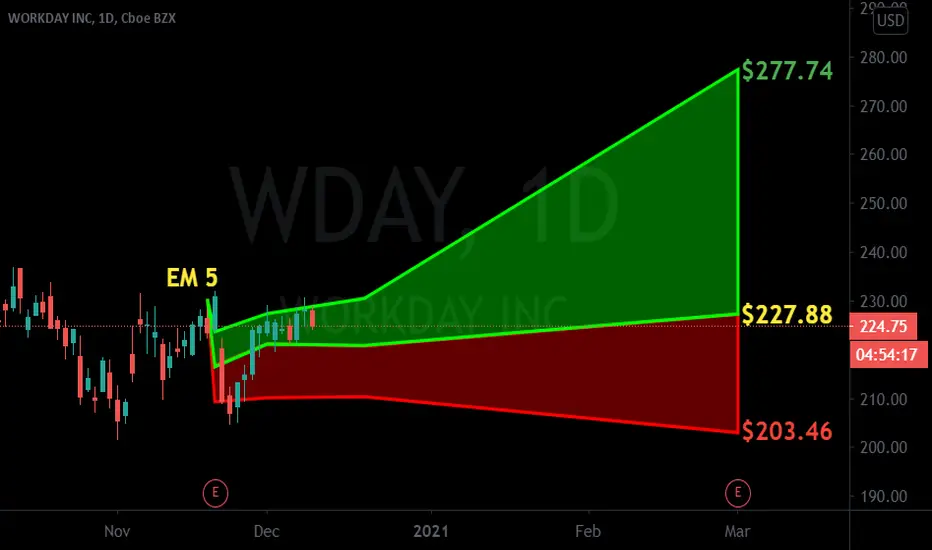
$WDAY with a neutral outlook following its earning release$WDAY posted earnings with a negative under reaction following its earning release with the PEAD projecting a neutral outlook placing the stock in Drift D
If you would like to see the Drift for another stock please message us. Also click on the Like Button if this was useful and follow us or join us.
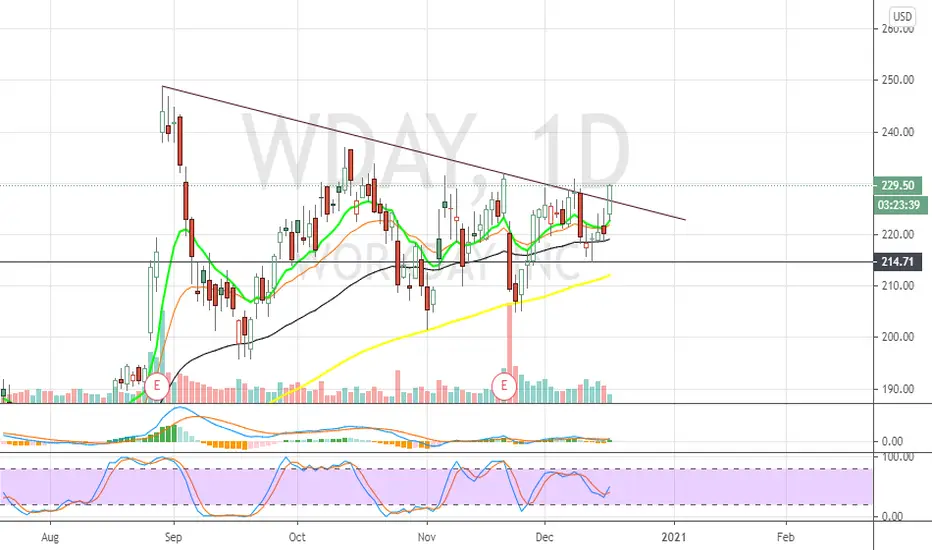
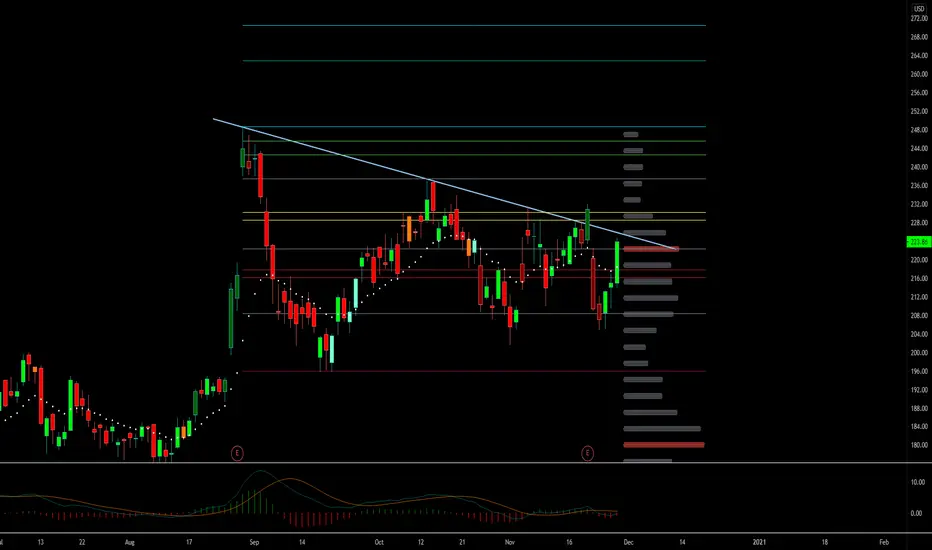
$WDAY stabilized & setting up Workday seem to have found its footings after its earnings selloff, found buyers, put in higher low and now attacking the down sloping trendline for a breakout setup.


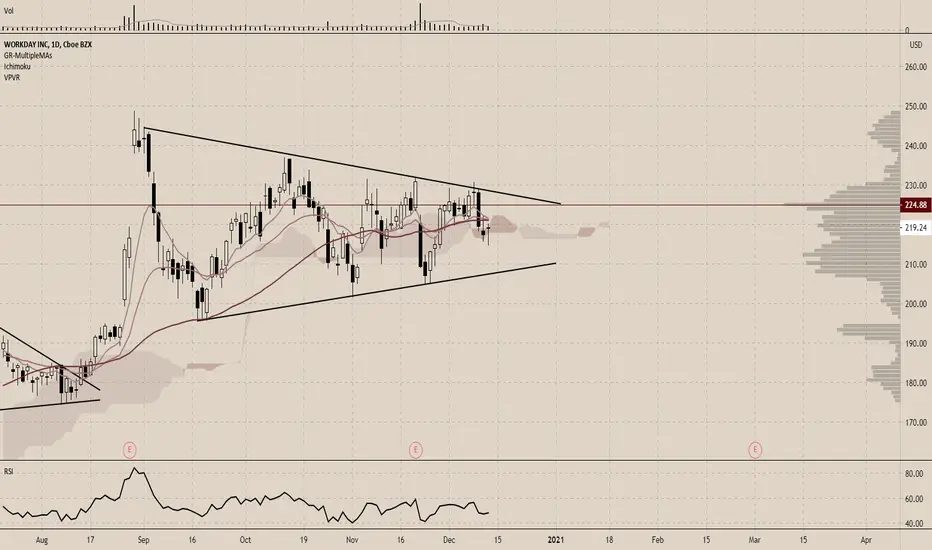
2 bullish scenariosWDAY has 2 bullish scenarios so far
C&H on the daily short term
Bullish pennant long term with blue horizontal line as support. Today's price action will show which scenario it will pick.


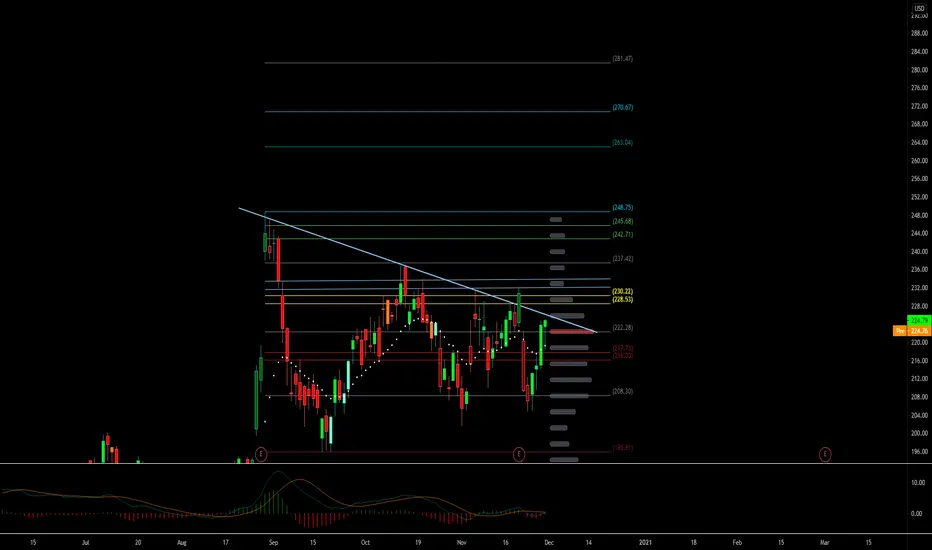
$WDAY - Bullish Trade Set UpSymmetrical triangle on WDAY daily. Breakout above 230 and my text targets are 236 and then 248.

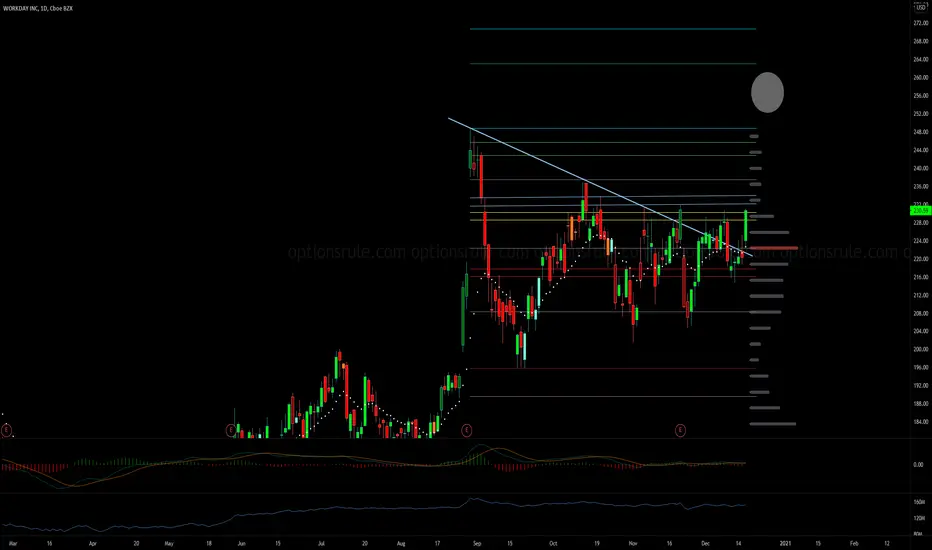
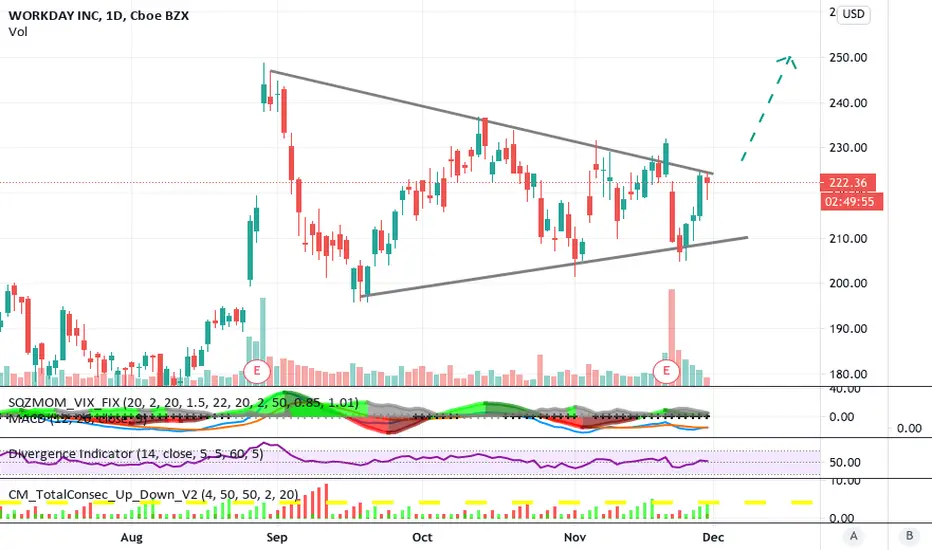
S TriangleSymmetrical Triangle that is beginning to look like a flag..a long flag...
The prior A triangle has held as support with the exception of a few candle tails..so that is a strong level of S as tails tell a tale..
The big move up aseveral weeks ago has cost WDAY dearly as far as ranging for quite a while inside a triangle..it does look like it is trying hard to break out..but until it does..dunno..a security can't go up that fast as a rule without paying the price later on..
I can only profit from what I can anticipate..but I can not change what will happen
Not a recommendation

WDAY, enters Uptrend as Momentum ascends above 0 levelThis indicator may be signaling that WDAY's price has momentum to move higher, since its current price exceeds the price logged 14 days ago. Traders may consider buying the stock or exploring call options. Tickeron's A.I.dvisor backtested 88 similar cases where WDAY's Momentum Indicator exceeded 0, and 71 of them led to a successful outcome. Odds of Success: 81%. Current price $221.20 crossed the support line at $224.31 and is trading between $224.31 support and $197.93 resistance lines. Throughout the month of 10/27/20 - 11/27/20, the price experienced a +5% Uptrend, while the week of 11/19/20 - 11/27/20 shows a -3% Downtrend.
Bullish Trend Analysis
The Stochastic Indicator suggests the stock price trend may be in a reversal from a downward trend to an upward trend. Tickeros A.I. detected that in 38 of 51 cases where WDAY's Stochastic Oscillator exited the oversold zone resulted in an increase in price. Tickeron's analysis proposes that the odds of a continued upward trend are 75%.
The Momentum Indicator moved above the 0 level on November 27, 2020. You may want to consider a long position or call options on WDAY as a result. Tickeros A.I. detected that in 71 of 88 past instances where the momentum indicator moved above 0, the stock continued to climb. The odds of a continued upward trend are 81%.
The 10-day Moving Average for WDAY crossed bullishly above the 50-day moving average on November 13, 2020. This indicates that the trend has shifted higher and could be considered a buy signal. Tickeros A.I. detected that in 13 of 16 past instances when the 10-day crossed above the 50-day, the stock continued to move higher over the following month. The odds of a continued upward trend are 81%.
Following a +5.03% 3-day Advance, the price is estimated to grow further. Considering data from situations where WDAY advanced for three days, in 242 of 341 cases, the price rose further within the following month. The odds of a continued upward trend are 71%.
WDAY may jump back above the lower band and head toward the middle band. Traders may consider buying the stock or exploring call options.


WDAY ChannelingWDAY, due to earnings, dropped significantly. On the 4 hr, It crashed through the 100 MA, and hit the 200 MA. 200MA served as good support previously and finished the day as a doji.
Bullish pattern showing.
