Z eyes on $68.80-69.75: Resistance even the Fib-Blind can SEEZillow has bounced into a major landmark of its lifetime.
Zone is defined by a Golden Covid and a Minor Genesis fib.
This has been tested from both sides many times already.
$ 68.60-69.75 is the exact resistance to watch.
$ 61.82-62.50 is the first support below to hold.
$ 76.18-7./00 is a good fir
Next report date
—
Report period
—
EPS estimate
—
Revenue estimate
—
−0.22 EUR
−108.19 M EUR
2.16 B EUR
48.16 M
About Zillow Group, Inc.
Sector
Industry
CEO
Jeremy Wacksman
Website
Headquarters
Seattle
Founded
2004
ISIN
US98954M1018
FIGI
BBG01TNWM745
Zillow Group, Inc. engages in the provision of real estate and home-related information marketplaces on mobile and the web. The company was founded by Richard N. Barton and Lloyd D. Frink in December 2004 and is headquartered in Seattle, WA.
Related stocks

Zillow Group, Inc. (Z) Expands Online Real Estate ReachZillow Group, Inc. (Z) operates one of the most popular online real estate marketplaces, connecting buyers, sellers, renters, and real estate professionals. Its platform offers home listings, market data, mortgage tools, and rental management solutions. Zillow’s growth is fueled by the digital trans

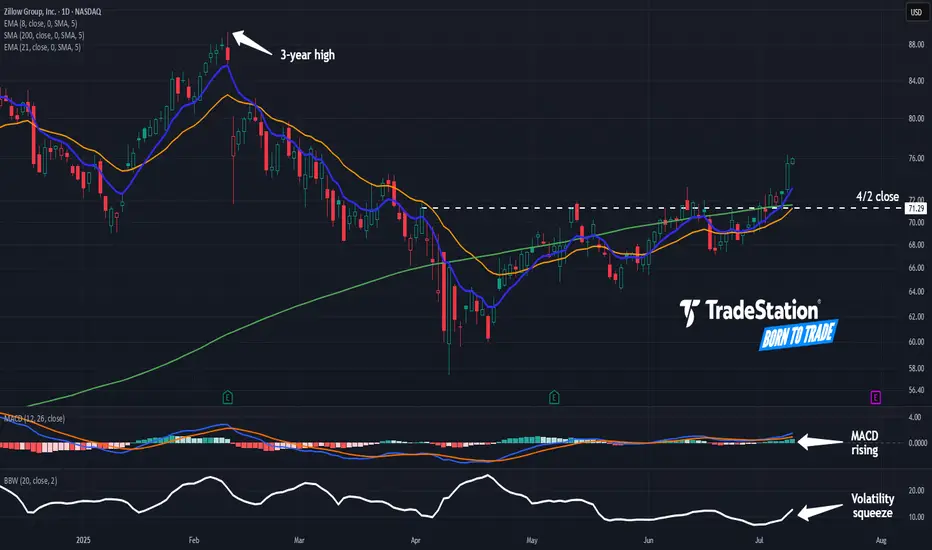
Zillow May Be Coming to LifeZillow has been in a tight range for months, but now it may be coming to life.
The first pattern on today’s chart is the April 2 close of $71.29. Z closed above it last week and is extending the move, which may confirm a breakout.
Second, prices pushed above the rising 200-day simple moving averag
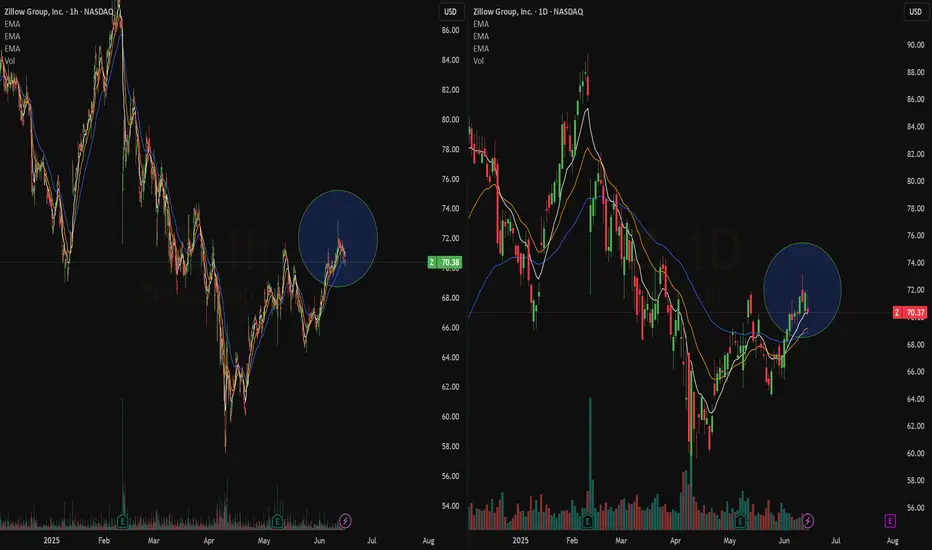
Quick View: $Z- Bullish Crossover on the daily chart, Bullish wave on the hourly chart.
- Some more volume would be good to support a new action to create new highs
What are your thoughts about my Zillow Analysis?I do believe Zillow will touch $98.04 then either push through, consolidate, or reverse. What are your thoughts?

2/11/25 - $z - I don't get it2/11/25 :: VROCKSTAR :: NASDAQ:Z
I don't get it
- 2.5% fcf yield "let's see"
- google search trends keep seeing lower highs, lower lows (trends.google.com)
- it's not like rates are going down... so there's some obvious friction in the system
- and really... 35x 2026 PE for this?
- i applaud the

Z tags $85, pulls back to $75MODs have suggested that I provide more detail about the picks I make.
Sorry. I'm not as verbose as y'all, and I don't like things to be complicated.
My trading plan is very simple.
I buy or sell at top & bottom of parallel channels.
I confirm when price hits Fibonacci levels.
So...
Here's wh

New Setup: ZZ : I have a swing trade setup signal. I'm looking to enter long if the stock can manage to CLOSE above the last candle high(BUY). If triggered, I will then place a stop-loss below (SL) and a price target above it(TP-50%,move SL to breakeven), then using the close below the 10SMA as my trailing stop

Zillow Group, Inc. (Z) AnalysisCompany Overview:
Zillow Group, Inc. NASDAQ:Z is a leading online real estate marketplace, transforming the real estate industry through innovative technology and strategic partnerships. Its platform serves as a bridge between high-intent homebuyers/renters and top-performing agents, fostering an

Z pullback to $65MODs have suggested that I provide more detail about the picks I make.
Sorry. I'm not as verbose as y'all, and I don't like things to be complicated.
My trading plan is very simple.
I buy or sell at top & bottom of parallel channels.
I confirm when price hits Fibonacci levels.
Bonus if a TTM Sq

See all ideas
Summarizing what the indicators are suggesting.
Neutral
SellBuy
Strong sellStrong buy
Strong sellSellNeutralBuyStrong buy
Neutral
SellBuy
Strong sellStrong buy
Strong sellSellNeutralBuyStrong buy
Neutral
SellBuy
Strong sellStrong buy
Strong sellSellNeutralBuyStrong buy
An aggregate view of professional's ratings.
Neutral
SellBuy
Strong sellStrong buy
Strong sellSellNeutralBuyStrong buy
Neutral
SellBuy
Strong sellStrong buy
Strong sellSellNeutralBuyStrong buy
Neutral
SellBuy
Strong sellStrong buy
Strong sellSellNeutralBuyStrong buy
Frequently Asked Questions
The current price of 1ZGU is 61.98 EUR — it has decreased by −0.67% in the past 24 hours. Watch Zillow Group, Inc. Class A stock price performance more closely on the chart.
Depending on the exchange, the stock ticker may vary. For instance, on MIL exchange Zillow Group, Inc. Class A stocks are traded under the ticker 1ZGU.
1ZGU stock has fallen by −6.43% compared to the previous week, the month change is a −13.34% fall, over the last year Zillow Group, Inc. Class A has showed a 9.58% increase.
We've gathered analysts' opinions on Zillow Group, Inc. Class A future price: according to them, 1ZGU price has a max estimate of 89.62 EUR and a min estimate of 56.33 EUR. Watch 1ZGU chart and read a more detailed Zillow Group, Inc. Class A stock forecast: see what analysts think of Zillow Group, Inc. Class A and suggest that you do with its stocks.
1ZGU reached its all-time high on Aug 27, 2025 with the price of 74.84 EUR, and its all-time low was 55.32 EUR and was reached on Jun 20, 2025. View more price dynamics on 1ZGU chart.
See other stocks reaching their highest and lowest prices.
See other stocks reaching their highest and lowest prices.
1ZGU stock is 0.68% volatile and has beta coefficient of 0.94. Track Zillow Group, Inc. Class A stock price on the chart and check out the list of the most volatile stocks — is Zillow Group, Inc. Class A there?
Today Zillow Group, Inc. Class A has the market capitalization of 14.57 B, it has decreased by −3.72% over the last week.
Yes, you can track Zillow Group, Inc. Class A financials in yearly and quarterly reports right on TradingView.
Zillow Group, Inc. Class A is going to release the next earnings report on Oct 30, 2025. Keep track of upcoming events with our Earnings Calendar.
1ZGU earnings for the last quarter are 0.34 EUR per share, whereas the estimation was 0.36 EUR resulting in a −4.96% surprise. The estimated earnings for the next quarter are 0.36 EUR per share. See more details about Zillow Group, Inc. Class A earnings.
Zillow Group, Inc. Class A revenue for the last quarter amounts to 556.03 M EUR, despite the estimated figure of 550.03 M EUR. In the next quarter, revenue is expected to reach 571.05 M EUR.
1ZGU net income for the last quarter is 1.70 M EUR, while the quarter before that showed 7.39 M EUR of net income which accounts for −77.04% change. Track more Zillow Group, Inc. Class A financial stats to get the full picture.
No, 1ZGU doesn't pay any dividends to its shareholders. But don't worry, we've prepared a list of high-dividend stocks for you.
As of Oct 8, 2025, the company has 6.86 K employees. See our rating of the largest employees — is Zillow Group, Inc. Class A on this list?
EBITDA measures a company's operating performance, its growth signifies an improvement in the efficiency of a company. Zillow Group, Inc. Class A EBITDA is 129.03 M EUR, and current EBITDA margin is 3.53%. See more stats in Zillow Group, Inc. Class A financial statements.
Like other stocks, 1ZGU shares are traded on stock exchanges, e.g. Nasdaq, Nyse, Euronext, and the easiest way to buy them is through an online stock broker. To do this, you need to open an account and follow a broker's procedures, then start trading. You can trade Zillow Group, Inc. Class A stock right from TradingView charts — choose your broker and connect to your account.