MNT | Up to new HighsMNTUSDT is experiencing a powerful bullish breakout, pushing toward new all-time highs after a prolonged consolidation period. The price has successfully broken above the key resistance level at $1.41 and is now targeting the upper resistance zones.
Key Observations:
• Strong momentum following b

MNT – ltf supportComing into horizontal support zone here, also supported by H4 EMA200.
I would like to see a sweep of the local bad lows, then a move into H4 EMA 100 where we find some poor highs to target.
Breaking out of the channel sets us up for a move towards the HTF supply zone, where we left a lot of bad h

Mantle ($MNT) — an underrated giant backed by Bybit?Current market cap: ~$4B
For comparison: CRYPTOCAP:BNB sits at $121B.
Yet the gap between Binance and Bybit is shrinking fast.
👀 Recently, I’ve seen more and more tokens launching under the Mantle ecosystem — and some serious tweets suggesting Bybit is “criminally pushing” its assets.
But here’s

mnt long to $1.52 just recently open up a long position on mnt. Aiming for new ATH
sl: 1.24
tp: 1.52
Time sensitive

Super Trend Signals Bullish Setup for MNTMNT is showing a clear bullish structure as its Super Trend indicator forms dynamic support just below the price at $0.99. This alignment confirms the strength of the ongoing uptrend and suggests that buyers remain firmly in control.
The Super Trend is a volatility-based indicator that helps trader

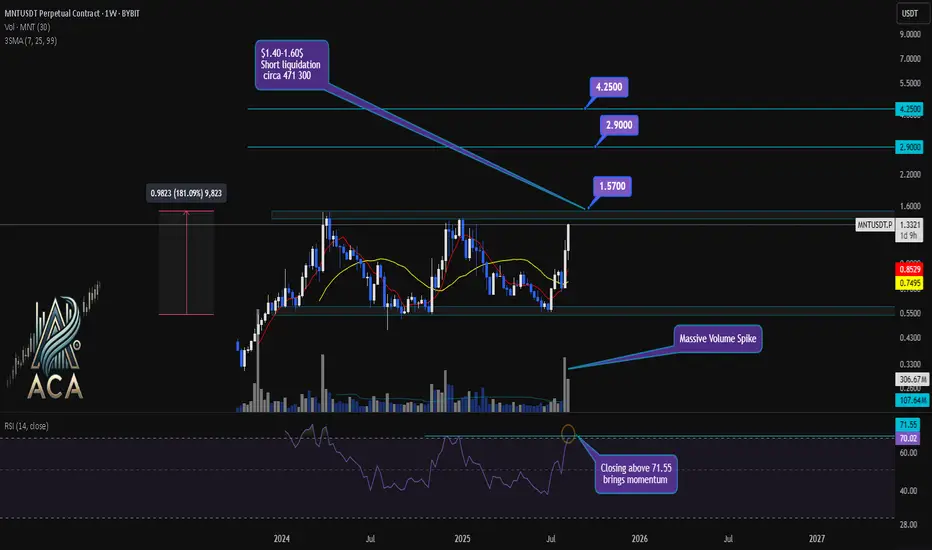
MNTUSDT Weekly Chart Analysis | Momentum & Key Targets UnveiledMNTUSDT Weekly Chart Analysis | Momentum & Key Targets Unveiled
🔍 Let’s dive into MNTUSDT perpetual contracts and decode the current price action, focusing on order flow, volume, liquidations, and momentum for top trading setups.
⏳ Weekly Overview
The weekly chart shows MNTUSDT surging out of a
Mantle ($MNTUSDT) — Breakout from Accumulation and Formation 📈 Mantle ( BYBIT:MNTUSDT ) — Breakout from Accumulation and Formation of a Mid-Term Uptrend
On the 1D chart, TSX:MNT is showing a clear trend reversal structure. After a long accumulation phase in the $0.55–$0.75 range, the price has surged over 100% and broken through a key resistance zone at $1

MNT Breakout Watch – Testing Red Resistance!🚨 MNT Breakout Watch – Testing Red Resistance! 🔴⏳
MNT is testing the red resistance zone.
📊 If a breakout confirms, the move could target:
🎯 First Target → Green line level
A strong breakout could trigger bullish continuation.

MNT | New All Time High Soon?Mantle is showing strong bullish momentum after breaking above the descending trendline and clearing the key resistance zone around $1.10. The price action suggests a powerful reversal from the long-term downtrend.
Key Technical Factors:
• Clean breakout above descending resistance trendline
• Pr

MNT trying to reach new heightsOne of the most obscure tokens suddenly comes to life and delivers one of the strongest gains among the top 100. And now everything points to it reaching new heights. Here's why:
➡️ The price is in an interesting position, moving in a flag pattern throughout the year. However, recently, the price m

See all ideas
Summarizing what the indicators are suggesting.
Oscillators
Neutral
SellBuy
Strong sellStrong buy
Strong sellSellNeutralBuyStrong buy
Oscillators
Neutral
SellBuy
Strong sellStrong buy
Strong sellSellNeutralBuyStrong buy
Summary
Neutral
SellBuy
Strong sellStrong buy
Strong sellSellNeutralBuyStrong buy
Summary
Neutral
SellBuy
Strong sellStrong buy
Strong sellSellNeutralBuyStrong buy
Summary
Neutral
SellBuy
Strong sellStrong buy
Strong sellSellNeutralBuyStrong buy
Moving Averages
Neutral
SellBuy
Strong sellStrong buy
Strong sellSellNeutralBuyStrong buy
Moving Averages
Neutral
SellBuy
Strong sellStrong buy
Strong sellSellNeutralBuyStrong buy