MOODENG is cooking next +200% only if support holdif price hold above 0.10$ for two months in this period we will see next 2x-3x easy and our target would hit else below 0.10$ more -50% will lead and that pump will start after hitting 0.05$ first.
DISCLAIMER: ((trade based on your own decision))
<<press like👍 if you enjoy💚
MOODENGUSDT.3S trade ideas

MOODENG / USDT : Showing strength after successful retestAfter a successful retest, MOODENG is showing strong momentum and moving forward. A rally towards $0.30 – $0.35 is now expected.
Always manage risk and wait for confirmation on the next moves.

MOODENG - UP UP UPTomorrow is an important day for crypto — the interest rate decision is coming. Let’s get into one great trade before that and see what happens!

Continuation likely.After a 60%+ move already this week from moodeng, the meme held the bottom side of the consolidation range. Since it didn't break down I look for it to break out to the upside. Upon break above .25 cents I look for a quick move up to .30 cents, minor resistance @.32 and more important resistance around .35. Let's not forget in May this shiiite coin ran from .04 cents to .35 in a weeks time. Not saying it'll do 800%+ again but it wouldn't suprised me at all to see. 50 or .60 cents. Who knows? If it just bulldozes past all resistance I'll sell most of my position @ $1 and subsequently quit my job. But first things first.....let's see this console range break to the upside.

Moodeng HTF ideaHave this idea on Moodeng. FRVP is from A to B. Areas of interest are :
1) 1DHOB which is above VAH
2) 1D Demand which there is the POC also.
SL covers both levels ( i know its wide ), and its placed below the CBOB as found in many TF's.
I will try to enter M.O with microTF confirmation and confluence from Majors

Moodeng Liquidity Grab + ReversalStrategy: Liquidity Grab + Reversal
Entry: $0.15350-$0.15000
Stop Loss: $0.14490
Take Profits: $0.17600, $0.19500
📊 Rationale:
– HTF trend: Range-bound with engineered downside inducement
– LTF structure: Watching for bullish CHoCH after sweep below local support
– Liquidity targeting: Price is likely to run sell-side stops below $0.16000–$0.15000 and reverse from unmitigated demand
🧠 Volume remains calm, OI is stable, and market is setting up for a clean liquidity sweep into a prior reaction zone. Confirmation will follow from M5–M15 CHoCH after the sweep.
⸻
🧠 Stay sharp. Trade smart. Let the market come to us.

Moodeng Meme Coin sell-off happening as expectedMoodeng Meme Coin sell-off is happening as expected. It's taking some weeks and this meme coin is dropping as a reaction to the very strong supply imbalance in the bigger timeframes. This trade idea has been shared in the past and for those swing traders holding this meme coin it's time to manage the short positons.

Moo Deng Crypto Meme Coin is dropping as expectedMoo Deng Crypto Meme Coin is dropping as expected. There is still a lot of room for this crypto to keep on dropping with the help of the strong monthly supply imbalance mentioned in a previous update.

Moodeng / UsdtGATEIO:MOODENGUSDT
Nice move on **MOODENG/USDT** — structure respecting support zones well! Let's see if it pushes toward that resistance. 👀📈
**Disclaimer:** This is not financial advice. Always DYOR.

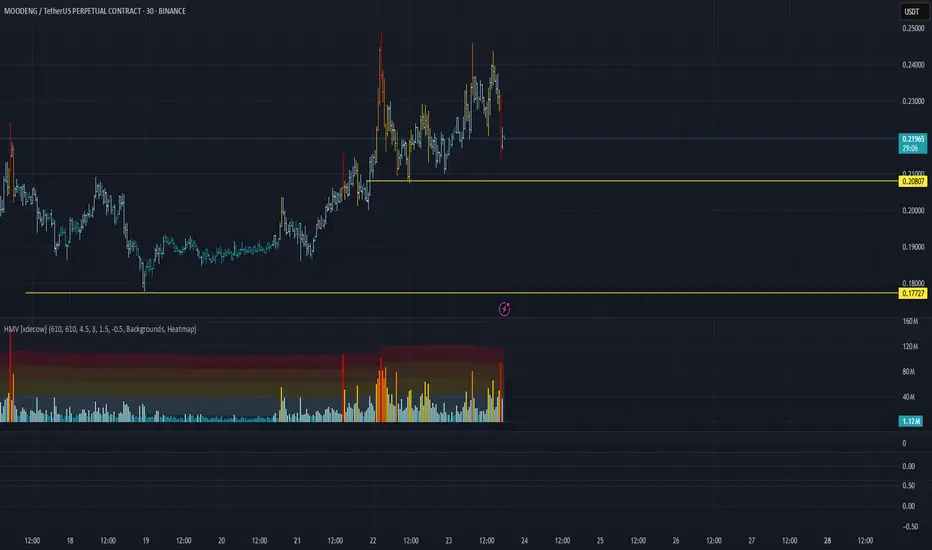
MOODENG/USDT Analysis: Looking for Long Opportunities
At the moment, we’ve been in an accumulation phase since yesterday. Within the current range, we’ve observed strong absorption of market selling based on cumulative delta (delta is falling while price remains stable). Additionally, earlier activity from a large player was noted near the lower boundary.
The safest long entry appears to be a false breakout below the $0.208 level.
This publication is not financial advice.
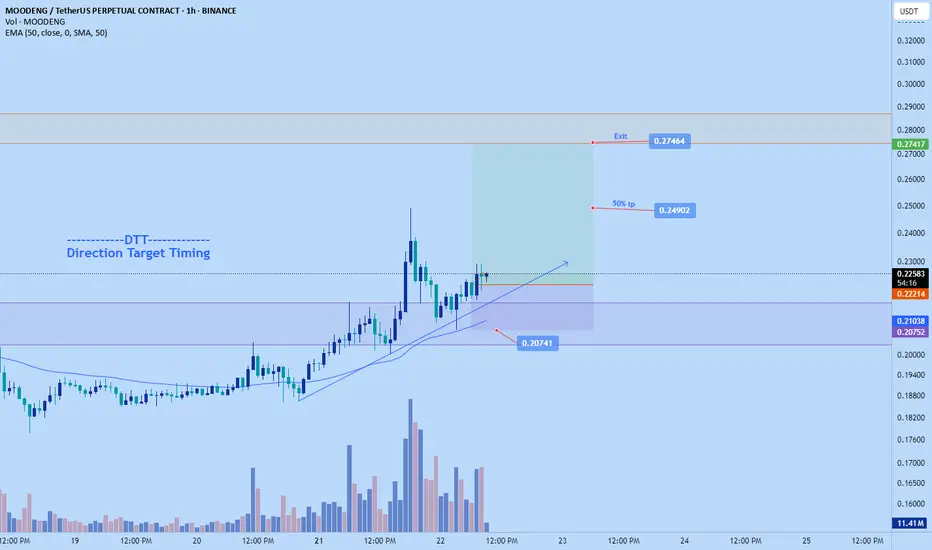
Moodeng pump to $0.27464Just opened up a long position on moodeng.
Aiming for $0.27464
Sl: $0.20741
2-3.56RR trade
DTT strategy use.
Moodenge had a sharp correction last night , even so it maitain its 4hr uptrend structure and on 1hr tf also started to break back above resistance levels suggesting that the correction is likely over. On weekly tf it also still have space left before it reaches its HH point. Volume also confirms that whales are likely getting ready to pump it as soon as btc settles down as currently its moving mad volatile - big sell to down side still moodeng is not reacting as much. The moment btc finds support good chance it will pump quickly with the correlation align
Anyways Time sensitive
MOODENG Approaching Breakout PointMOODENG is compressing inside a symmetrical triangle on the daily chart 📊. The price action is tightening as it nears the apex, signaling that a major move could be right around the corner 🔺.
Triangles like this often lead to sharp volatility once the breakout happens—whether up or down 💥. Traders should prepare for momentum expansion soon, as the market decides its next direction.
Stay focused—the phase of calm is ending, and the real action is about to start 👀.

MOODENGUSDY near major resistance zone (Possible breakout ahead)As we can see price is near last and major resistance zone which is red trendline resistance and valid breakout here to the upside cause huge amount of rise and pump like green arrows on chart.
DISCLAIMER: ((trade based on your own decision))
<<press like👍 if you enjoy💚

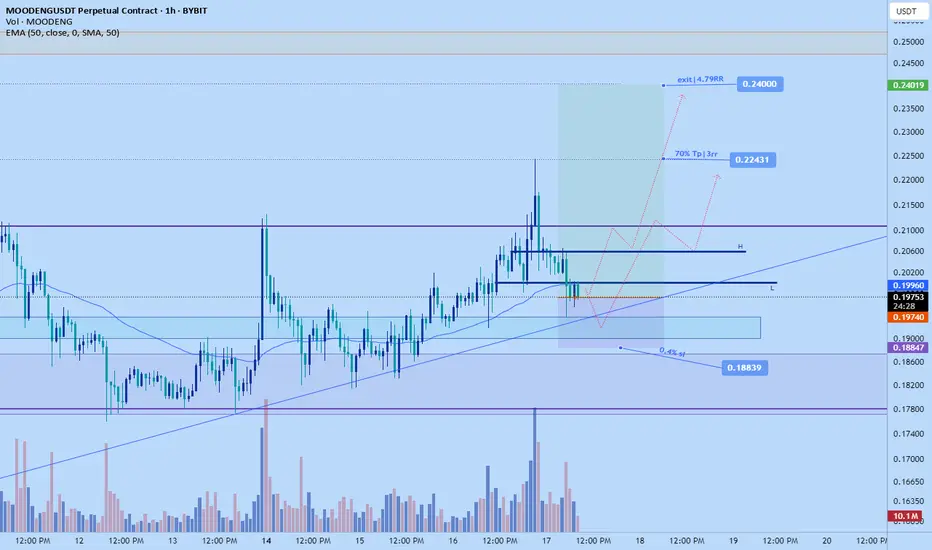
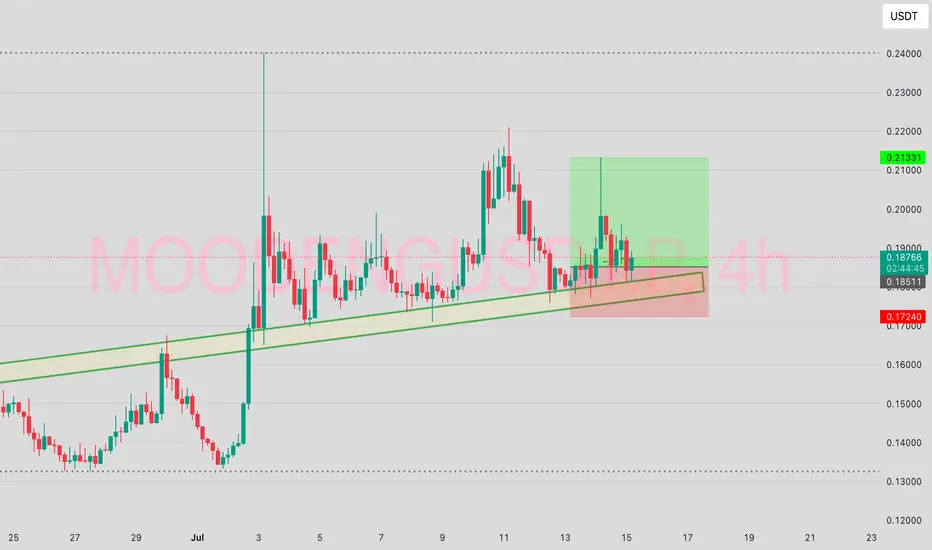
Moodeng new long to $0.24I just now entered a new long position on moodeng. I was in it before, took 50% take profit at $0.221 area then it came back and stop me out, still made profit.
This is 2nd attempt , considering its thursday - getting closer to end of week I think its less likely to fall lower as I did analyze from the weekly down and deduced that by end of week or before then we'll hit the 0.24 target.
Sl is : $0.18839, should be sufficient incase we get another attempt to make new lows on 4hr tf
Tp 1: $0.22431
Exit: $0.24
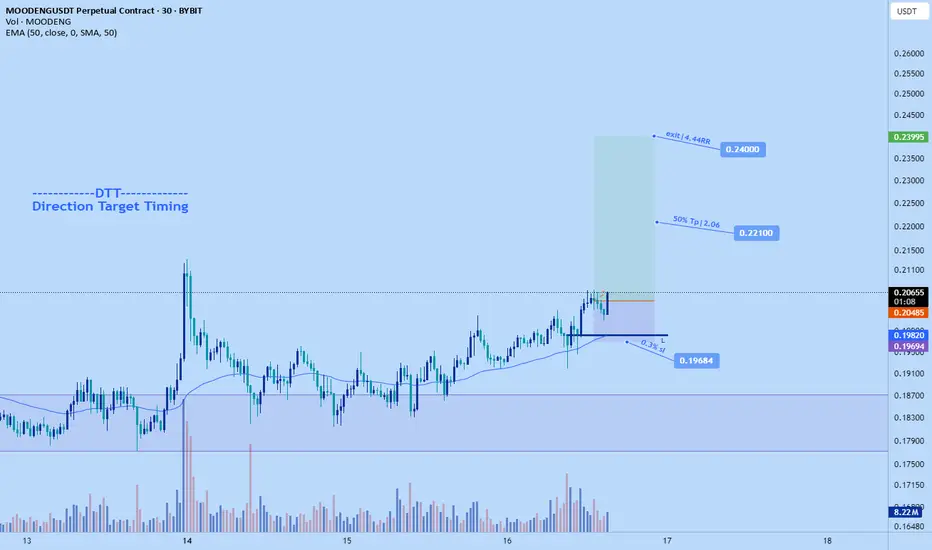
Moodeng big pump to $0.24 now!moodeng long🚀
🛡️Sl: $0.0.19684 or lower
🎯Tp1: $0.221 ---50% tp
🎯Exit : $0.24---50% 🎯
DTT strategy applied. Learn more on my X
MOODENG/USDT Technical Analysis – Massive Breakout Incoming?
🔍 Pattern Identified: Falling Wedge – A Classic Bullish Reversal Setup
The MOODENG/USDT pair is currently forming a Falling Wedge pattern, a well-known structure that often appears at the end of a downtrend, signaling a potential bullish reversal.
Key characteristics of the Falling Wedge:
Down-sloping resistance and support lines converging toward each other.
Price action narrowing within the wedge as sellers weaken.
Often results in a powerful breakout to the upside, especially when accompanied by a volume surge.
📈 Bullish Scenario (Breakout Potential)
If the price successfully breaks out above the wedge resistance and closes above 0.25 USDT, this will confirm the breakout and open up potential upside targets:
🟡 Target 1: 0.316 USDT – Minor resistance zone and past consolidation level.
🟡 Target 2: 0.455 USDT – Major horizontal resistance and psychological level.
🟡 Target 3: 0.626 USDT – Golden Fibonacci zone and previous structure highs.
🟡 Ultimate Target: 0.78 – 0.90 USDT – The full wedge breakout projection and former top.
🔔 Ideal breakout confirmation includes:
A daily candle close above the wedge resistance.
Strong breakout volume.
RSI pushing above 60 and MACD crossing bullishly.
📉 Bearish Scenario (Breakdown Risk)
If the price fails to break out and instead falls below wedge support (especially under 0.17 USDT), it may revisit lower levels:
🔻 Support 1: 0.11 USDT – Historical bounce zone.
🔻 Support 2: 0.07 USDT – Last significant demand area before May’s breakout.
🔻 Final Support: 0.015 USDT – All-time low (high risk zone).
Still, current structure remains more bullish-biased as price consolidates near the upper wedge edge.
🧠 Market Sentiment & Narrative
This Falling Wedge is forming at the tail end of a long downtrend, with the asset showing early signs of accumulation.
If the broader crypto market sees renewed strength, altcoins like MOODENG could lead the next wave.
Smart traders spot these setups before the breakout — not after the crowd joins.
✅ Conclusion
This Falling Wedge is not just visually clean but strategically strong in terms of risk-to-reward. A confirmed breakout could trigger a massive rally with more than 200% upside potential from current levels.
Keep a close watch on the breakout level, volume confirmation, and daily candle structure. Patterns like this only appear a few times per market cycle — and they often mark the beginning of something big.
#MOODENG #AltcoinBreakout #FallingWedgePattern #CryptoAnalysis #USDT #TechnicalBreakout #ChartSetup #BullishAltcoins #CryptoReversal #TradingOpportunity

$MOODENGThis BYBIT:MOODENGUSDT.P trade right here is so annoying to me such that I set a good and clear Target but the market choose not to pick my target.
I had set my target TP at 0.21331 while the market only got to 0.21224. Just a pip move upward could have hit my TP and I’m good.
Unfortunately, I wasn’t active to see this play only to return later and see it back to entry.
Now it’s supposed to be a new trade but here am I, waiting for old trade to close.
Meanwhile, the current market price(CMP) is still a good entry for this trade with same TP and SL.
Enjoy the ride back up with me
#NFA #DYOR
MOODENG – Wave 2 In Play, More Upside Ahead
Might be a bit bold here, but I see OKX:MOODENGUSDT pushing higher as long as it holds the 13c level.
It had a strong impulsive move, and this looks like wave 2 of the current momentum.
Daily downtrend signals from the local high have already expired, increasing the odds of continuation from here.
If momentum picks up, I’m eyeing 40–44c as a potential target zone.
MOODENG isn’t done yet!

Buy Trade Strategy for MOODENG: Tapping Into Web3 Identity Growt
This trading idea focuses on MOODENG, an emerging cryptocurrency project aiming to revolutionize digital identity and user engagement within the Web3 ecosystem. MOODENG stands out for its mission to decentralize online identity management, offering individuals more control over their data and privacy while interacting across various decentralized applications (dApps). With increasing attention on user sovereignty, data protection, and digital reputation, MOODENG is well-positioned to capture value in a growing segment of the blockchain industry that intersects with both DeFi and social Web3 infrastructure.
As governments and users alike call for more transparency and decentralization, the fundamental vision behind MOODENG aligns with long-term trends favoring open, secure, and self-managed identity systems. Still, due to the early-stage nature of the project and the volatile landscape of the crypto sector, investments in MOODENG should be made with clear awareness of potential risks and rewards.
Disclaimer:
This trading idea is provided for educational purposes only and should not be considered financial advice. Cryptocurrency markets are highly volatile and speculative. Investing in MOODENG, like any digital asset, involves the risk of partial or total capital loss. Always conduct your own research, understand your financial situation, and consult with a financial advisor before making investment decisions. Past performance is not a guarantee of future results.

Moodeng Set to Drop 33% with Target at 0.12500 SoonHello,✌
let’s dive into a full analysis of the upcoming price potential for Moodeng 🔍📈.
OKX:MOODENGUSDT is currently approaching the upper boundary of a strong descending channel, aligned with a significant daily resistance level. Given this setup, a correction of at least 33% appears likely, with the main target near 0.12500. Traders should watch for confirmation before entering positions. ⚠️📉
✨ Need a little love!
We pour love into every post your support keeps us inspired! 💛 Don’t be shy, we’d love to hear from you on comments. Big thanks , Mad Whale 🐋

MOODENG/USDTKey Level Zone: 0.16800 - 0.17700
LMT v2.0 detected.
The setup looks promising—price previously trended upward with rising volume and momentum, then retested this zone cleanly. This presents an excellent reward-to-risk opportunity if momentum continues to align.
Introducing LMT (Levels & Momentum Trading)
- Over the past 3 years, I’ve refined my approach to focus more sharply on the single most important element in any trade: the KEY LEVEL.
- While HMT (High Momentum Trading) served me well—combining trend, momentum, volume, and structure across multiple timeframes—I realized that consistently identifying and respecting these critical price zones is what truly separates good trades from great ones.
- That insight led to the evolution of HMT into LMT – Levels & Momentum Trading.
Why the Change? (From HMT to LMT)
Switching from High Momentum Trading (HMT) to Levels & Momentum Trading (LMT) improves precision, risk control, and confidence by:
- Clearer Entries & Stops: Defined key levels make it easier to plan entries, stop-losses, and position sizing—no more guesswork.
- Better Signal Quality: Momentum is now always checked against a support or resistance zone—if it aligns, it's a stronger setup.
- Improved Reward-to-Risk: All trades are anchored to key levels, making it easier to calculate and manage risk effectively.
- Stronger Confidence: With clear invalidation points beyond key levels, it's easier to trust the plan and stay disciplined—even in tough markets.
Whenever I share a signal, it’s because:
- A high‐probability key level has been identified on a higher timeframe.
- Lower‐timeframe momentum, market structure and volume suggest continuation or reversal is imminent.
- The reward‐to‐risk (based on that key level) meets my criteria for a disciplined entry.
***Please note that conducting a comprehensive analysis on a single timeframe chart can be quite challenging and sometimes confusing. I appreciate your understanding of the effort involved.
Important Note: The Role of Key Levels
- Holding a key level zone: If price respects the key level zone, momentum often carries the trend in the expected direction. That’s when we look to enter, with stop-loss placed just beyond the zone with some buffer.
- Breaking a key level zone: A definitive break signals a potential stop‐out for trend traders. For reversal traders, it’s a cue to consider switching direction—price often retests broken zones as new support or resistance.
My Trading Rules (Unchanged)
Risk Management
- Maximum risk per trade: 2.5%
- Leverage: 5x
Exit Strategy / Profit Taking
- Sell at least 70% on the 3rd wave up (LTF Wave 5).
- Typically sell 50% during a high‐volume spike.
- Move stop‐loss to breakeven once the trade achieves a 1.5:1 R:R.
- Exit at breakeven if momentum fades or divergence appears.
The market is highly dynamic and constantly changing. LMT signals and target profit (TP) levels are based on the current price and movement, but market conditions can shift instantly, so it is crucial to remain adaptable and follow the market's movement.
If you find this signal/analysis meaningful, kindly like and share it.
Thank you for your support~
Sharing this with love!
From HMT to LMT: A Brief Version History
HM Signal :
Date: 17/08/2023
- Early concept identifying high momentum pullbacks within strong uptrends
- Triggered after a prior wave up with rising volume and momentum
- Focused on healthy retracements into support for optimal reward-to-risk setups
HMT v1.0:
Date: 18/10/2024
- Initial release of the High Momentum Trading framework
- Combined multi-timeframe trend, volume, and momentum analysis.
- Focused on identifying strong trending moves high momentum
HMT v2.0:
Date: 17/12/2024
- Major update to the Momentum indicator
- Reduced false signals from inaccurate momentum detection
- New screener with improved accuracy and fewer signals
HMT v3.0:
Date: 23/12/2024
- Added liquidity factor to enhance trend continuation
- Improved potential for momentum-based plays
- Increased winning probability by reducing entries during peaks
HMT v3.1:
Date: 31/12/2024
- Enhanced entry confirmation for improved reward-to-risk ratios
HMT v4.0:
Date: 05/01/2025
- Incorporated buying and selling pressure in lower timeframes to enhance the probability of trending moves while optimizing entry timing and scaling
HMT v4.1:
Date: 06/01/2025
- Enhanced take-profit (TP) target by incorporating market structure analysis
HMT v5 :
Date: 23/01/2025
- Refined wave analysis for trending conditions
- Incorporated lower timeframe (LTF) momentum to strengthen trend reliability
- Re-aligned and re-balanced entry conditions for improved accuracy
HMT v6 :
Date : 15/02/2025
- Integrated strong accumulation activity into in-depth wave analysis
HMT v7 :
Date : 20/03/2025
- Refined wave analysis along with accumulation and market sentiment
HMT v8 :
Date : 16/04/2025
- Fully restructured strategy logic
HMT v8.1 :
Date : 18/04/2025
- Refined Take Profit (TP) logic to be more conservative for improved win consistency
LMT v1.0 :
Date : 06/06/2025
- Rebranded to emphasize key levels + momentum as the core framework
LMT v2.0
Date: 11/06/2025

Breakout Alert: $MOODENG Looks Ready to Pop!$MOODENG looks ready to break out! 🚀
The chart is showing a falling wedge pattern, which is usually a sign that the price may go up soon.
Price is holding strong at support, and if it breaks above $0.193, we could see a move toward $0.222 or even higher (that’s around a 32% gain).
Trade Idea:
🔹 Buy Above: $0.193 (after breakout)
🔹 Targets: $0.222 and $0.238
🔹 Stop-loss: Below $0.169
Wait for the breakout and retest before buying.
DYOR, NFA

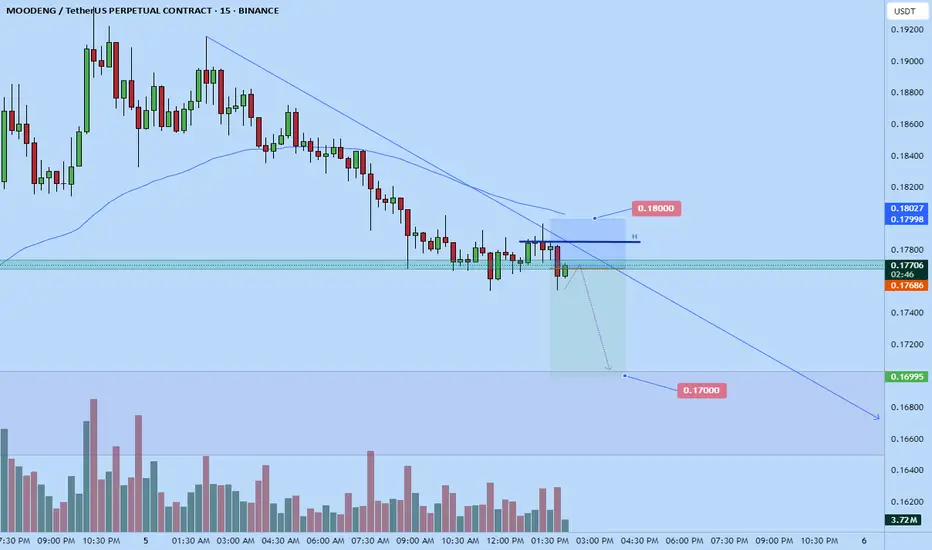
Moodeng short now!Hopped into a moodeng just now. Its about to fall based on my DTT analysis
Lets see how it goes
Stop: $0.18 or higher
Tp: $0.17 area
Time sensitive