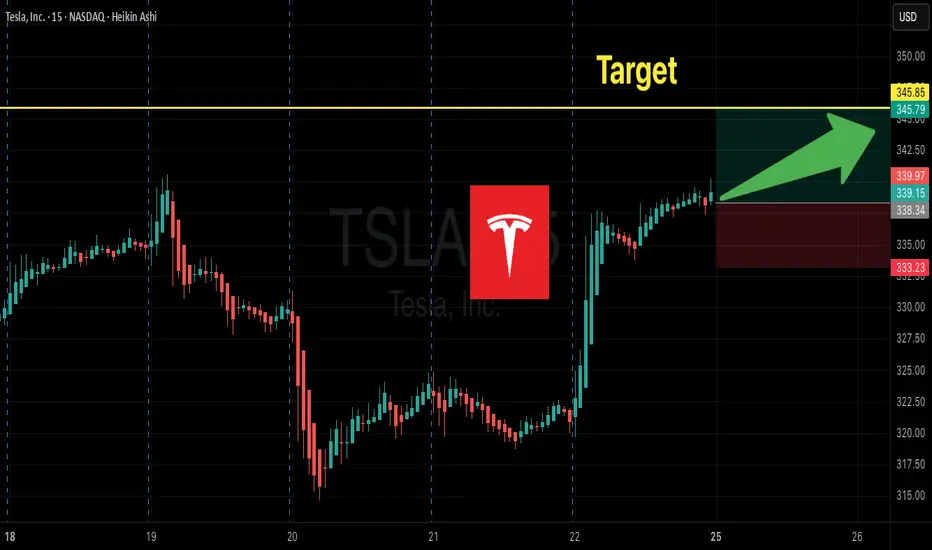
TSLA Weekly Options Setup:345C--Don’t Miss Out
# 🚀 TSLA Weekly Options Setup: Bullish Momentum Play w/ \$345C 🎯 (Aug 29 Expiry)
### 🔑 Multi-Model Summary
✅ RSI (Daily 60.1 → Weekly 65) = Bullish momentum
✅ VIX \~14.2 = Favorable volatility regime
⚠️ Weak weekly volume (0.9x) + neutral options flow (C/P \~1.10)
⚖️ Mixed models → Some lean bullish (\$345–355C), others prefer **no trade** due to weak institutional flow
---
### 📊 Recommended Trade (If You Take It)
* 🎯 **Instrument**: \ NASDAQ:TSLA
* 📈 **Direction**: Call (Long)
* 🎯 **Strike**: \$345C
* 💵 **Entry**: \~\$6.00 (limit at open)
* 🛑 **Stop**: \$3.60 (40% risk control)
* 🎯 **Target**: \$9.00 (+50%)
* 📅 **Expiry**: 2025-08-29
* 📏 **Size**: 1 contract (scalable)
* ⚡ **Exit**: By **Thursday close** (avoid Friday gamma decay)
* 🔒 **Confidence**: 65% (moderate conviction)
---
### ⚠️ Key Risks
* Weak volume = no big-money confirmation
* Event risk (SpaceX headlines)
* 5 DTE = aggressive theta decay
* Gamma swings → fast intraday moves
---
### 📌 Conclusion
Momentum favors upside, but lack of strong institutional confirmation = **medium conviction**.
👉 Conservative traders: wait.
👉 Active traders: \$345C is the best balance of **delta, liquidity, and leverage** this week.
---
### 🔥 Hashtags
\#TSLA #OptionsTrading #WeeklyOptions #CallOptions #SwingTrade #DayTrading #MomentumTrading #OptionsFlow #BreakoutTrading #StockMarket 🚀📈💎🔥
TL0 trade ideas
Tesla, it cant be this easy.Tesla is following the trendlines like a FINRA book would have you believe, which makes me suspicious. Just the same, dont fight whats in front of you. Should run into some resistance from 362ish. Stay nimble.

TESLA WILL KEEP GROWING|LONG|
✅TESLA is going up
Now and the stock made a bullish
Breakout of the key horizontal
Level of 346.00$ and the breakout
Is confirmed so we are bullish
Biased and we will be expecting
A further bullish move up
LONG🚀
✅Like and subscribe to never miss a new idea!✅

TESLA Expected Growth! BUY!
My dear friends,
Please, find my technical outlook for TESLA below:
The price is coiling around a solid key level - 333.86
Bias - Bullish
Technical Indicators: Pivot Points High anticipates a potential price reversal.
Super trend shows a clear buy, giving a perfect indicators' convergence.
Goal - 344.59
Safe Stop Loss - 327.03
About Used Indicators:
The pivot point itself is simply the average of the high, low and closing prices from the previous trading day.
Disclosure: I am part of Trade Nation's Influencer program and receive a monthly fee for using their TradingView charts in my analysis.
———————————
WISH YOU ALL LUCK

TESLA Bullish Wave C still underway...NASDAQ:TSLA is a tough count, the entire macro chart looks like a complex correction (wave 4?) with many series of 3 wave structures.
A triangle in wave B of the current wave appears complete, leading to a terminal thrust up with a target of the High Volume Node resistance at $410 followed by a poke above the swing high touching the R1 pivot at $548.
RSI remains at the EQ.
Analysis is invalidated below the wave B triangle.
Safe trading

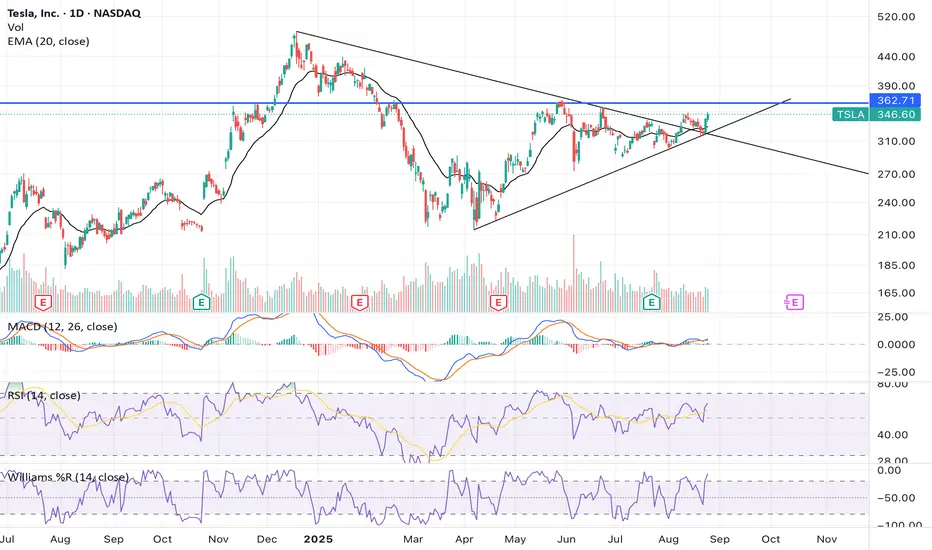
Tesla : A Symmetrical Triangle and Bullish Flag formation Disclaimer : Do your own research before investing. This is just a chart analysis. No recommendation to buy and sell.
Tesla company does not require any Introduction, Market leader in tech innovation.
Charts of Tesla is looking interesting where A Symmetrical Triangle and Bullish Flag formation is getting in place.
Tesla is having support around $300 mark and higher side is $488. will it regain that level again. Not one know about it. However, its getting in consolidation.
Current price of Tesla is $345 and one can look to $370 for near term.
TSLAPossible trade setup opportunity in TSLA based on:
1-Price action
2-Volumen action
3-Moving averages and momentum
4-General market conditions

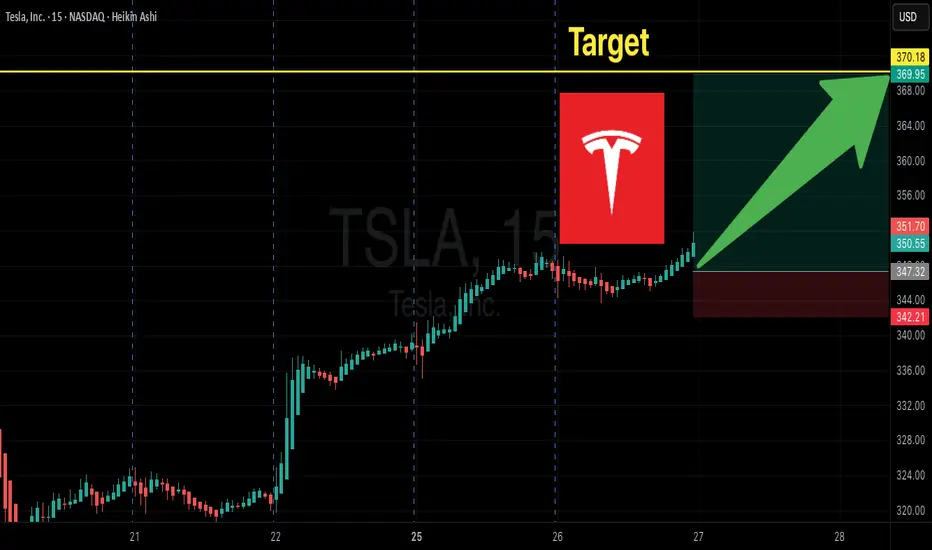
Tesla Options Flow Signals BIG Upside! $370C Momentum Trade
# 🚀 TSLA Weekly Options Setup | 370C Targeting 100%+ 📈
### 🔑 Key Highlights
* **Momentum:** RSI rising on both Daily (63.5) & Weekly (68.4) ✅
* **Options Flow:** Strong bullish skew (C/P = 1.79) 🟢
* **Volume:** Weak overall (0.9x), but institutional spike into close ⚡
* **Volatility:** VIX low → favorable for directional calls 😎
---
### 📊 Trade Setup (Consensus Pick)
* 🎯 **Instrument:** TSLA Weekly Call
* 💵 **Strike:** \$370C
* 📅 **Expiry:** 2025-08-29
* 💰 **Entry:** \$0.98 (ask) — open
* 🛑 **Stop:** \$0.49 (-50%)
* 🎯 **Target:** \$1.96 (+100%)
* ⏳ **Max Hold:** Close by **Thursday EOD** to avoid Friday theta/gamma crush
---
### 📌 Why \$370C?
* Best **liquidity** (OI \~18,450, vol 20k) → tightest fills ✅
* Balanced **delta & leverage** for short-term momentum 🎯
* Aligns with most model recommendations 📊
---
### ⚠️ Risks to Watch
* 🔻 **Theta decay** accelerates mid-week → avoid holding to Friday
* 🔻 **Gap risk** at open — manage entries with limit orders
* 🔻 **Market reversal** can kill momentum fast
---
## ✅ Final Verdict: **Strong Weekly Bullish Bias**
TSLA looks primed for an upside push — \$370C is the sweet spot for this week’s expiry.
---
### 🔥 Hashtags
\#TSLA #OptionsTrading #WeeklyOptions #StocksToWatch #MomentumTrading #TradingSignals #CallOptions #BullishSetup #TeslaStock
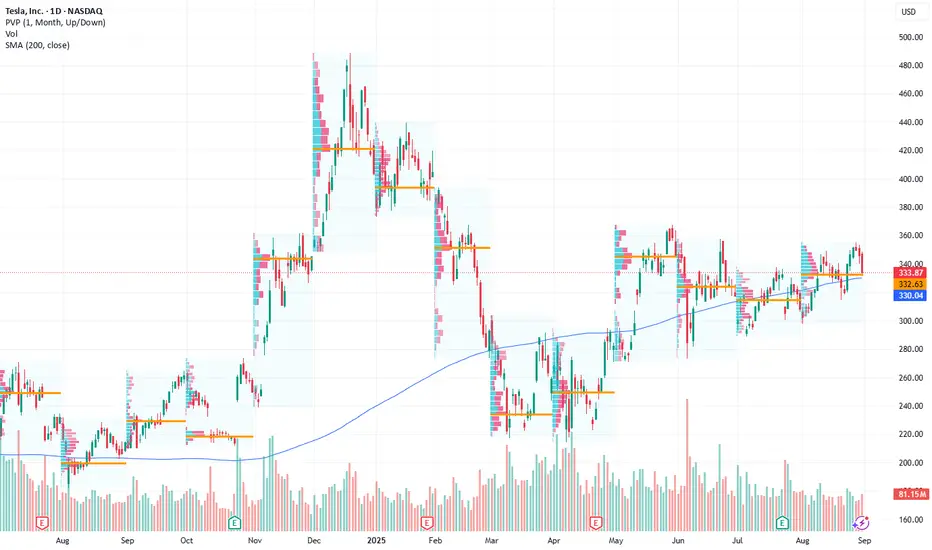
Tesla's Key Breakout Levels: Why $333 Signals Massive Upside
Current Price: $333.87
Direction: LONG
Targets:
- T1 = $349.00
- T2 = $365.00
Stop Levels:
- S1 = $320.00
- S2 = $310.00
**Wisdom of Professional Traders:**
This analysis synthesizes insights from thousands of professional traders and market experts, leveraging collective intelligence to identify high-probability trade setups. The wisdom of crowds suggests that the aggregated views of experienced market participants uncover underlying market trends and reduce biases associated with individual predictions. Tesla's current price levels reflect trader agreement on bullish catalysts and technical signals aligning toward a potential breakout.
**Key Insights:**
Tesla's recent market movements show a consolidation phase near $333.87, which has historically proven to be a key support for upward trajectories. Institutional investors and short-term traders have been closely observing market depth ratios and volume spikes, as they suggest increasing bullish momentum leading to potentially large swings toward higher price levels.
The tightening spread and Fibonacci retracement levels indicate that Tesla may be forming a strong upward trend, driven by robust demand in the electric vehicle sector and macroeconomic tailwinds. Traders widely believe Tesla still leverages its competitive edge in scaling EV production, navigating battery supply chains, and capitalizing on software integrations tied to energy ecosystems. Additionally, RSI (Relative Strength Index) metrics are moving out of oversold territory, reinforcing optimism for near-term price advances.
**Recent Performance:**
Tesla's stock price has steadily reclaimed ground from its September lows, reflecting positive sentiment about its Q3 delivery numbers and anticipated earnings boost. Over the past two weeks, Tesla has gained over 7%, pushing past key moving averages and reclaiming a bullish trajectory. This recovery has correlated with a broader EV sector rally and news of advancing battery technologies, setting Tesla apart as a pinnacle of industry innovation.
**Expert Analysis:**
Technical analysts highlight Tesla's significant strength above its 50-day and 200-day moving averages, anchoring its bullish bias. Trading volume confirmed Tesla's resilience in maintaining upward momentum, with heavy institutional accumulation seen in Level II order books. The MACD (Moving Average Convergence Divergence) has crossed bullishly into positive territory, while the Bollinger Bands suggest Tesla could expand volatility, matching historical price climbs in similar market conditions.
Fundamentally, Tesla continues to dominate industry headlines with forward-looking projects, such as AI and robotics expansion, paired with strong market execution in clean energy. Analysts collectively align on Tesla's ability to meet favorable revenue benchmarks by leveraging innovative technology offerings beyond automobile sales.
**News Impact:**
Recent updates around Tesla's ramp-up of Cybertruck production and growth in Chinese Gigafactory capacity have reinforced optimism. Furthermore, CEO Elon Musk's commentary on new battery breakthroughs has grabbed investor attention, promising a transformational impact on Tesla margins. These developments compounded by robust EV subsidies across global markets point toward mid-to-long-term strength in Tesla shares.
**Trading Recommendation:**
Given Tesla's strong technical formations, improving sentiment metrics, and fundamental catalysts, a long position may offer substantial upside. Conservative traders may target $349 initially, while higher targets around $365 align with Tesla's broader market potential during the next leg upward. With appropriate stop levels set below supportive zones ($310-$320), this trade setup offers a favorable risk-reward ratio for bullish traders.
Do you want to save hours every week? Register for the free weekly update in your language!
Tesla's Key Resistance Test: Why Price Action May Signal $400 Br
Current Price: $340.01
Direction: LONG
Targets:
- T1 = $380.00
- T2 = $400.00
Stop Levels:
- S1 = $325.00
- S2 = $310.00
**Wisdom of Professional Traders:**
This analysis leverages the collective expertise of thousands of professional traders and market specialists who closely monitor Tesla's price action and fundamental developments. By drawing from aggregated insights and technical consensus, this report identifies Tesla as a high-probability candidate for a bullish breakout, capitalizing on its current upward momentum and favorable market conditions.
**Key Insights:**
Tesla's current price action is showcasing strong upward momentum as the stock rebounds from technical support levels around $320. The recent push above the psychological barrier of $340 signals renewed investor confidence driven by robust fundamentals, including continued innovation in the EV space and improved delivery numbers. Additionally, Tesla's diversification into new segments, such as energy storage solutions, bolsters long-term growth potential.
From a technical perspective, Tesla is approaching a significant resistance level near $360, which, if broken, could accelerate price movement toward $380 and potentially $400 in the near term. Traders note that the Relative Strength Index (RSI) sits in a bullish yet non-overheated zone, suggesting further upside without imminent risk of correction. Moreover, increased volume in recent sessions implies strong institutional buying interest.
**Recent Performance:**
Tesla has demonstrated stability over the past month, recovering from a dip below $320. The stock has climbed approximately 6% in the last two weeks on the back of positive sentiment surrounding the company’s ability to outperform in a challenging macroeconomic environment. After reporting better-than-expected delivery figures for the previous quarter, Tesla's shares have seen heightened trading activity, indicating widespread interest among retail and institutional investors alike.
**Expert Analysis:**
Technical experts highlight Tesla’s well-established support levels around $325 as a strong base for continued upside. The stock is showing patterns consistent with ascending triangles, often seen as markers of bullish continuation. Furthermore, analysts point to Tesla’s improving gross margins and its ability to maintain pricing power in the EV market as critical factors supporting a sustained rally.
Tesla's ongoing product innovation, including advancements in battery technology and the anticipated release of its Cybertruck, has solidified investor sentiment. Analysts forecast that these developments could serve as additional catalysts to propel the stock toward its upper targets.
**News Impact:**
Recent reports about Tesla’s advanced self-driving technology and partnerships to expand its charging network have amplified the already positive outlook. Furthermore, strong quarterly delivery numbers reinforce Tesla's leadership in the EV industry, pushing markets to reassess its valuation upward. Policy support for green energy initiatives globally continues to favor Tesla, which remains the dominant player in renewable-focused automotive solutions.
**Trading Recommendation:**
A long position in Tesla at current levels is supported by technical indicators, robust fundamentals, and favorable industry dynamics. The breakout above $360 resistance could unlock substantial upside potential toward $400. With a recommended stop at $325, traders can limit downside exposure while capitalizing on Tesla's strategic positioning and momentum to the upside. This trade aligns with consensus-driven information and professional forecasts, emphasizing strong risk-reward potential.
Do you want to save hours every week? Register for the free weekly update in your language!

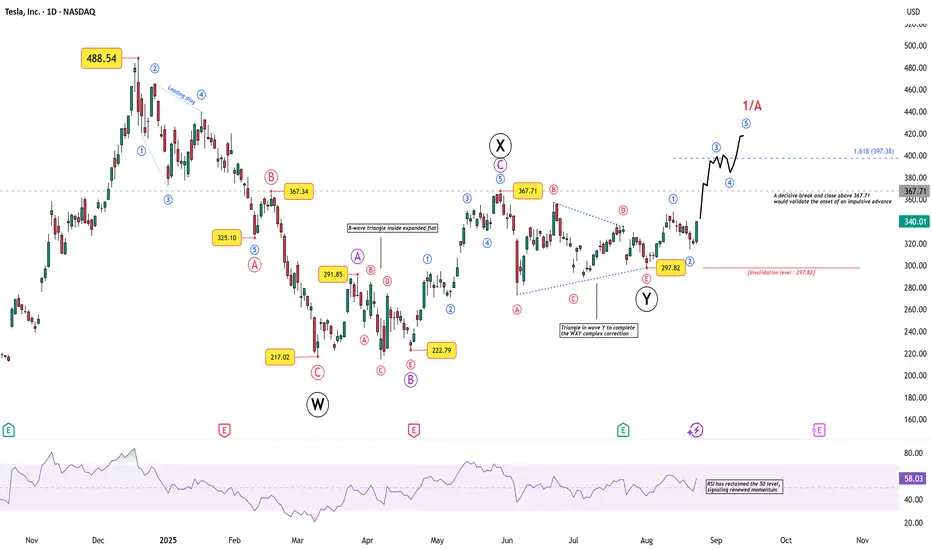
Tesla’s Breakout Test: Impulse or Fakeout?Tesla’s recent price action is stirring interest again, not just for retail traders but also for chart technicians who track Elliott Wave structures across global equities.
After a deep corrective phase that carried price down from 488.54 to 217.02 , Tesla has been carving out a multi-layered corrective structure. Here’s the breakdown:
Wave W completed into 217.02 , marking a sharp low.
This was followed by a complex X wave , which included an expanded flat where the B-wave unfolded as a triangle — a rare but valid corrective formation.
Wave Y then ended with a contracting triangle, neatly completing the W–X–Y correction near 297.82 .
From that point, Tesla appears to have begun an impulsive sequence:
Wave 1 and 2 are already visible, with the 297.82 low as the key invalidation level.
A decisive break and close above 367.71 would confirm the onset of Wave 3, targeting 397.38 (1.618× Wave 1).
Momentum is supporting the structure: RSI has reclaimed the 50 level, hinting at renewed strength.
What Next?
If the count holds, Tesla could be in the early stages of a larger impulsive rally, with Wave 1/A projecting toward the 400–420 zone . However, traders should remember that breaking below 297.82 invalidates the impulsive outlook and revives the broader corrective scenario.
Disclaimer: This analysis is for educational purposes only and does not constitute investment advice. Please do your own research (DYOR) before making any trading decisions.
TESLA 20TH AUGUST 2025price action for Tesla is here. I have clearly explained my plan on how to trade tesla considering every factor in market.
NOTE: OPTION WILL BURN YOUR CAPITAL

TeslaLooking at the current price action from today, we have a couple of options as to what is going on. The first one I want to discuss aligns with the orange count. This recent move lower could be the b wave of C of (B). If that is the case, then we should be headed higher very soon towards the orange box to finish out the intermediate (B) wave.
If that is not the case, then that would imply that we have started the c of (c) of A of (C). If the white count is correct, I would anticipate it to be strong move as it would be a c wave of multiple different degrees.
Either way, both moves that this could be, IMO, are each c waves of some degree. This implies that the next move should have some strength to it. I continue to favor the orange count, but as mentioned prior, they're both easily possible.

TSLA (swingtrade) Bull flag1. Pattern : Bull flag breakout
2. retest: done
3. sma 50 on hold in D1,W
* could fake break out alway stoploss

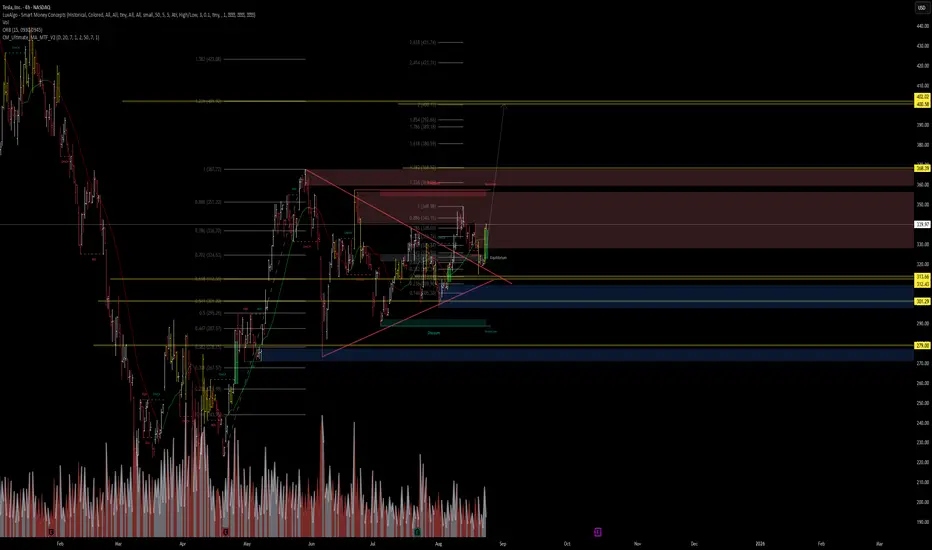
TSLA: AI + Technicals Meets Macro TailwindsAI Forecast (VolanX Protocol)
Current Price: $340.01
30-Day Target: $387.70 → +14.0% upside
Institutional Trade Plan:
Entry: $340.01
Stop Loss: $314.45
Targets: $346.81 / $387.70
Risk/Reward: 1.87:1
Model Agreement: 8/9 bullish
Technical Structure (4H Chart):
Broke above a triangular consolidation, now testing equilibrium from below.
Key support levels: $313.60 / $301.30 (discount zone).
Resistance / extension zones lined up at:
First: $368–$369
Extended: $400–$402 (1.618–2.618 fib levels).
Macro Catalysts & Market Context:
Fed Rate Sentiment Improving: Powell hinted at possible September rate cuts; markets rallied with Tesla leading, rising 6%.
Value Sense Blog
+6
Barron's
+6
Investors
+6
Investopedia
+1
EV Tax Credit Flexibility: New IRS guidance allows buyers to secure the $7,500 credit via contracts before Sept 30, potentially boosting demand.
Investors
+1
Mixed Q2 Fundamentals: Q2 saw declining deliveries & regulatory credits; Musk warned of “rough quarters” ahead, but emphasized AI & robotaxi growth.
Investors
+6
Investors
+6
New York Post
+6
Geopolitical Risks & Tariffs: Tariff pressure, fading EV credits, and sales underperformance in key regions keep long-term risks present. Analyst targets range widely.
Investopedia
MarketWatch
Value Sense Blog
Investors
Probabilistic Outcome Mix:
Base Case (50%) → $346–$368 (near-term resistance test aligned with AI target)
Bull Extension (25%) → $387–$402 if macro tailwinds persist and structure sustains breakout
Bear Risk (25%) → Breakdown below $340 could retest $313–$301
Trade Setup Breakdown:
Long Entry: $340
Stop: $315
Take Profit #1: $368
Take Profit #2: $388
Option: scale into $400s if breakout momentum holds
Why It Matters:
This setup represents AI-driven momentum meeting technical trend alignment and favorable macro catalysts. If Fed signals, EV policy flexibility, and optimism around Tesla’s AI/autonomy can power continued upside, $387–$400 becomes very plausible. However, macro risks and execution hurdles need monitoring.
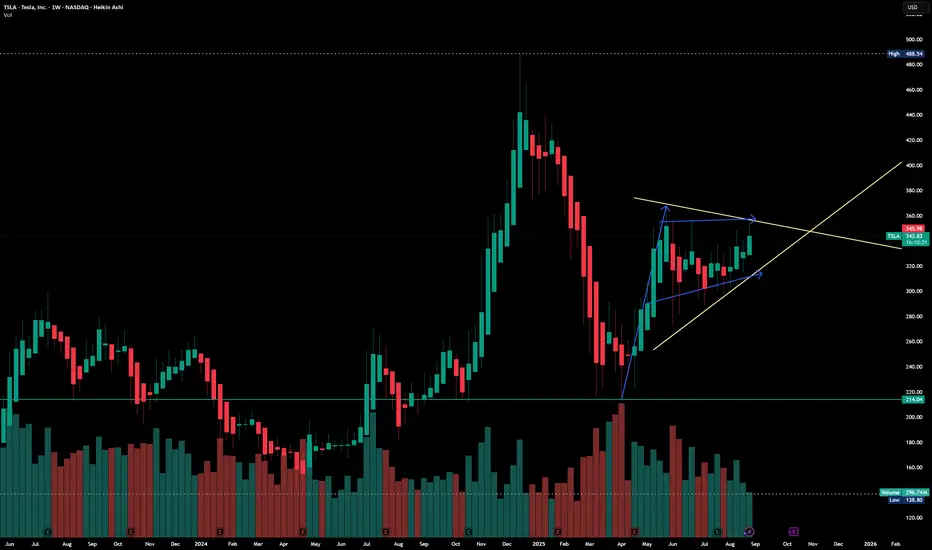
Bullish wedge, again..?If TSLA breaks through this wedge an Elliot Wave and Fib Extension suggest wave 5 would be reached $426.70. I made this chart Thursday and did not publish. Fridays move I don't count because the entire market went up with J Powell said NOTHING. So on a pullback I'd look to enter a position, this move should come in 4-6 weeks or less as wave 5 on TSLA usually lasts a month

$TSLA looks "Cheap" but it can always get cheaperTSLA has been consolidating in a flag here. While price could break up out of it, I actually lean towards price breaking to the downside. The reason is because there have been more tests on the downside, and I think if price falls and tests it again, it'll break.
That and, if you turn on Heikin Ashi candles, it looks like bearish momentum is starting on higher timeframes (1D-4D) and Ichimoku giving bearish warning signals in the cloud formation.
I think the most likely outcome is that we break lower and go test the box below for a new low. Everyone would get bearish down there, but that will be a great level to buy for the long term.

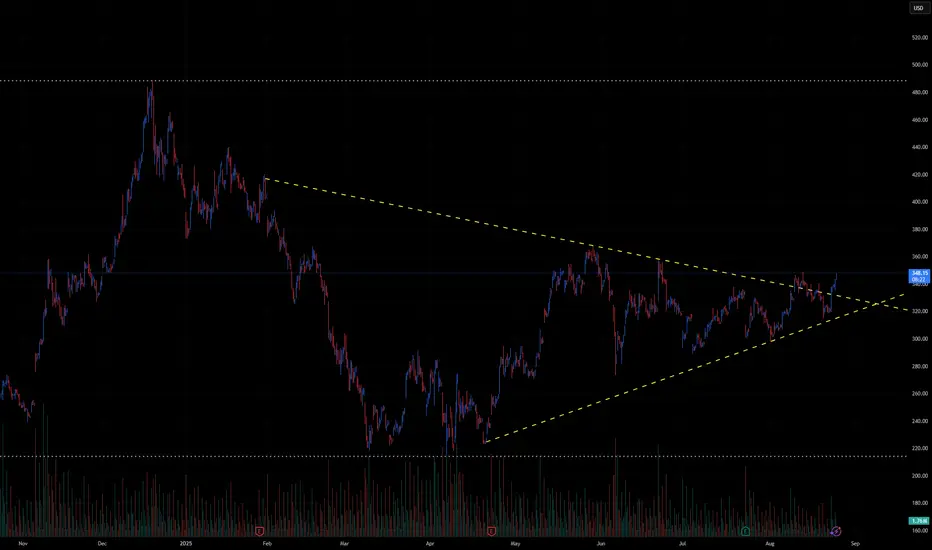
TSLA Technical Outlook – Symmetrical Triangle Breakout Watch🚗 TSLA Technical Outlook – Symmetrical Triangle Breakout Watch
Ticker: TSLA (Tesla, Inc.)
Timeframe: 30-minute candles
🔍 Current Setup
TSLA has been consolidating for months inside a large symmetrical triangle, marked by:
Descending resistance: from ~380 down to ~347.
Ascending support: from April lows near ~240, now rising toward ~320.
Current price: ~348, testing the upper boundary of the triangle.
This structure signals compression after a major downtrend, and the breakout direction will likely define TSLA’s next big move.
📊 Breakout Levels
🚀 Upside (Bullish Scenario)
Trigger: Break and close above 350–355.
Intermediate Targets:
370–380 → First resistance zone.
400–420 → Extension levels.
Measured Move Target: ~450+ (based on the triangle height projection).
🔻 Downside (Bearish Scenario)
Trigger: Failure at resistance and break below 320, confirmation under 310.
Intermediate Supports:
300 → Psychological level.
280–260 → Stronger support zone.
Measured Move Target: ~250 (triangle projection downward).
📈 Volume Analysis
Volume has been contracting steadily during the triangle’s formation.
A major volume spike will be key to confirming whichever direction TSLA chooses.
⚖️ Probability Bias
TSLA is at the make-or-break resistance zone (~350).
A breakout above 355 would strongly favor bulls, targeting 380 → 400+.
But a rejection here and break below 320 would shift momentum bearish, sending TSLA back toward 280–260.
✅ Takeaway
TSLA is at a critical inflection point inside a long-term triangle:
Bullish Break > 355: Targets 370 → 400 → 450+
Bearish Break < 320: Targets 300 → 280 → 250
Watch for volume-backed confirmation, as this move could define Tesla’s next multi-week trend.
#TESLA - $40 Swing?Date: 14-08-2025
#Tesla - Current Price: 339
#Tesla Pivot Point: 339 Support: 331 Resistance: 347
#Tesla Upside Targets:
| 🎯 Target 1 | 356 |
| 🎯 Target 2 | 365 |
| 🎯 Target 3 | 374 |
| 🎯 Target 4 | 384 |
#Tesla Downside Targets:
| 🎯 Target 1 | 323 |
| 🎯 Target 2 | 314 |
| 🎯 Target 3 | 304 |
| 🎯 Target 4 | 295 |
#TradingView #Nifty #BankNifty #DJI #NDQ #SENSEX #DAX #USOIL #GOLD #SILVER

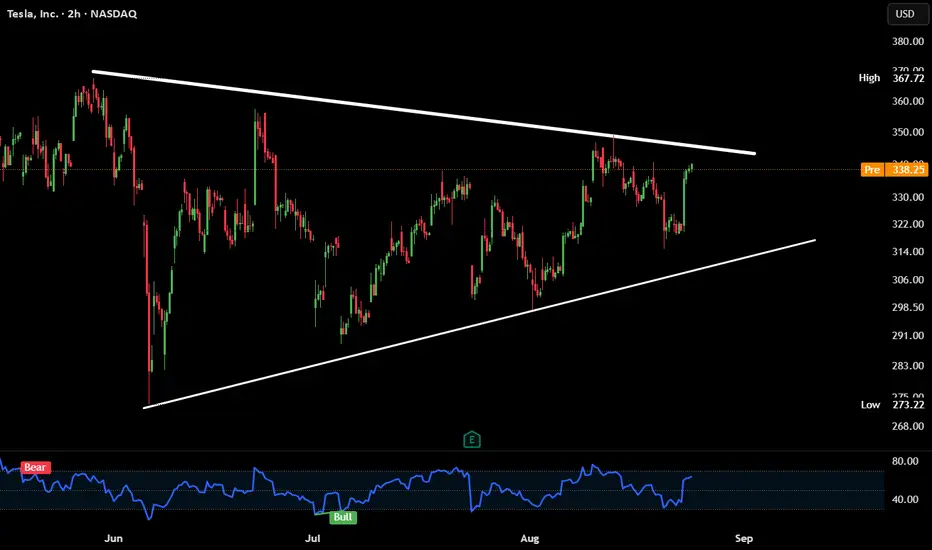
TESLA - Tight range = explosive breakout loading?Breakdown (what the chart shows):
Tesla is forming a symmetrical triangle on the 2H chart. Price is squeezing between higher lows and lower highs.
Currently testing resistance near $338–340. Breakout or rejection incoming.
Confluence:
1. RSI bouncing back from near oversold → bullish momentum returning.
CTA :
Which way do you think it breaks — up or down?
Would you trade the breakout or fade the first move?
TSLA – Buy the Fear or Wait for the Setup?Tesla (TSLA) is once again in the spotlight. Between robo-taxi hype, new product launches, and ongoing political noise around Elon Musk, the stock has become one of the hottest trading stories on the market. But as always the chart tells us where to act.
Entry Levels
$330 – First line of defense, early buyers may step in here
$295 – Stronger support, better reward-to-risk zone
$255 – Deep pullback level, only triggered on market weakness
🎯 Profit Targets
TP1: ~$345 → ~5% move from $330 entry
TP2: ~$370–$380 → 12–15% move depending on entry
TP3: ~$400–$420 → 18–20% move on a sustained breakout
Tesla remains a trader’s stock: volatile, narrative-driven, and technically reactive. If it holds the $330 zone, momentum traders could see a quick bounce. If we dip to $295 or even $255, that could be the bigger opportunity for those with patience.
No one knows which path the market chooses, but the plan is set. Trade the structure, not the noise.
⚠️ Disclaimer: This is not financial advice. I’m sharing my personal analysis and trade levels. Always do your own research and manage risk responsibly.
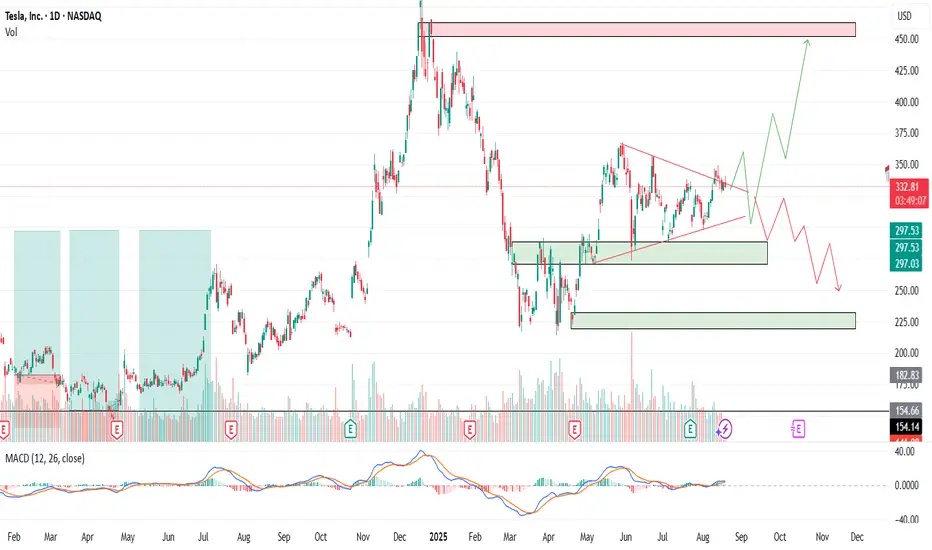
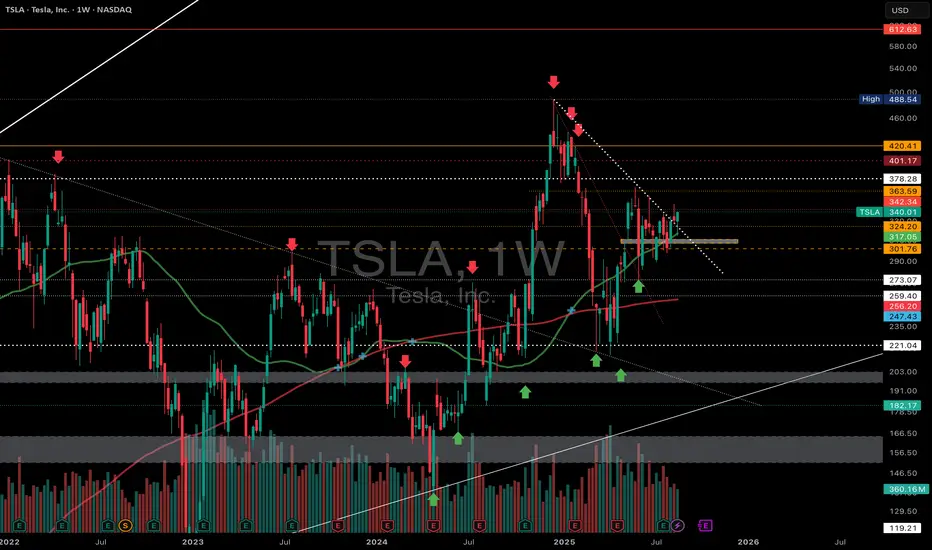
TSLA – Tesla Inc. | Daily Chart AnalysisNASDAQ:TSLA – Tesla Inc. | Daily Chart Analysis
Tesla ( NASDAQ:TSLA ) is currently navigating a critical technical region after a sharp +6.22% move, closing at $340.01.
🔍 Key Technical Developments:
• Break of Downtrend: Price broke above the descending trendline (dotted white) that had been rejecting rallies since the $488 peak. This breakout was followed by consolidation just above support.
• Support Zone: The $320–$325 region (highlighted box) has been tested multiple times and is now acting as a solid demand area.
• Moving Averages: TSLA is holding above both the 50 day (green) and 200-day (red) MAs bullish posture.
• Trend Reversal Structure: Higher lows forming since April 2025, supported by increasing volume on up moves a constructive bullish base.
📌 Key Levels to Watch:
• Resistance:
◦ $342.34 (current test)
◦ $363.59 (next major level)
◦ $378.28 and $401.17 as higher resistance zones
• Support:
◦ $324.20 / $321.84
◦ $301.76
◦ Below that: $273.07
📈 Current Price: $340.01 (+6.22%)
Tesla is attempting to break out of a long-term downtrend structure. A sustained move above $342–$344 could ignite momentum toward $360+.
📊 Watch for volume confirmation and reaction at major resistance zones.
#Tesla #TSLA #Stocks #TechnicalAnalysis #Breakout #ElonMusk #Trading #NASDAQ